| Param | Original file | Final file |
|---|---|---|
| Filename | modeM0/AS1A14_022T16_9000006532_55165cztM0_level2.fits | modeM0/AS1A14_022T16_9000006532_55165cztM0_level2_quad_clean.evt |
| Size (bytes) | 475,493,760 | 100,010,880 |
| Size | 453.5 MB | 95.4 MB |
| Events in quadrant A | 4,956,407 | 643,468 |
| Events in quadrant B | 4,169,555 | 691,976 |
| Events in quadrant C | 4,122,334 | 612,112 |
| Events in quadrant D | 3,804,765 | 589,074 |
| Mode SS | |||
|---|---|---|---|
| Quadrant | BADHDUFLAG | Total packets | Discarded packets |
| A | 0 | 146 | 0 |
| B | 0 | 146 | 0 |
| C | 0 | 146 | 0 |
| D | 0 | 146 | 0 |
| Mode M0 | |||
|---|---|---|---|
| Quadrant | BADHDUFLAG | Total packets | Discarded packets |
| A | 0 | 19499 | 2 |
| B | 0 | 17819 | 3 |
| C | 0 | 17342 | 2 |
| D | 0 | 16501 | 2 |
| Mode M9 | |||
|---|---|---|---|
| Quadrant | BADHDUFLAG | Total packets | Discarded packets |
| A | 0 | 14 | 0 |
| B | 0 | 14 | 0 |
| C | 0 | 14 | 0 |
| D | 0 | 14 | 0 |
| Quadrant | Total seconds | Saturated seconds | Saturation percentage |
|---|---|---|---|
| A | 7055 | 296 | 4.195606% |
| B | 7055 | 284 | 4.025514% |
| C | 7055 | 255 | 3.614458% |
| D | 7055 | 141 | 1.998583% |
Noise dominated data is calculated using 1-second bins in cleaned event files. If a bin has >2000 counts, and if more than 50% of those come from <1% of pixels, then it is considered to be noise-dominated and hence unusable.
| Quadrant | # 1 sec bins | Bins with >0 counts | Bins with >2000 counts | High rate bins dominated by noise | Noise dominated (total time) | Noise dominated (detector-on time) | Marked lightcurve |
|---|---|---|---|---|---|---|---|
| A | 8530 | 7057 | 229 | 229 | 2.68% | 3.25% | 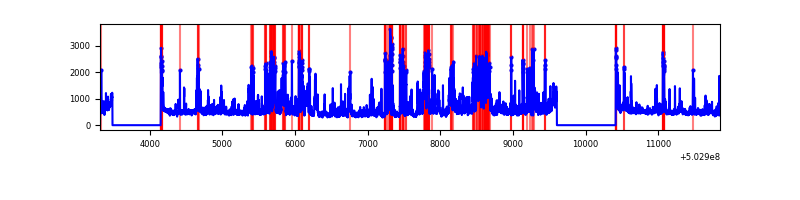 |
| B | 8530 | 7057 | 149 | 149 | 1.75% | 2.11% | 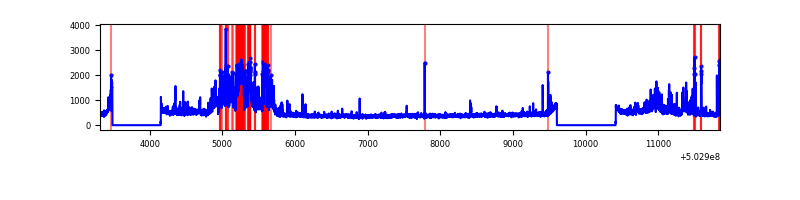 |
| C | 8530 | 7057 | 158 | 158 | 1.85% | 2.24% | 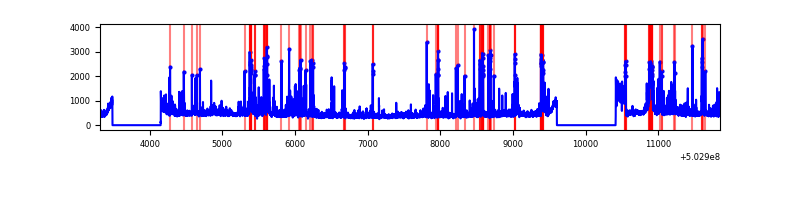 |
| D | 8530 | 7057 | 66 | 66 | 0.77% | 0.94% | 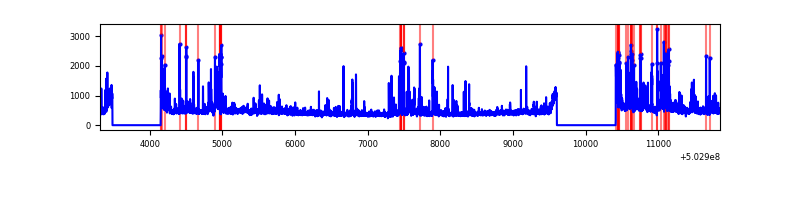 |
Top three noisy pixels from each quadrant. If the there are fewer than three noisy pixels in the level2.evt file, extra rows are filled as -1
| Pixel properties | Quadrant properties | ||||||
|---|---|---|---|---|---|---|---|
| Quadrant | DetID | PixID | Counts | Sigma | Mean | Median | Sigma |
| A | 3 | 78 | 1850903 | 9963.92 | 752 | 735 | 185.7 |
| A | 3 | 45 | 59692 | 317.51 | 752 | 735 | 185.7 |
| A | 12 | 115 | 42983 | 227.52 | 752 | 735 | 185.7 |
| B | 2 | 249 | 1027270 | 6335.71 | 745 | 714 | 162.0 |
| B | 5 | 185 | 100321 | 614.76 | 745 | 714 | 162.0 |
| B | 1 | 207 | 50606 | 307.92 | 745 | 714 | 162.0 |
| C | 10 | 22 | 629072 | 3100.21 | 737 | 728 | 202.7 |
| C | 13 | 3 | 192391 | 945.65 | 737 | 728 | 202.7 |
| C | 1 | 16 | 114856 | 563.1 | 737 | 728 | 202.7 |
| D | 11 | 129 | 385112 | 1858.14 | 738 | 707 | 206.9 |
| D | 6 | 46 | 129691 | 623.48 | 738 | 707 | 206.9 |
| D | 2 | 172 | 89237 | 427.94 | 738 | 707 | 206.9 |
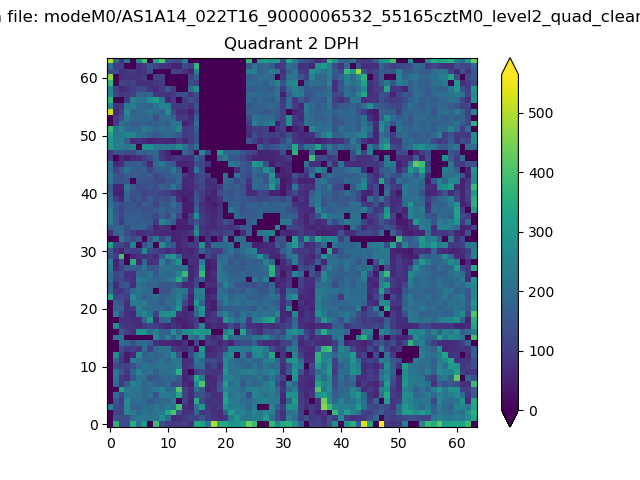
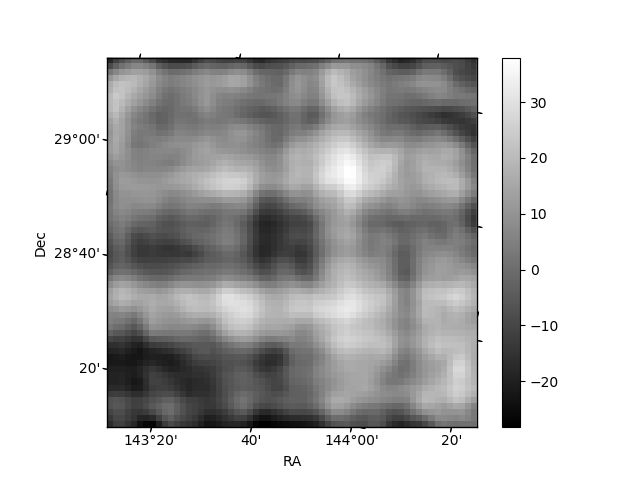
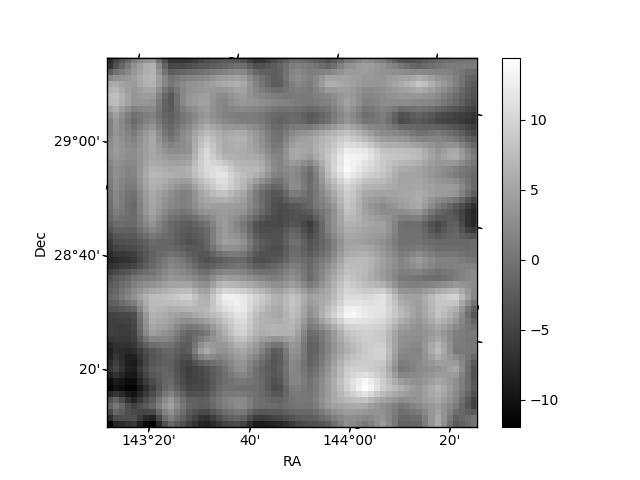
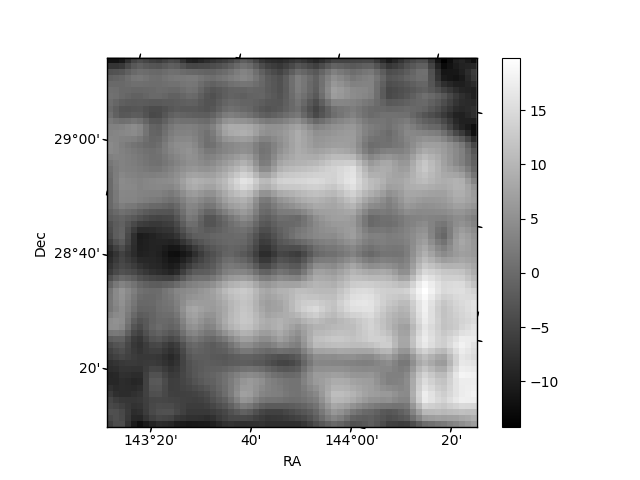
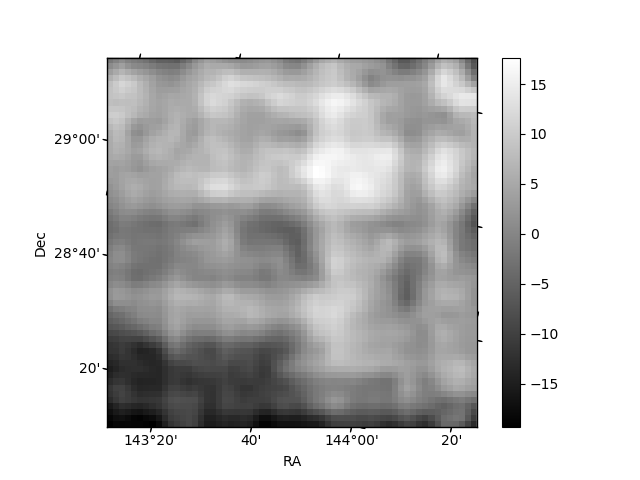
Histogram calculated using DETX and DETY for each event in the final _common_clean file
| Quadrant A | 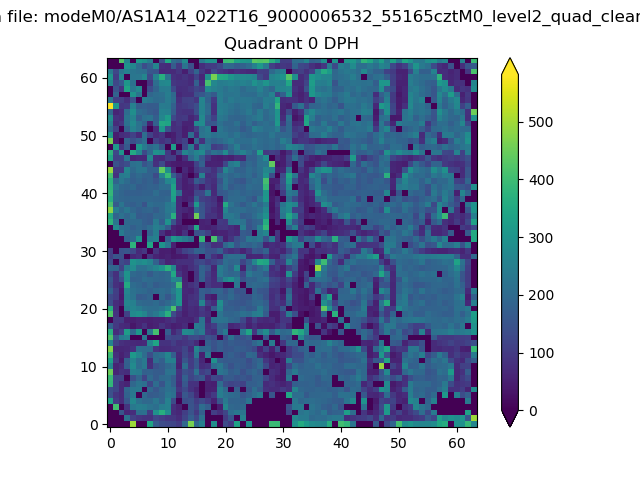 |
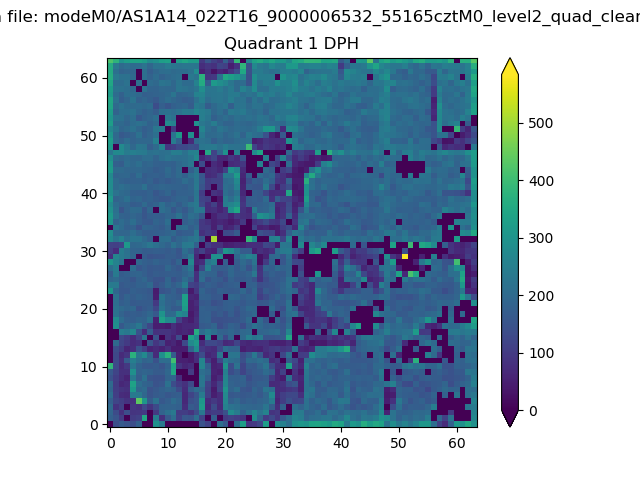 |
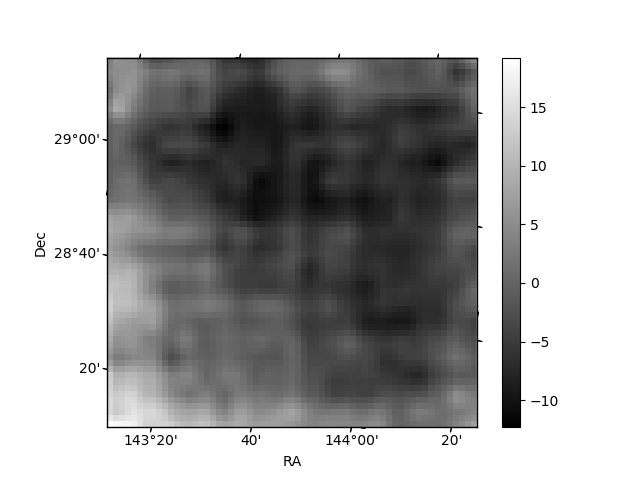
Quadrant B |
|---|---|---|---|
| Quadrant D | 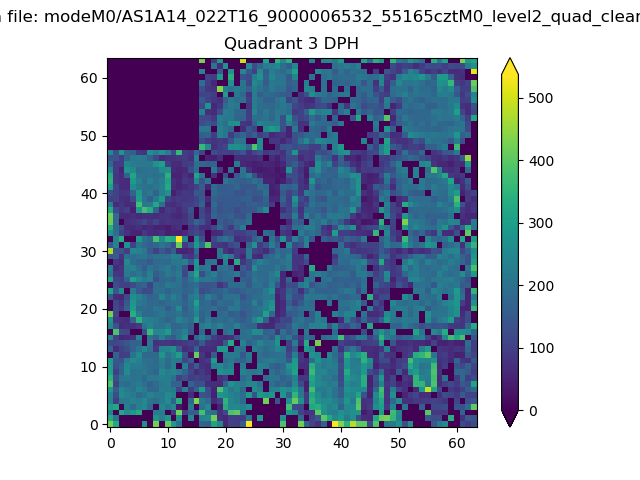 |
 |
Quadrant C |
| Plot type | Count rate plots | Images |
|---|---|---|
| Comparison with Poisson distribution Blue bars denote a histogram of data divided into 1 sec bins. Red curve is a Poisson curve with rate = median count rate of data. |
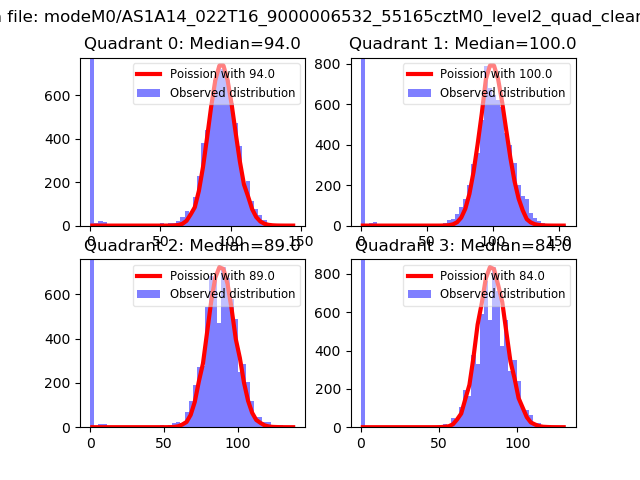 |
 |
| Quadrant-wise count rates Data is divided into 100 sec bins |
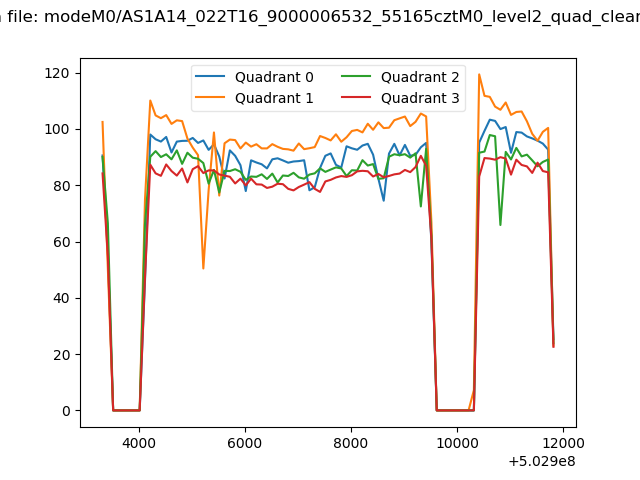 |
|
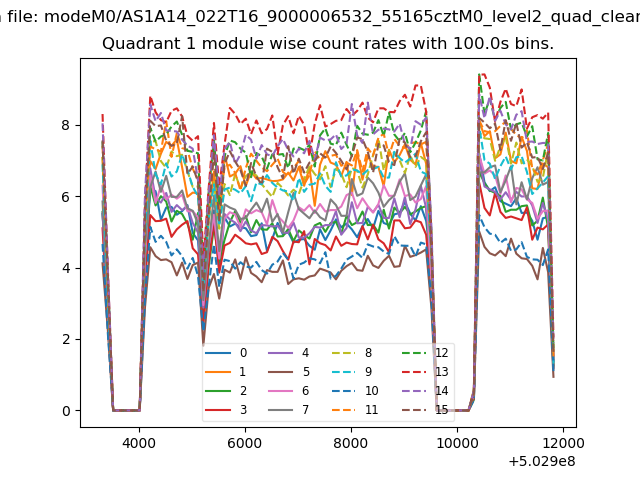
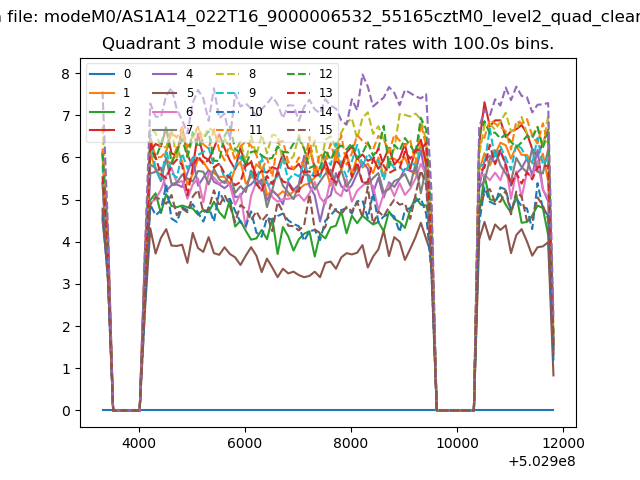
| Module-wise count rates for Quadrant A Data is divided into 100 sec bins |
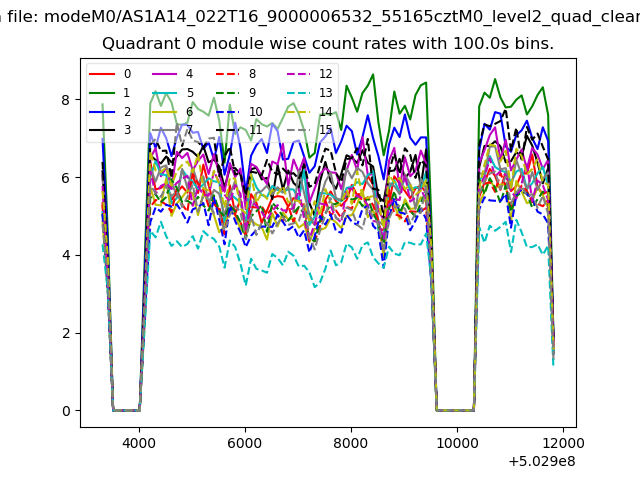 |
 |
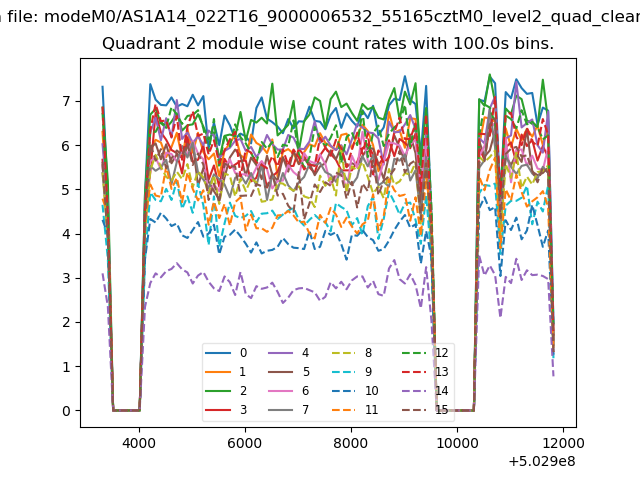
| Module-wise count rates for Quadrant B Data is divided into 100 sec bins |
 |
 |
| Module-wise count rates for Quadrant C Data is divided into 100 sec bins |
 |
 |
| Module-wise count rates for Quadrant D Data is divided into 100 sec bins |
 |
 |
| Parameter | Plot |
|---|---|
| CZT HV Monitor | 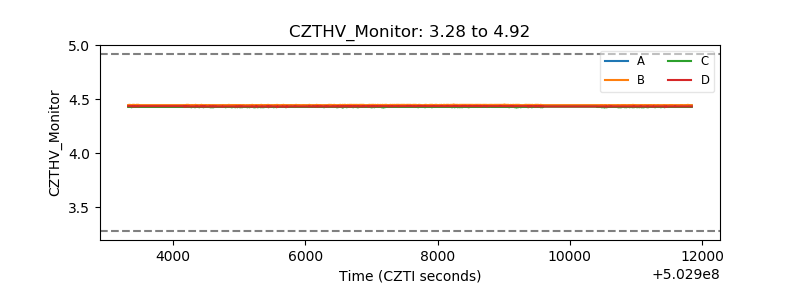 |
| D_VDD | 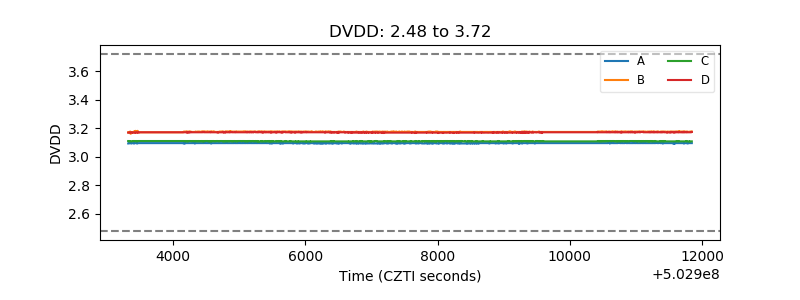 |
| Temperature 1 | 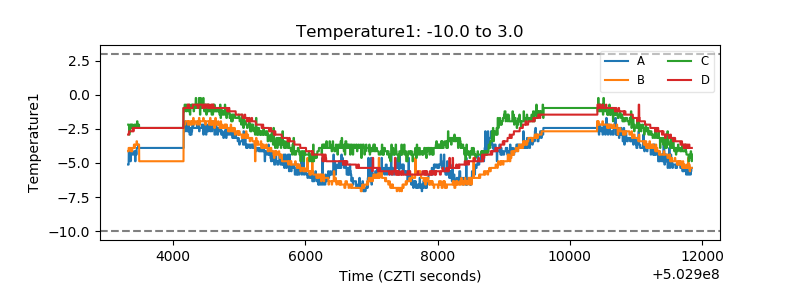 |
| Veto HV Monitor | 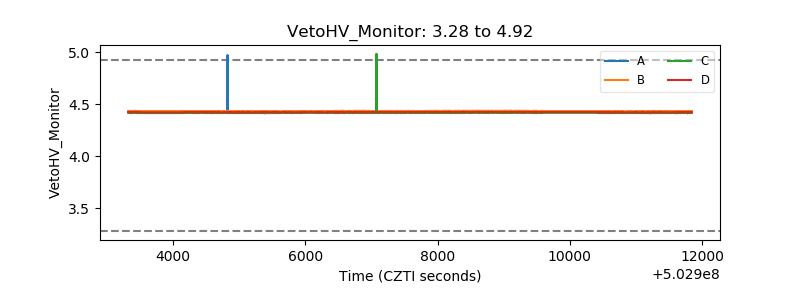 |
| Veto LLD | 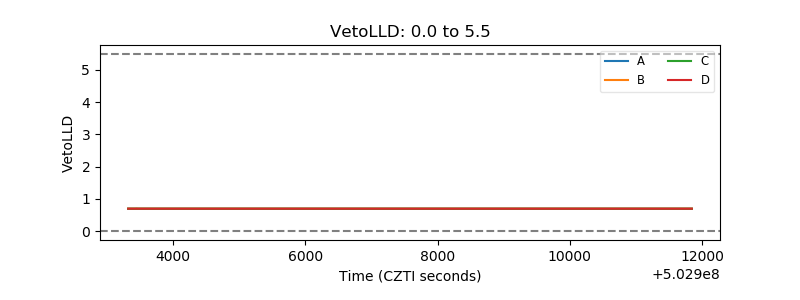 |
| Alpha Counter | 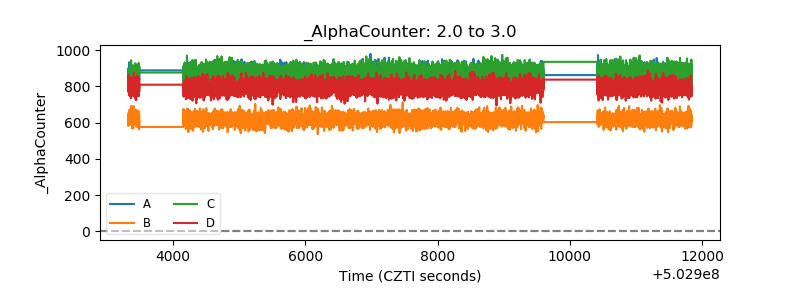 |
| _CPM_Rate | 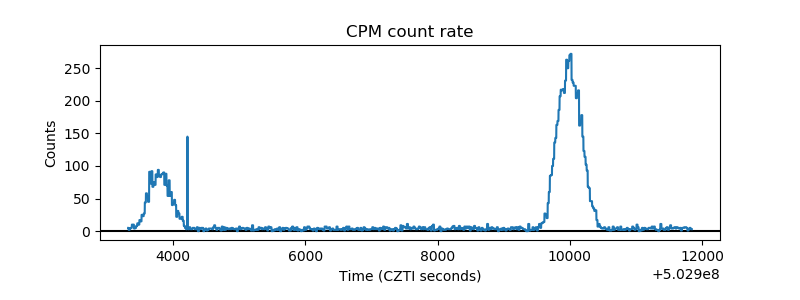 |
| CZT Counter | 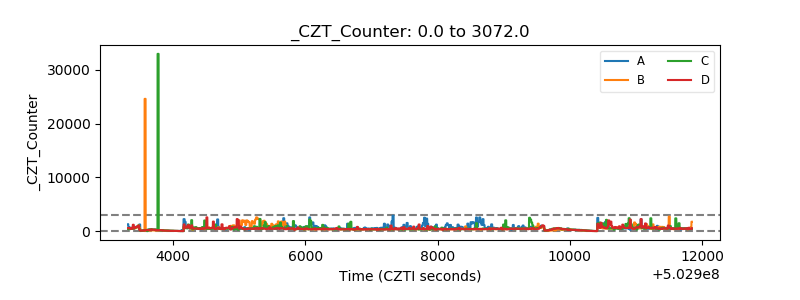 |
| +2.5 Volts monitor | 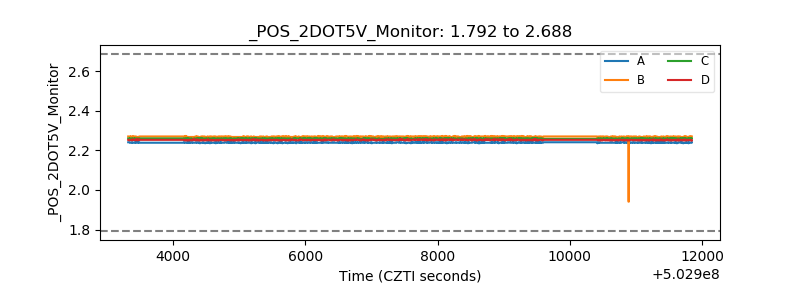 |
| +5 Volts monitor | 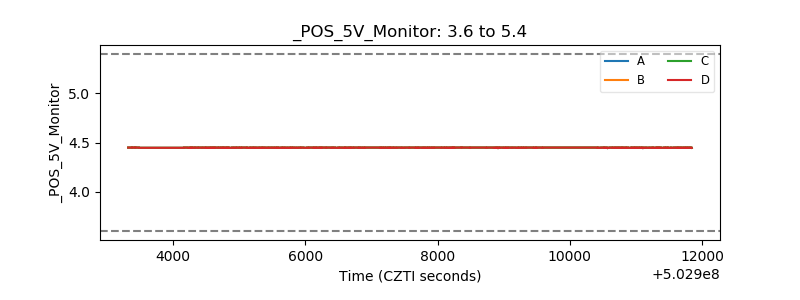 |
| _ROLL_ROT | 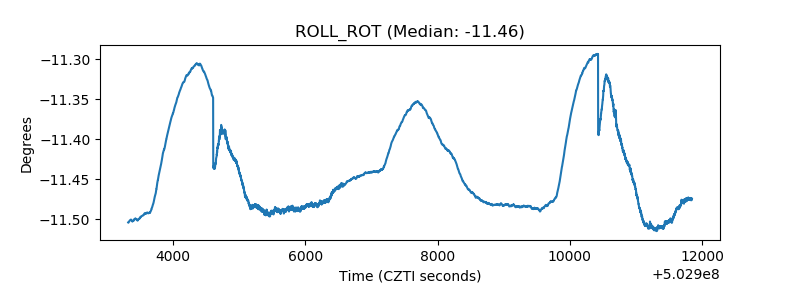 |
| _Roll_DEC | 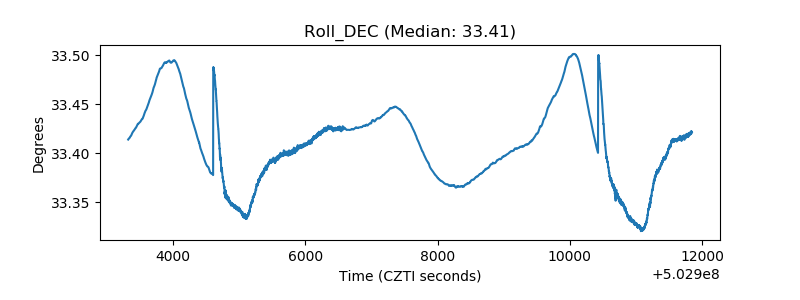 |
| _Roll_RA | 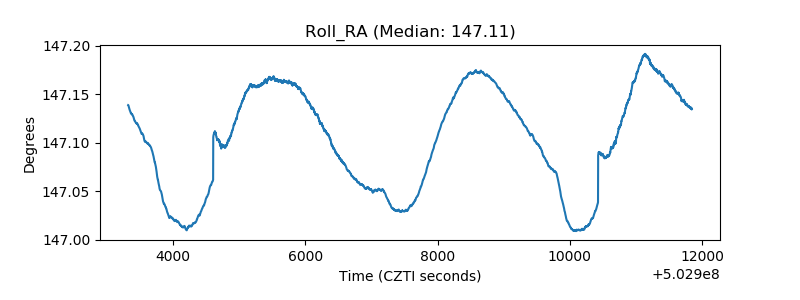 |
| Veto Counter | 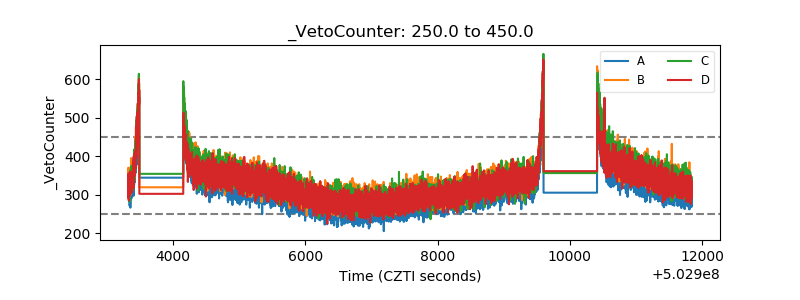 |