| Param | Original file | Final file |
|---|---|---|
| Filename | modeM0/AS1A14_022T16_9000006532_55167cztM0_level2.fits | modeM0/AS1A14_022T16_9000006532_55167cztM0_level2_quad_clean.evt |
| Size (bytes) | 482,408,640 | 95,351,040 |
| Size | 460.1 MB | 90.9 MB |
| Events in quadrant A | 5,845,696 | 595,086 |
| Events in quadrant B | 3,412,850 | 675,938 |
| Events in quadrant C | 3,871,791 | 587,199 |
| Events in quadrant D | 4,205,511 | 561,498 |
| Mode SS | |||
|---|---|---|---|
| Quadrant | BADHDUFLAG | Total packets | Discarded packets |
| A | 0 | 136 | 2 |
| B | 0 | 136 | 0 |
| C | 0 | 136 | 0 |
| D | 0 | 136 | 2 |
| Mode M0 | |||
|---|---|---|---|
| Quadrant | BADHDUFLAG | Total packets | Discarded packets |
| A | 0 | 22206 | 250 |
| B | 0 | 15401 | 111 |
| C | 0 | 16444 | 298 |
| D | 0 | 17587 | 234 |
| Mode M9 | |||
|---|---|---|---|
| Quadrant | BADHDUFLAG | Total packets | Discarded packets |
| A | 0 | 10 | 0 |
| B | 0 | 10 | 0 |
| C | 0 | 10 | 0 |
| D | 0 | 10 | 0 |
| Quadrant | Total seconds | Saturated seconds | Saturation percentage |
|---|---|---|---|
| A | 6705 | 590 | 8.799403% |
| B | 6721 | 144 | 2.142538% |
| C | 6700 | 241 | 3.597015% |
| D | 6712 | 218 | 3.247914% |
Noise dominated data is calculated using 1-second bins in cleaned event files. If a bin has >2000 counts, and if more than 50% of those come from <1% of pixels, then it is considered to be noise-dominated and hence unusable.
| Quadrant | # 1 sec bins | Bins with >0 counts | Bins with >2000 counts | High rate bins dominated by noise | Noise dominated (total time) | Noise dominated (detector-on time) | Marked lightcurve |
|---|---|---|---|---|---|---|---|
| A | 7719 | 6730 | 583 | 583 | 7.55% | 8.66% | 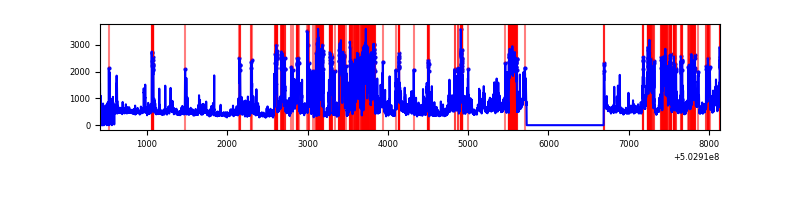 |
| B | 7717 | 6742 | 69 | 69 | 0.89% | 1.02% | 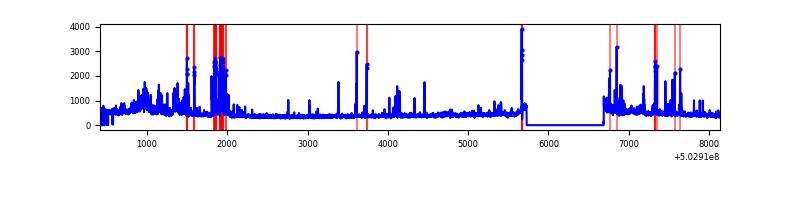 |
| C | 7720 | 6730 | 152 | 152 | 1.97% | 2.26% | 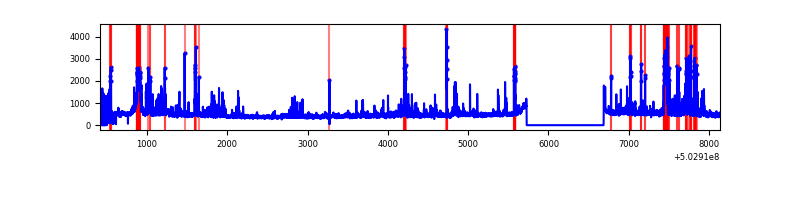 |
| D | 7715 | 6740 | 199 | 199 | 2.58% | 2.95% | 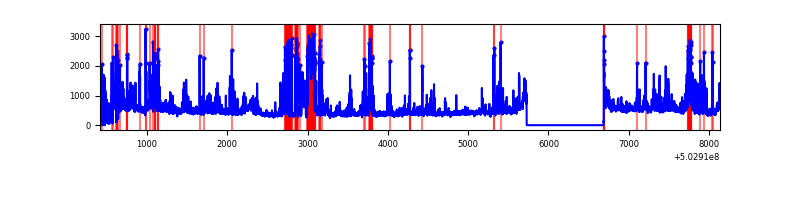 |
Top three noisy pixels from each quadrant. If the there are fewer than three noisy pixels in the level2.evt file, extra rows are filled as -1
| Pixel properties | Quadrant properties | ||||||
|---|---|---|---|---|---|---|---|
| Quadrant | DetID | PixID | Counts | Sigma | Mean | Median | Sigma |
| A | 3 | 78 | 2471239 | 14355.5 | 692 | 675 | 172.1 |
| A | 3 | 14 | 219248 | 1270.04 | 692 | 675 | 172.1 |
| A | 12 | 115 | 180308 | 1043.78 | 692 | 675 | 172.1 |
| B | 2 | 249 | 308744 | 2014.56 | 707 | 681 | 152.9 |
| B | 1 | 207 | 171618 | 1117.83 | 707 | 681 | 152.9 |
| B | 5 | 185 | 98435 | 639.26 | 707 | 681 | 152.9 |
| C | 10 | 22 | 270557 | 1426.17 | 688 | 681 | 189.2 |
| C | 1 | 16 | 263719 | 1390.04 | 688 | 681 | 189.2 |
| C | 13 | 3 | 142896 | 751.54 | 688 | 681 | 189.2 |
| D | 11 | 129 | 1137701 | 5772.12 | 690 | 660 | 197.0 |
| D | 8 | 160 | 80278 | 404.18 | 690 | 660 | 197.0 |
| D | 5 | 173 | 55270 | 277.22 | 690 | 660 | 197.0 |
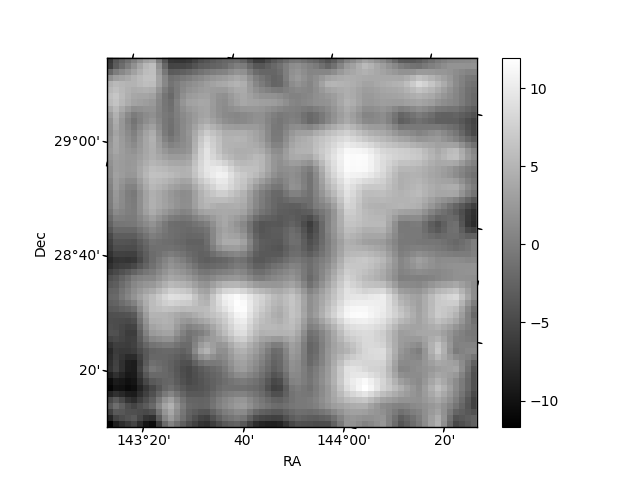
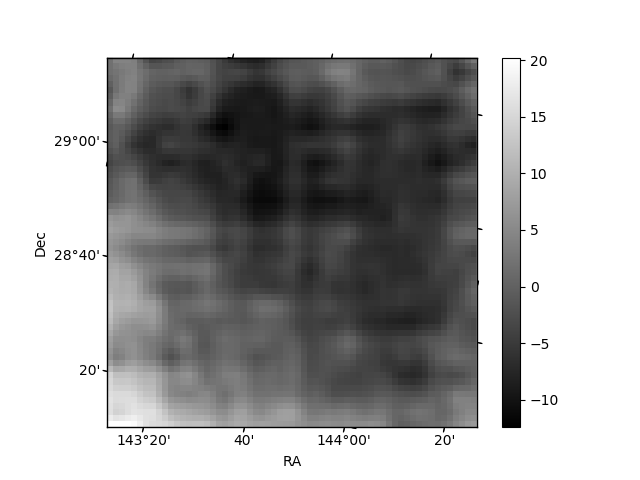
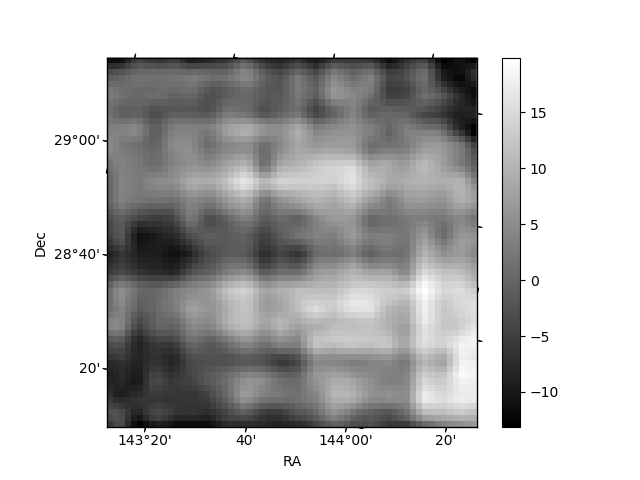
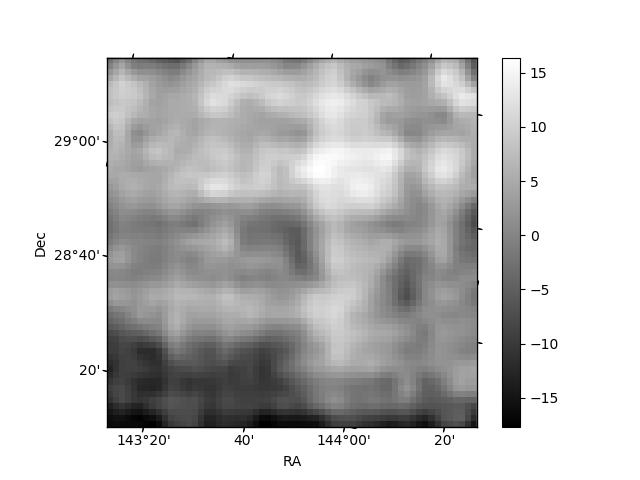
Histogram calculated using DETX and DETY for each event in the final _common_clean file
| Quadrant A | 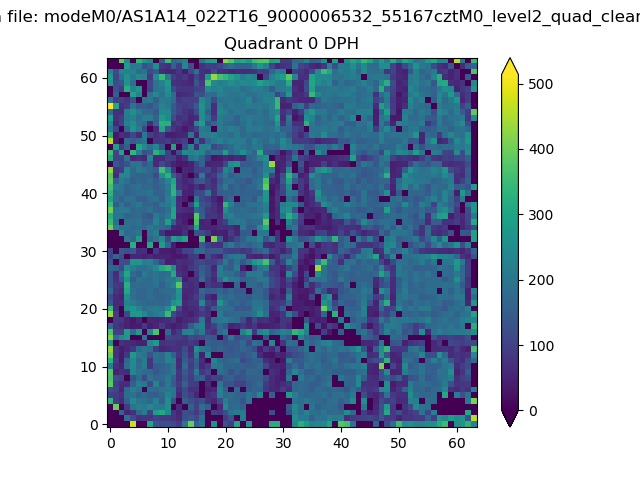 |
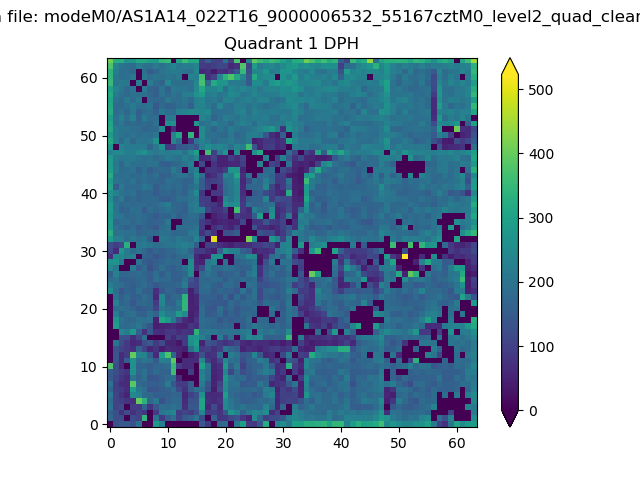 |
Quadrant B |
|---|---|---|---|
| Quadrant D | 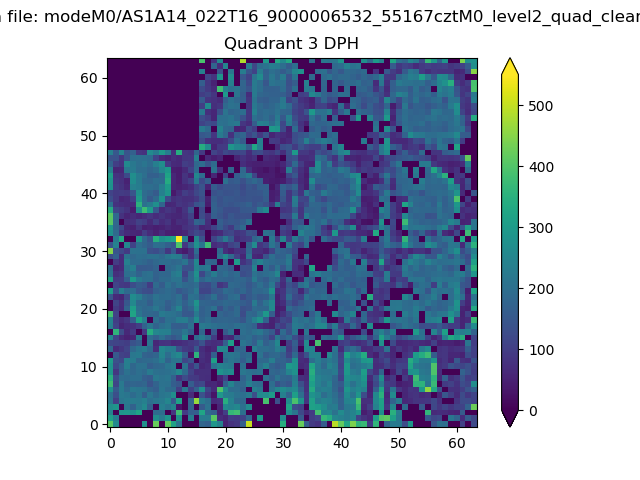 |
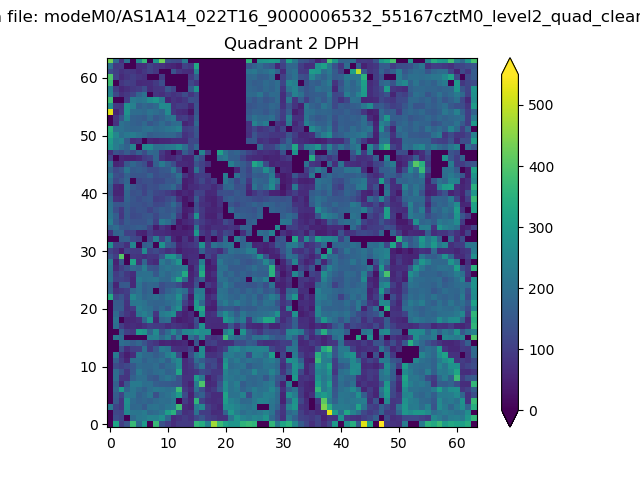 |
Quadrant C |
| Plot type | Count rate plots | Images |
|---|---|---|
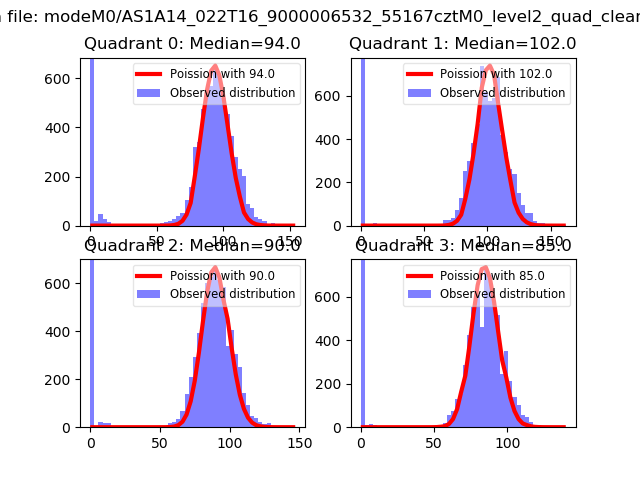
| Comparison with Poisson distribution Blue bars denote a histogram of data divided into 1 sec bins. Red curve is a Poisson curve with rate = median count rate of data. |
 |
 |
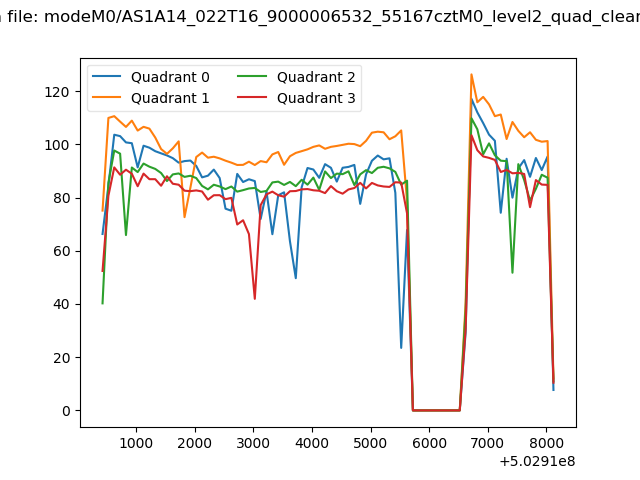
| Quadrant-wise count rates Data is divided into 100 sec bins |
 |
|
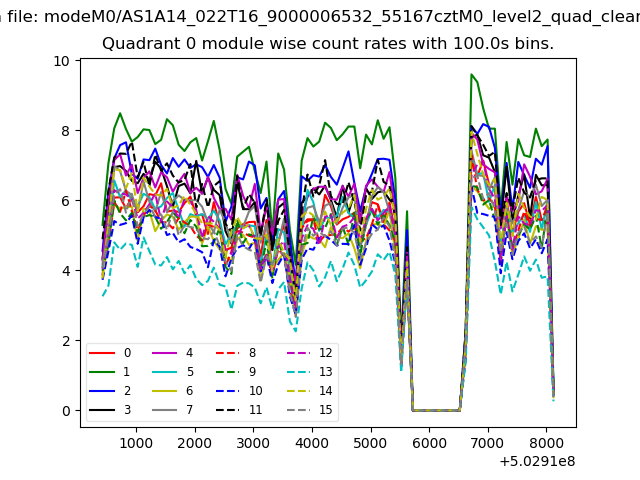
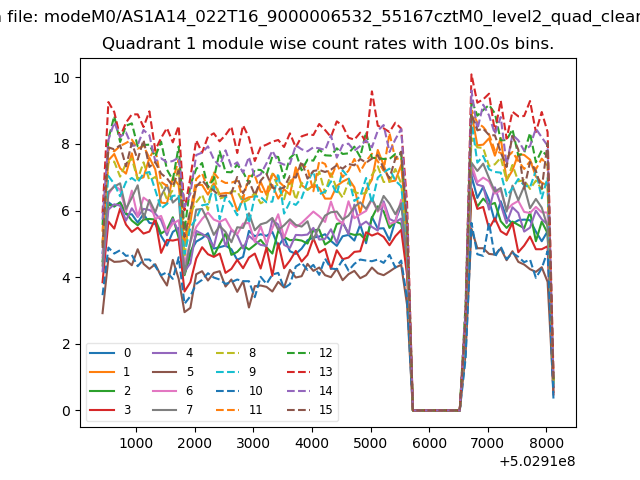
| Module-wise count rates for Quadrant A Data is divided into 100 sec bins |
 |
 |
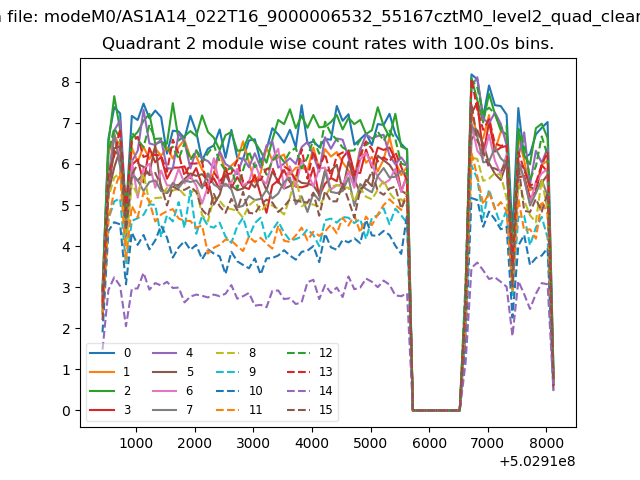
| Module-wise count rates for Quadrant B Data is divided into 100 sec bins |
 |
 |
| Module-wise count rates for Quadrant C Data is divided into 100 sec bins |
 |
 |
| Module-wise count rates for Quadrant D Data is divided into 100 sec bins |
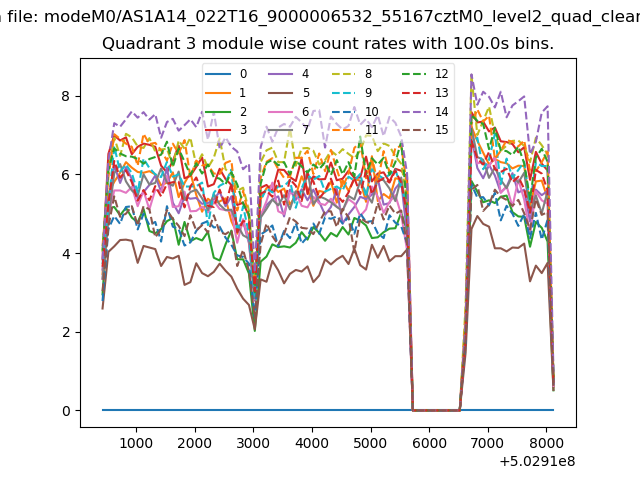 |
 |
| Parameter | Plot |
|---|---|
| CZT HV Monitor |  |
| D_VDD | 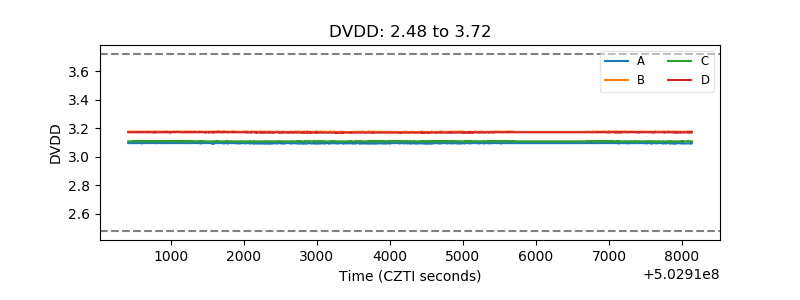 |
| Temperature 1 | 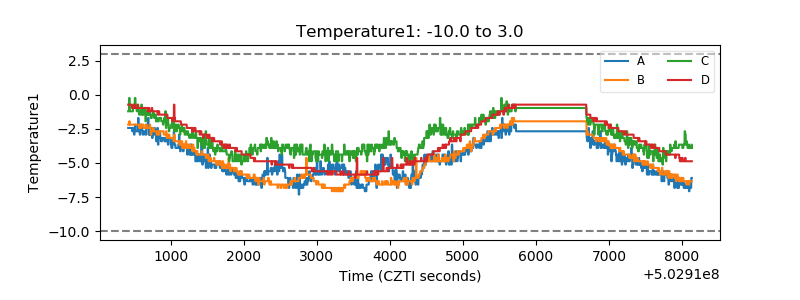 |
| Veto HV Monitor | 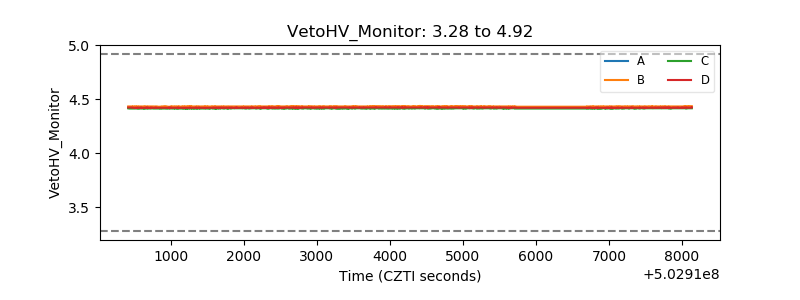 |
| Veto LLD | 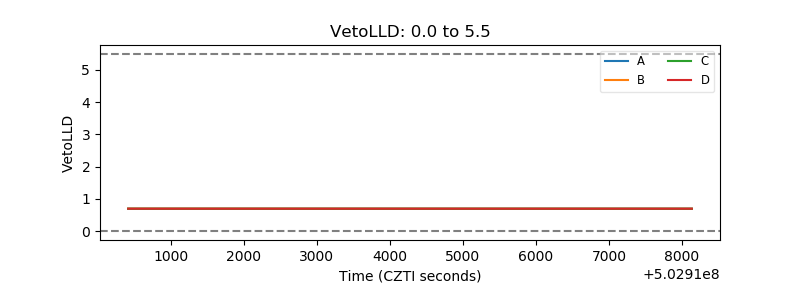 |
| Alpha Counter | 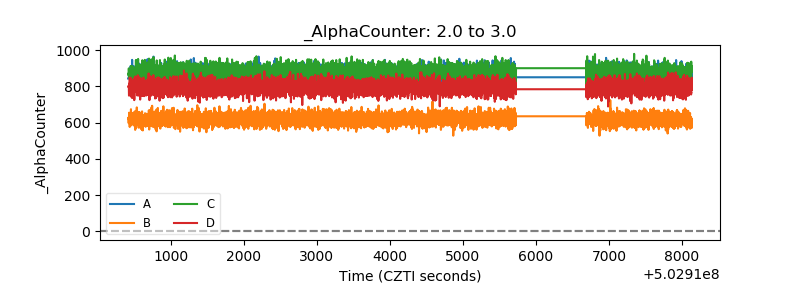 |
| _CPM_Rate | 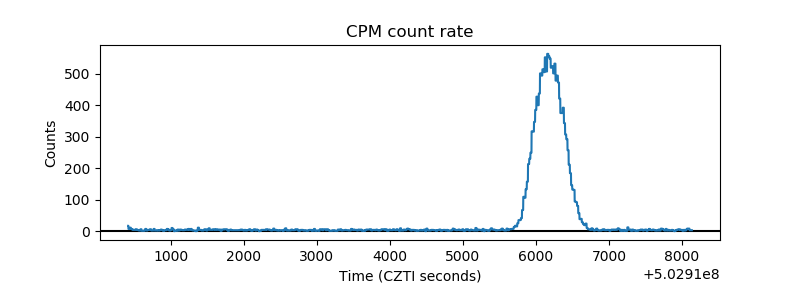 |
| CZT Counter | 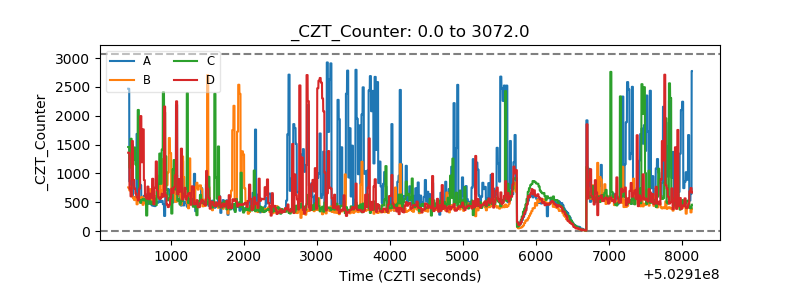 |
| +2.5 Volts monitor |  |
| +5 Volts monitor |  |
| _ROLL_ROT | 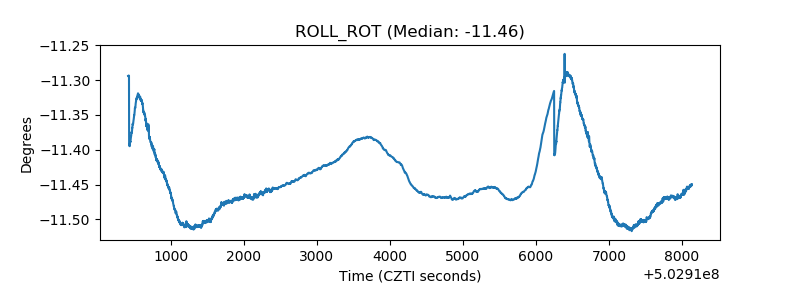 |
| _Roll_DEC | 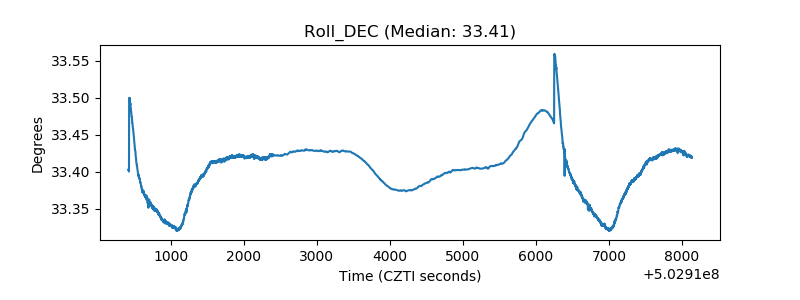 |
| _Roll_RA | 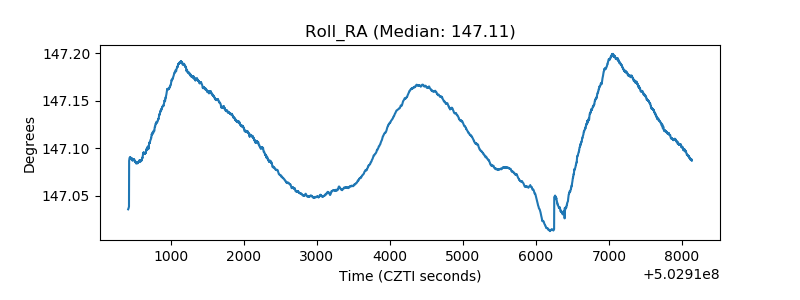 |
| Veto Counter | 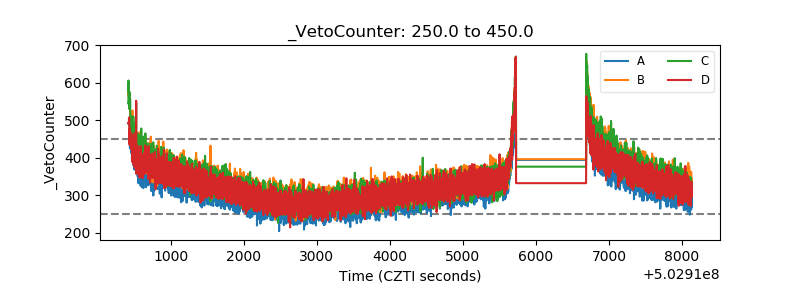 |