| Param | Original file | Final file |
|---|---|---|
| Filename | modeM0/AS1A14_022T16_9000006532_55169cztM0_level2.fits | modeM0/AS1A14_022T16_9000006532_55169cztM0_level2_quad_clean.evt |
| Size (bytes) | 416,471,040 | 96,105,600 |
| Size | 397.2 MB | 91.7 MB |
| Events in quadrant A | 3,967,038 | 620,654 |
| Events in quadrant B | 3,305,845 | 666,764 |
| Events in quadrant C | 3,846,015 | 593,248 |
| Events in quadrant D | 3,769,537 | 556,515 |
| Mode SS | |||
|---|---|---|---|
| Quadrant | BADHDUFLAG | Total packets | Discarded packets |
| A | 0 | 140 | 0 |
| B | 0 | 140 | 0 |
| C | 0 | 140 | 0 |
| D | 0 | 140 | 0 |
| Mode M0 | |||
|---|---|---|---|
| Quadrant | BADHDUFLAG | Total packets | Discarded packets |
| A | 0 | 16659 | 2 |
| B | 0 | 14910 | 3 |
| C | 0 | 16241 | 2 |
| D | 0 | 16038 | 2 |
| Mode M9 | |||
|---|---|---|---|
| Quadrant | BADHDUFLAG | Total packets | Discarded packets |
| A | 0 | 22 | 0 |
| B | 0 | 22 | 0 |
| C | 0 | 22 | 0 |
| D | 0 | 22 | 0 |
| Quadrant | Total seconds | Saturated seconds | Saturation percentage |
|---|---|---|---|
| A | 6787 | 134 | 1.974363% |
| B | 6786 | 156 | 2.298851% |
| C | 6786 | 119 | 1.753610% |
| D | 6786 | 97 | 1.429413% |
Noise dominated data is calculated using 1-second bins in cleaned event files. If a bin has >2000 counts, and if more than 50% of those come from <1% of pixels, then it is considered to be noise-dominated and hence unusable.
| Quadrant | # 1 sec bins | Bins with >0 counts | Bins with >2000 counts | High rate bins dominated by noise | Noise dominated (total time) | Noise dominated (detector-on time) | Marked lightcurve |
|---|---|---|---|---|---|---|---|
| A | 9053 | 6789 | 124 | 124 | 1.37% | 1.83% | 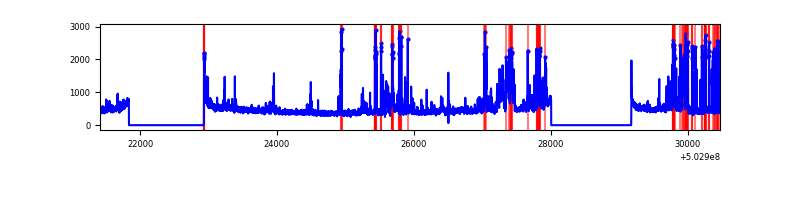 |
| B | 9052 | 6788 | 41 | 41 | 0.45% | 0.60% | 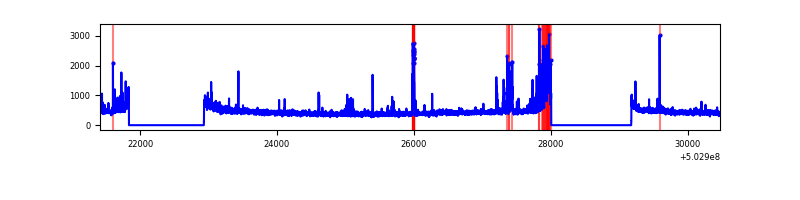 |
| C | 9052 | 6788 | 77 | 77 | 0.85% | 1.13% | 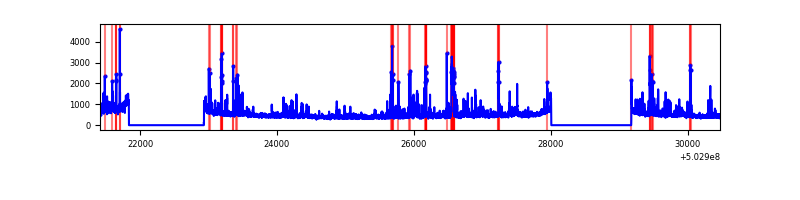 |
| D | 9052 | 6788 | 87 | 87 | 0.96% | 1.28% | 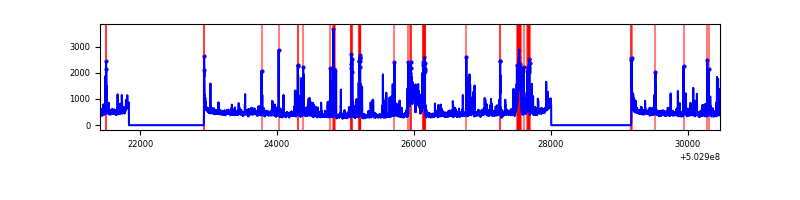 |
Top three noisy pixels from each quadrant. If the there are fewer than three noisy pixels in the level2.evt file, extra rows are filled as -1
| Pixel properties | Quadrant properties | ||||||
|---|---|---|---|---|---|---|---|
| Quadrant | DetID | PixID | Counts | Sigma | Mean | Median | Sigma |
| A | 3 | 78 | 706418 | 3909.28 | 731 | 714 | 180.5 |
| A | 12 | 115 | 312332 | 1726.22 | 731 | 714 | 180.5 |
| A | 4 | 3 | 45327 | 247.14 | 731 | 714 | 180.5 |
| B | 2 | 249 | 304343 | 1932.07 | 726 | 699 | 157.2 |
| B | 5 | 185 | 47182 | 295.77 | 726 | 699 | 157.2 |
| B | 0 | 182 | 29934 | 186.02 | 726 | 699 | 157.2 |
| C | 1 | 16 | 364149 | 1836.02 | 715 | 708 | 198.0 |
| C | 6 | 223 | 224868 | 1132.4 | 715 | 708 | 198.0 |
| C | 13 | 3 | 147748 | 742.81 | 715 | 708 | 198.0 |
| D | 11 | 129 | 505029 | 2506.82 | 708 | 679 | 201.2 |
| D | 2 | 31 | 211423 | 1047.48 | 708 | 679 | 201.2 |
| D | 11 | 176 | 110969 | 548.18 | 708 | 679 | 201.2 |
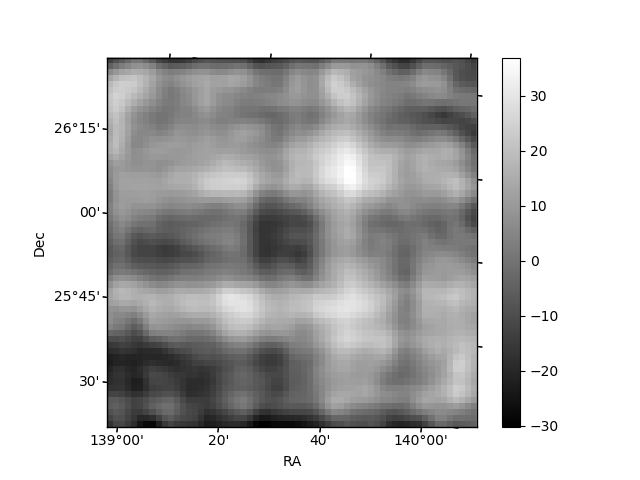
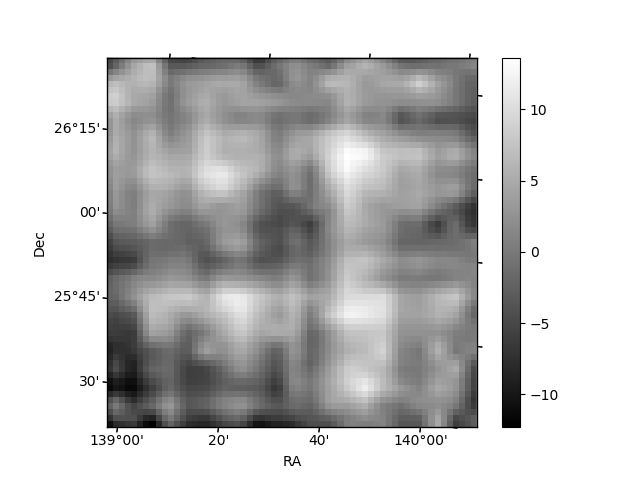
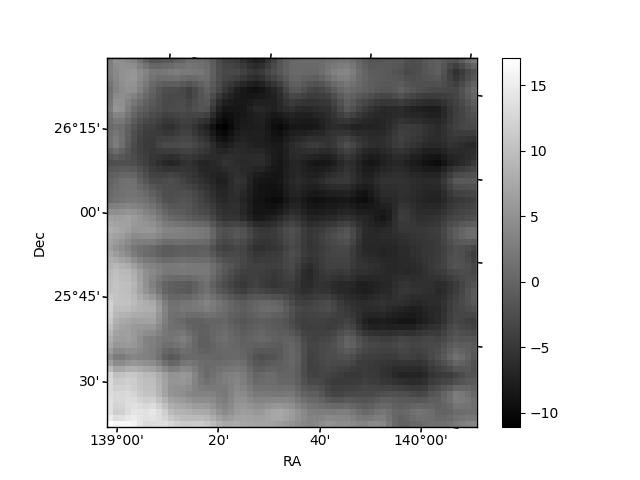
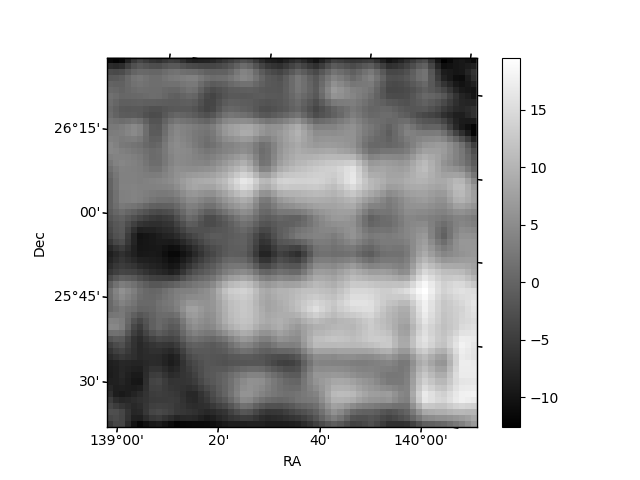
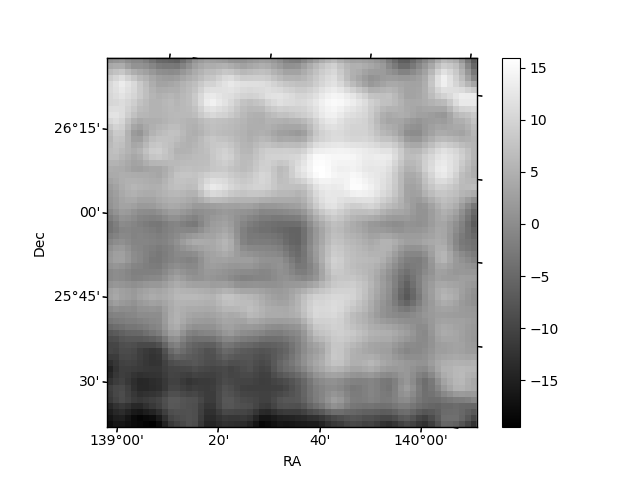
Histogram calculated using DETX and DETY for each event in the final _common_clean file
| Quadrant A | 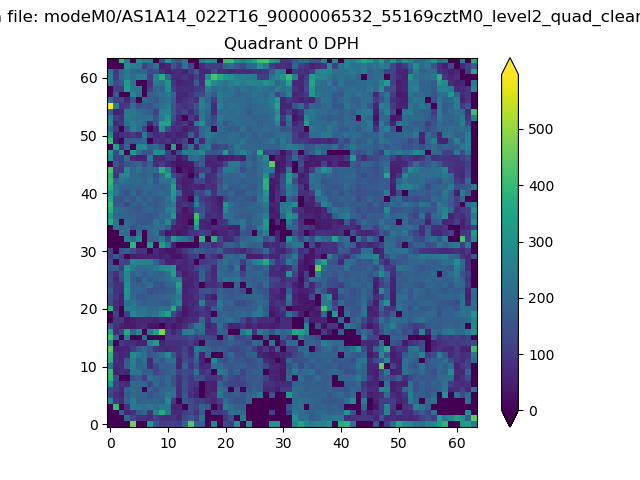 |
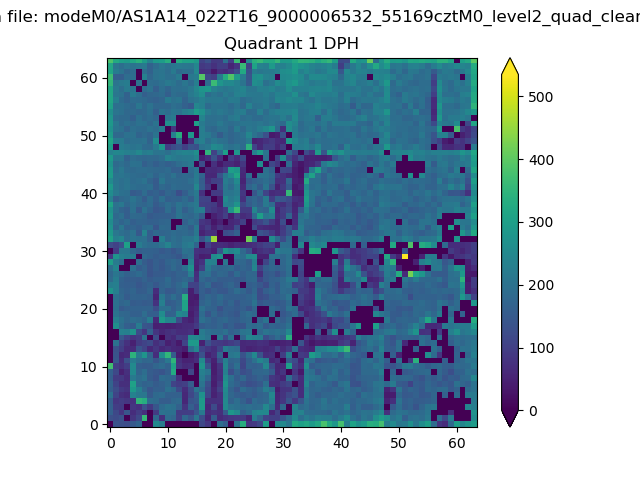 |
Quadrant B |
|---|---|---|---|
| Quadrant D | 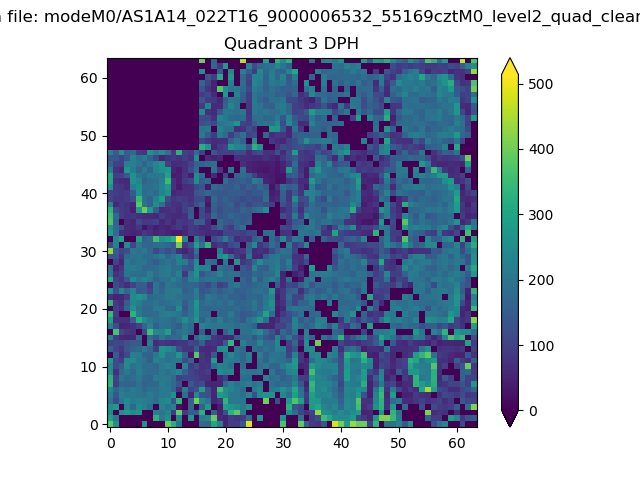 |
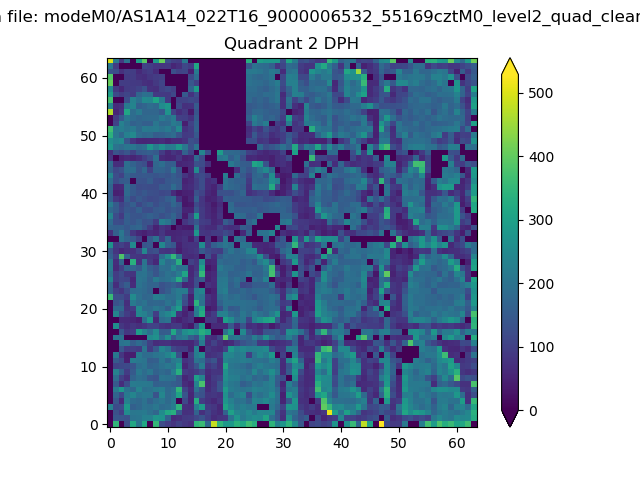 |
Quadrant C |
| Plot type | Count rate plots | Images |
|---|---|---|
| Comparison with Poisson distribution Blue bars denote a histogram of data divided into 1 sec bins. Red curve is a Poisson curve with rate = median count rate of data. |
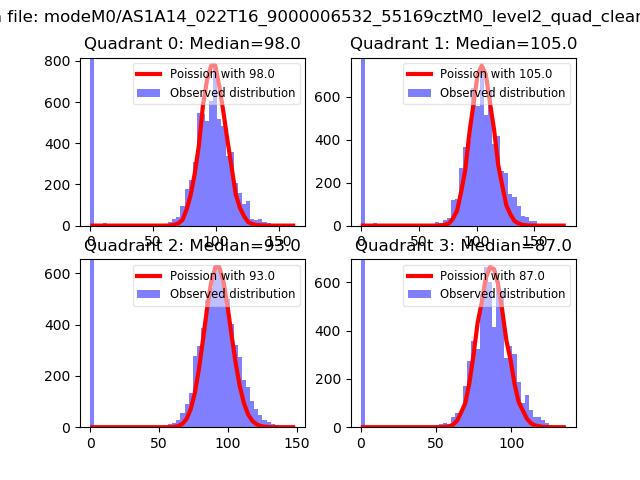 |
 |
| Quadrant-wise count rates Data is divided into 100 sec bins |
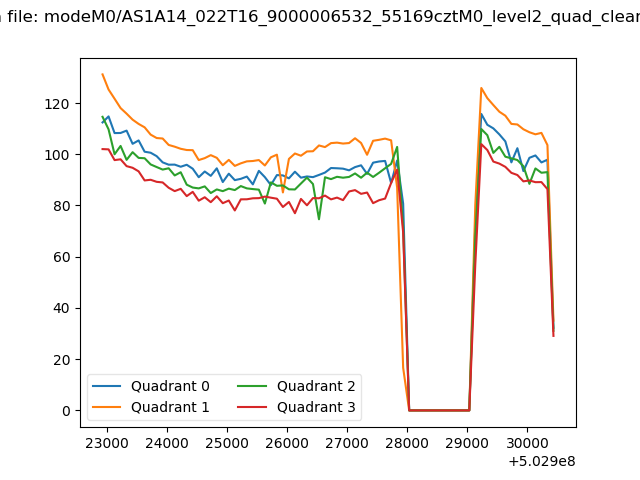 |
|
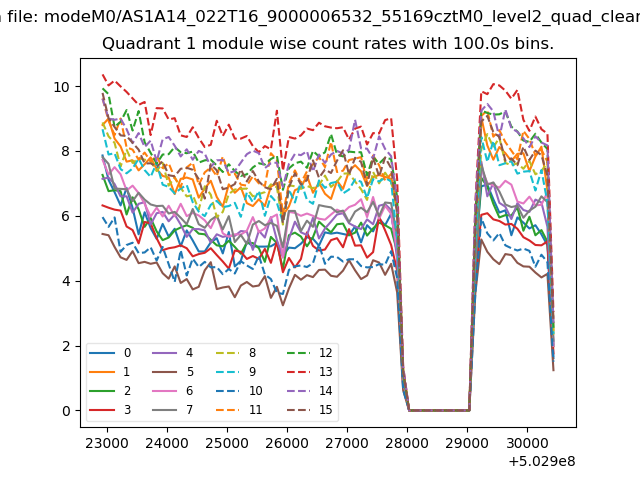
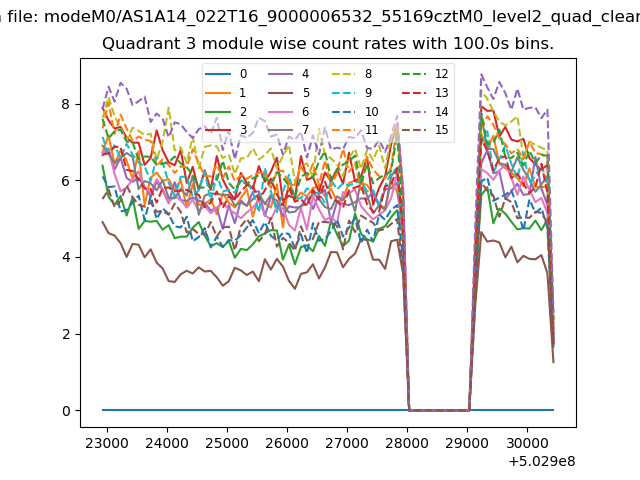
| Module-wise count rates for Quadrant A Data is divided into 100 sec bins |
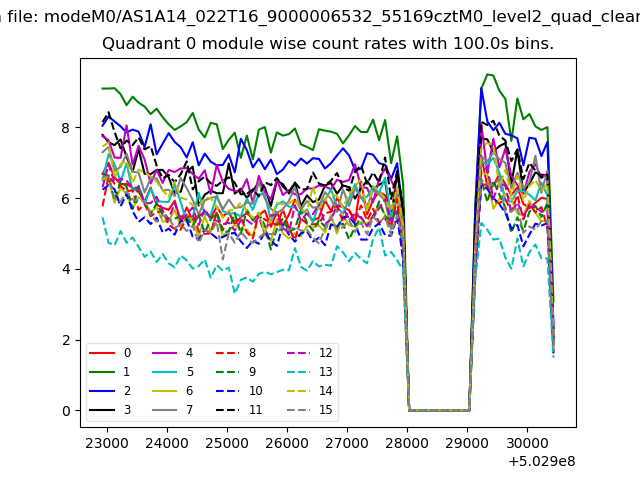 |
 |
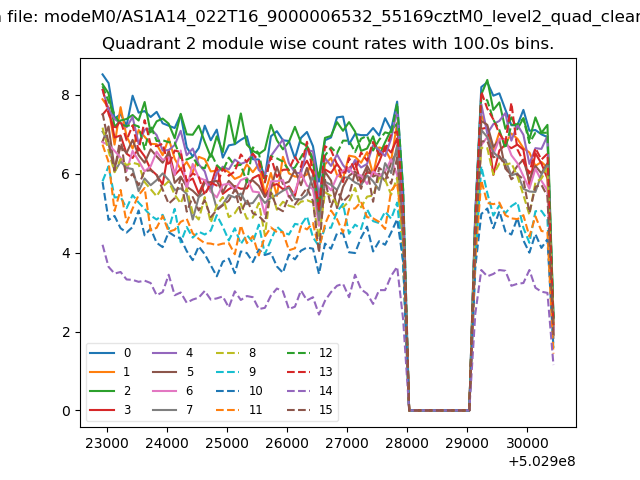
| Module-wise count rates for Quadrant B Data is divided into 100 sec bins |
 |
 |
| Module-wise count rates for Quadrant C Data is divided into 100 sec bins |
 |
 |
| Module-wise count rates for Quadrant D Data is divided into 100 sec bins |
 |
 |
| Parameter | Plot |
|---|---|
| CZT HV Monitor | 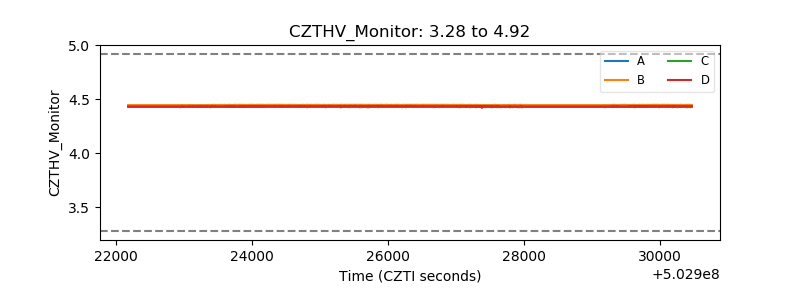 |
| D_VDD | 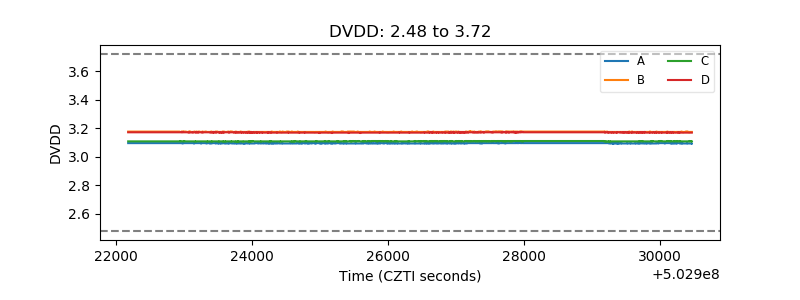 |
| Temperature 1 | 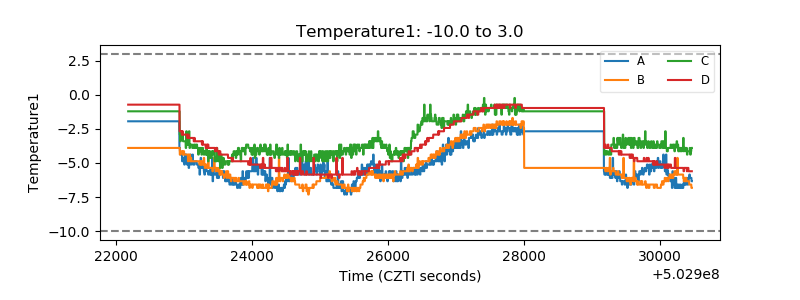 |
| Veto HV Monitor | 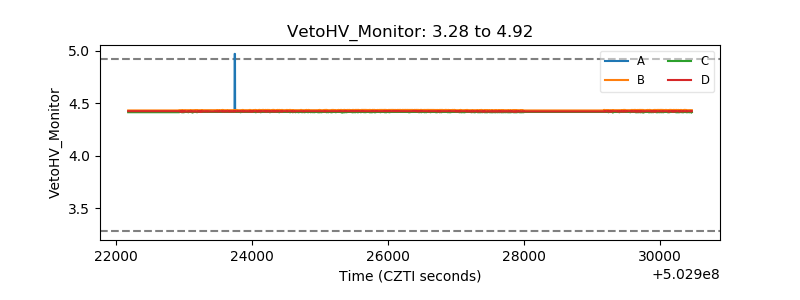 |
| Veto LLD | 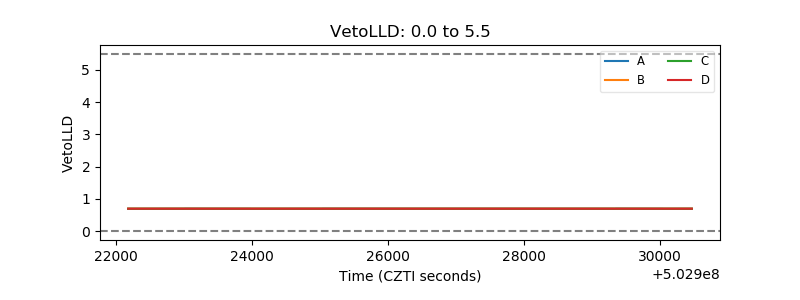 |
| Alpha Counter | 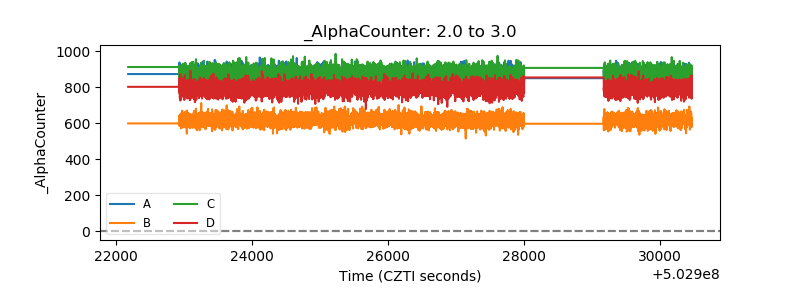 |
| _CPM_Rate | 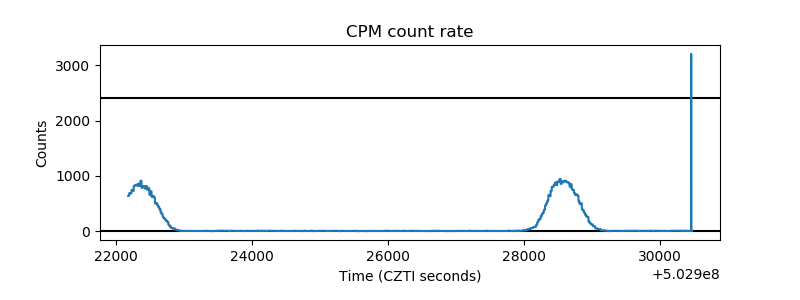 |
| CZT Counter | 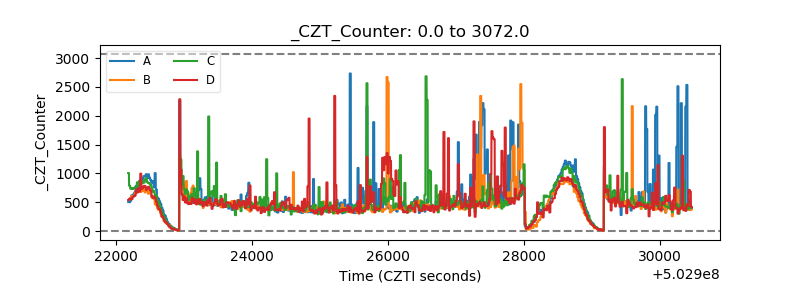 |
| +2.5 Volts monitor |  |
| +5 Volts monitor |  |
| _ROLL_ROT | 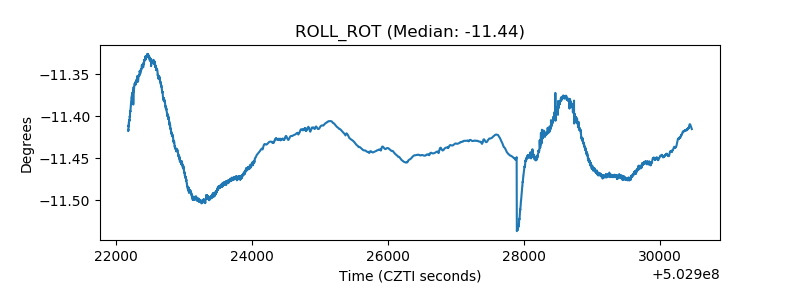 |
| _Roll_DEC | 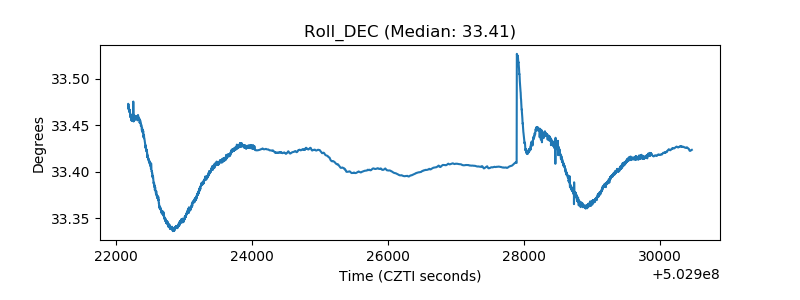 |
| _Roll_RA | 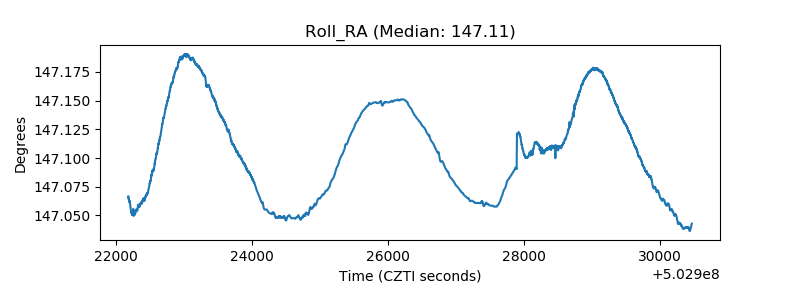 |
| Veto Counter | 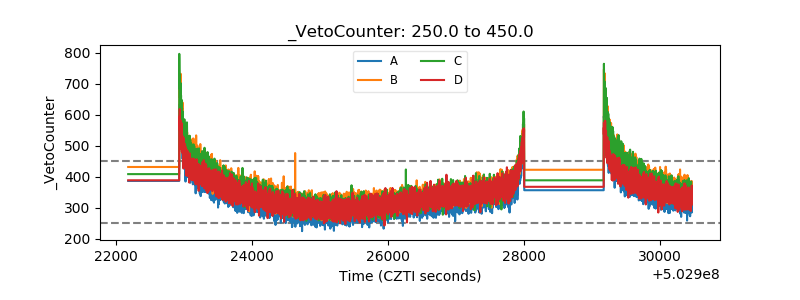 |