| Param | Original file | Final file |
|---|---|---|
| Filename | modeM0/AS1A14_022T16_9000006532_55170cztM0_level2.fits | modeM0/AS1A14_022T16_9000006532_55170cztM0_level2_quad_clean.evt |
| Size (bytes) | 512,976,960 | 113,051,520 |
| Size | 489.2 MB | 107.8 MB |
| Events in quadrant A | 5,748,262 | 725,620 |
| Events in quadrant B | 3,878,441 | 798,103 |
| Events in quadrant C | 4,555,136 | 704,865 |
| Events in quadrant D | 4,214,665 | 663,950 |
| Mode SS | |||
|---|---|---|---|
| Quadrant | BADHDUFLAG | Total packets | Discarded packets |
| A | 0 | 158 | 0 |
| B | 0 | 158 | 0 |
| C | 0 | 158 | 0 |
| D | 0 | 158 | 0 |
| Mode M0 | |||
|---|---|---|---|
| Quadrant | BADHDUFLAG | Total packets | Discarded packets |
| A | 0 | 22501 | 2 |
| B | 0 | 17381 | 2 |
| C | 0 | 18862 | 2 |
| D | 0 | 18060 | 2 |
| Mode M9 | |||
|---|---|---|---|
| Quadrant | BADHDUFLAG | Total packets | Discarded packets |
| A | 0 | 22 | 0 |
| B | 0 | 22 | 0 |
| C | 0 | 22 | 0 |
| D | 0 | 22 | 0 |
| Quadrant | Total seconds | Saturated seconds | Saturation percentage |
|---|---|---|---|
| A | 7624 | 393 | 5.154774% |
| B | 7625 | 225 | 2.950820% |
| C | 7625 | 204 | 2.675410% |
| D | 7625 | 127 | 1.665574% |
Noise dominated data is calculated using 1-second bins in cleaned event files. If a bin has >2000 counts, and if more than 50% of those come from <1% of pixels, then it is considered to be noise-dominated and hence unusable.
| Quadrant | # 1 sec bins | Bins with >0 counts | Bins with >2000 counts | High rate bins dominated by noise | Noise dominated (total time) | Noise dominated (detector-on time) | Marked lightcurve |
|---|---|---|---|---|---|---|---|
| A | 9944 | 7626 | 381 | 381 | 3.83% | 5.00% | 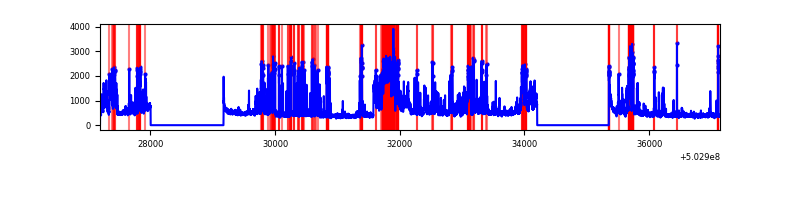 |
| B | 9945 | 7627 | 34 | 34 | 0.34% | 0.45% | 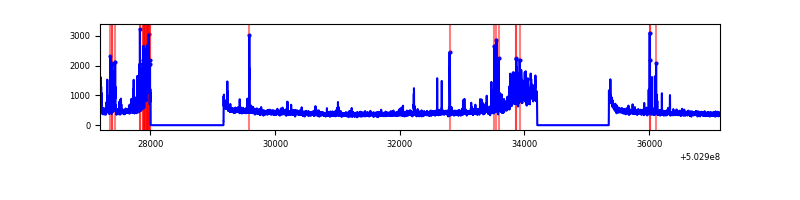 |
| C | 9945 | 7627 | 170 | 170 | 1.71% | 2.23% | 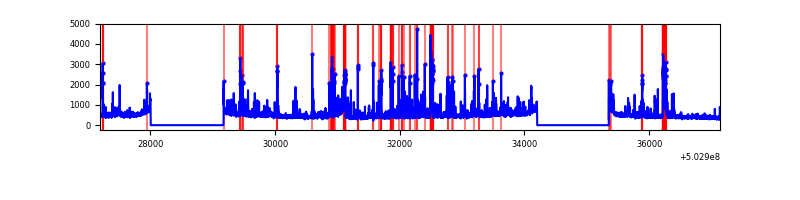 |
| D | 9945 | 7627 | 107 | 107 | 1.08% | 1.40% | 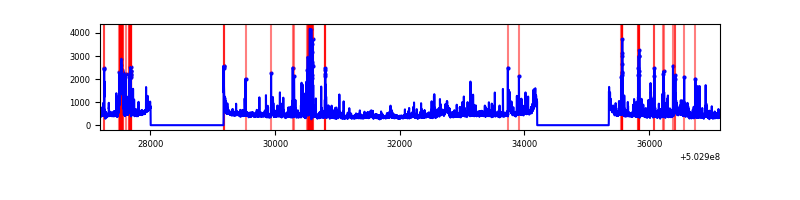 |
Top three noisy pixels from each quadrant. If the there are fewer than three noisy pixels in the level2.evt file, extra rows are filled as -1
| Pixel properties | Quadrant properties | ||||||
|---|---|---|---|---|---|---|---|
| Quadrant | DetID | PixID | Counts | Sigma | Mean | Median | Sigma |
| A | 3 | 78 | 1308653 | 6428.8 | 814 | 794 | 203.4 |
| A | 12 | 115 | 965164 | 4740.37 | 814 | 794 | 203.4 |
| A | 0 | 8 | 171968 | 841.41 | 814 | 794 | 203.4 |
| B | 4 | 81 | 288446 | 1634.58 | 815 | 786 | 176.0 |
| B | 2 | 249 | 223966 | 1268.18 | 815 | 786 | 176.0 |
| B | 0 | 182 | 66507 | 373.45 | 815 | 786 | 176.0 |
| C | 10 | 22 | 565369 | 2583.3 | 798 | 791 | 218.5 |
| C | 1 | 16 | 248499 | 1133.42 | 798 | 791 | 218.5 |
| C | 13 | 3 | 201678 | 919.18 | 798 | 791 | 218.5 |
| D | 11 | 129 | 747855 | 3321.51 | 792 | 758 | 224.9 |
| D | 11 | 176 | 149580 | 661.64 | 792 | 758 | 224.9 |
| D | 7 | 129 | 77315 | 340.36 | 792 | 758 | 224.9 |
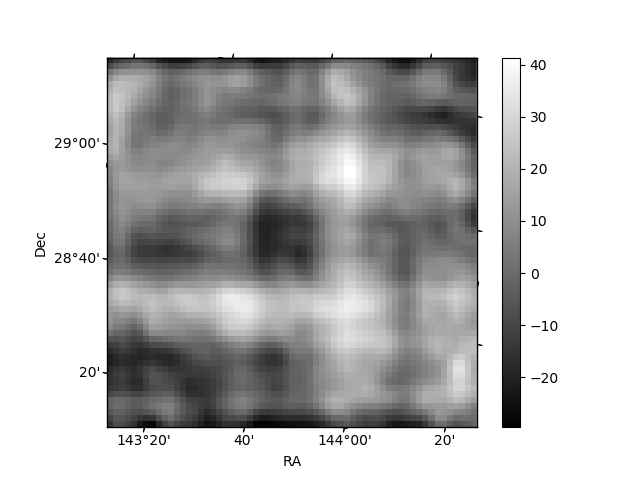
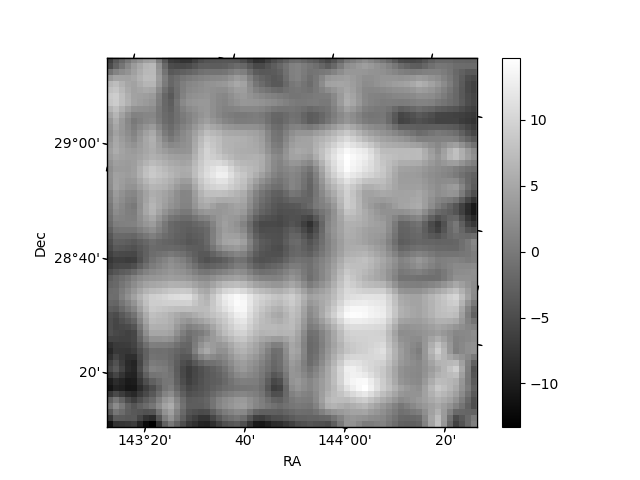
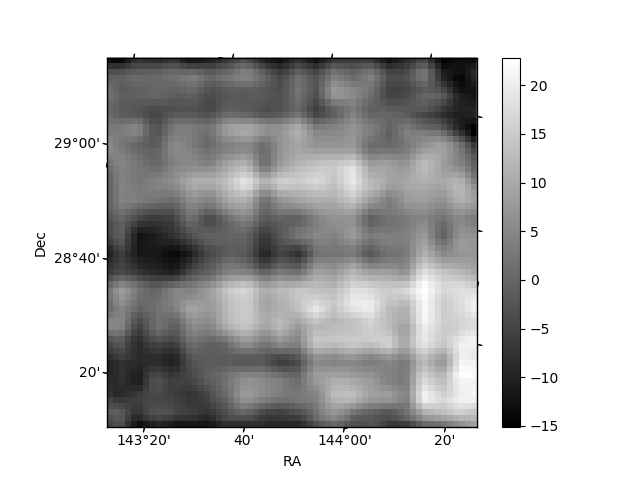
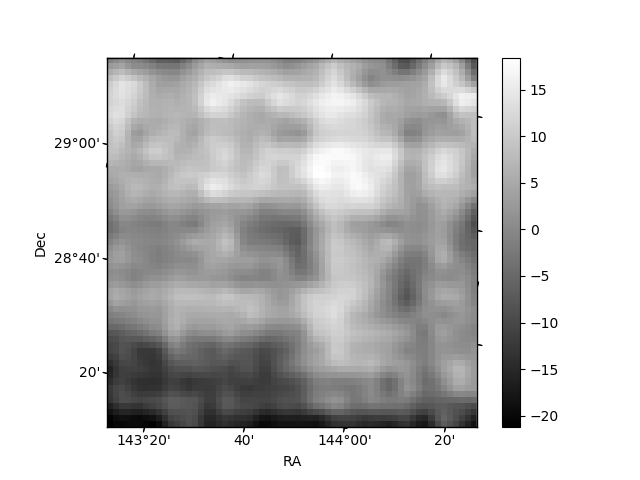
Histogram calculated using DETX and DETY for each event in the final _common_clean file
| Quadrant A | 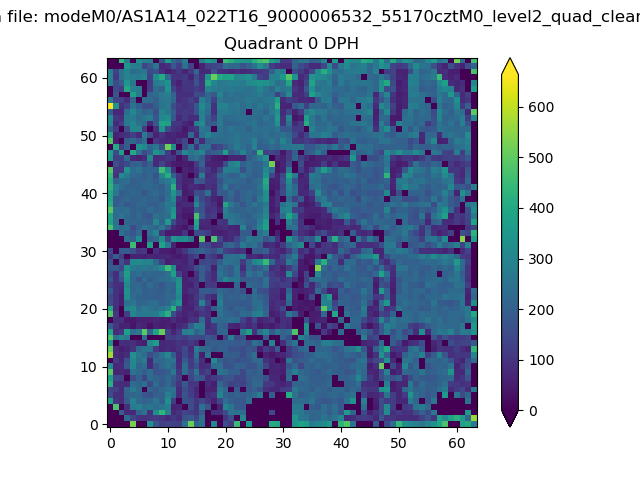 |
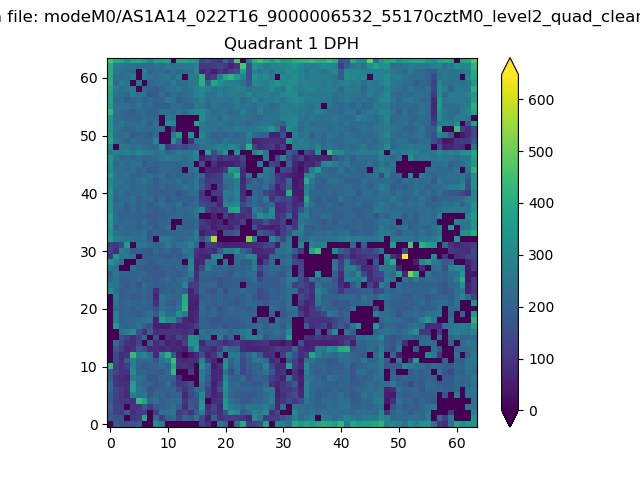 |
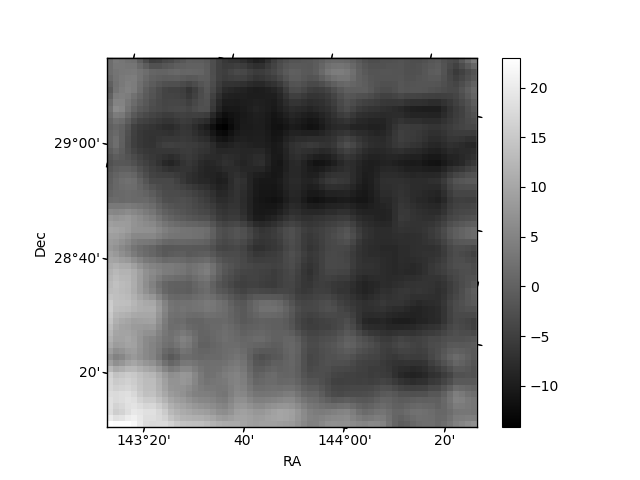
Quadrant B |
|---|---|---|---|
| Quadrant D | 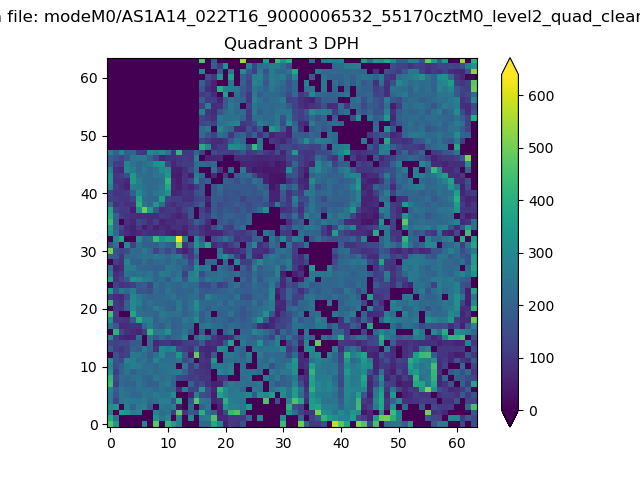 |
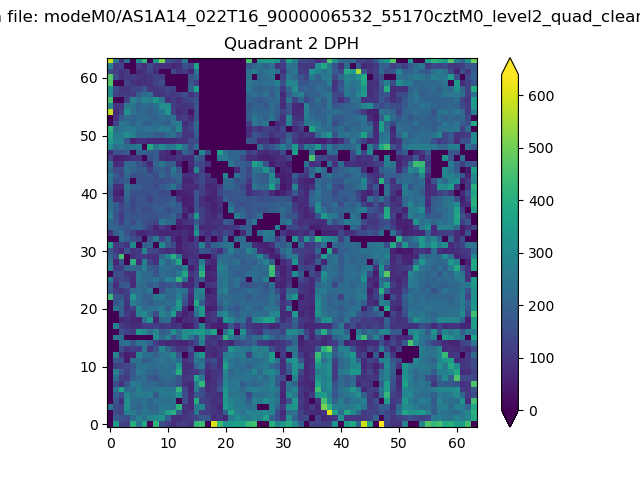 |
Quadrant C |
| Plot type | Count rate plots | Images |
|---|---|---|
| Comparison with Poisson distribution Blue bars denote a histogram of data divided into 1 sec bins. Red curve is a Poisson curve with rate = median count rate of data. |
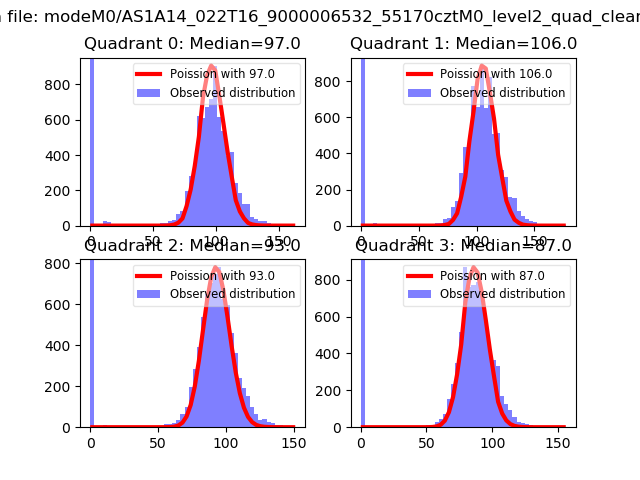 |
 |
| Quadrant-wise count rates Data is divided into 100 sec bins |
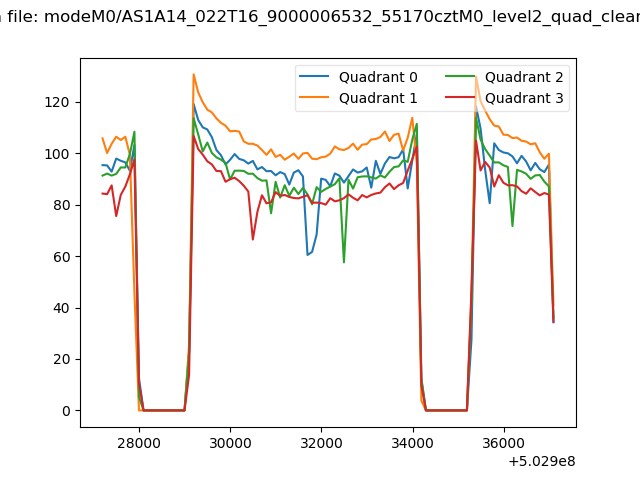 |
|
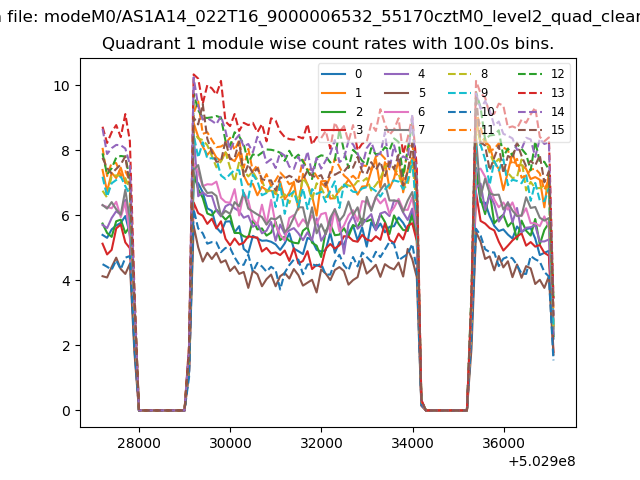
| Module-wise count rates for Quadrant A Data is divided into 100 sec bins |
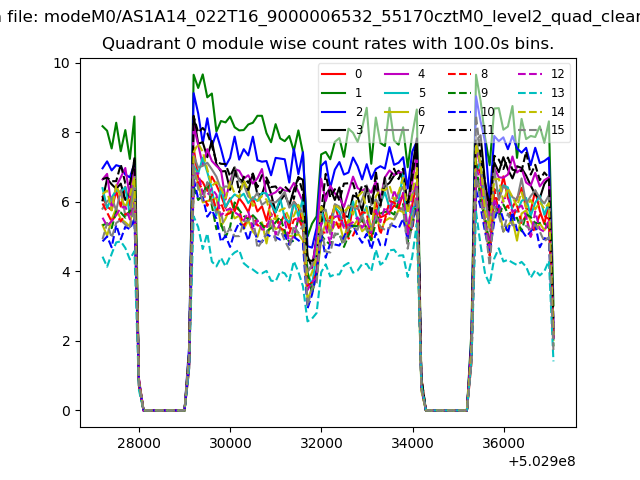 |
 |
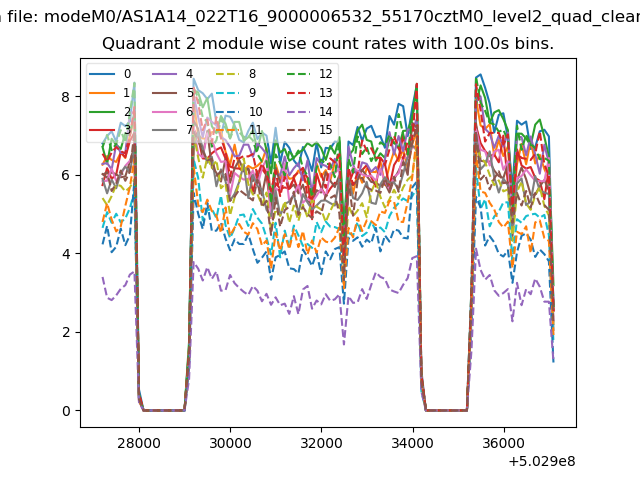
| Module-wise count rates for Quadrant B Data is divided into 100 sec bins |
 |
 |
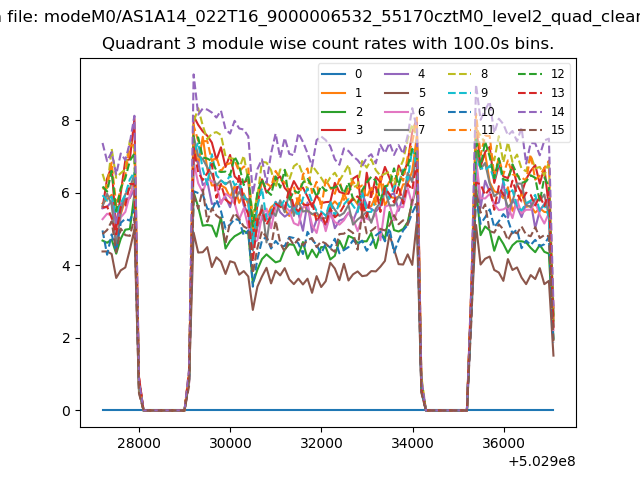
| Module-wise count rates for Quadrant C Data is divided into 100 sec bins |
 |
 |
| Module-wise count rates for Quadrant D Data is divided into 100 sec bins |
 |
 |
| Parameter | Plot |
|---|---|
| CZT HV Monitor | 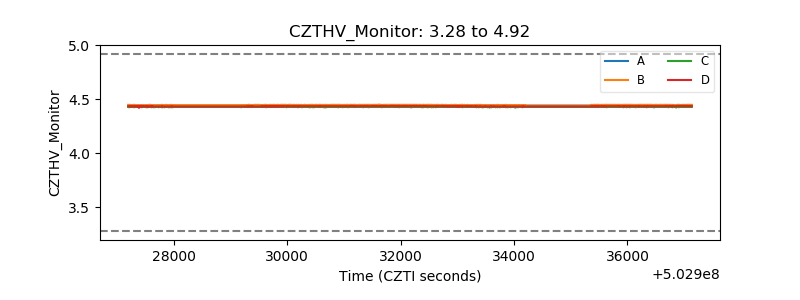 |
| D_VDD | 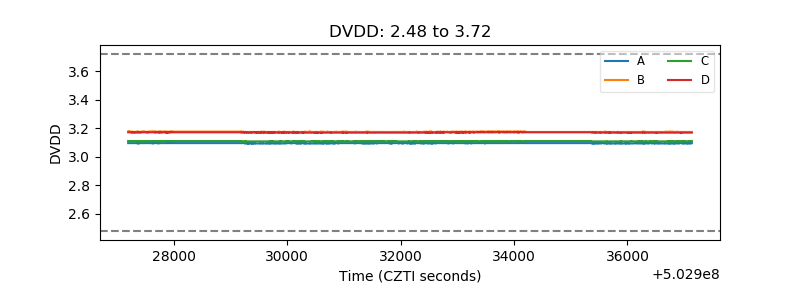 |
| Temperature 1 | 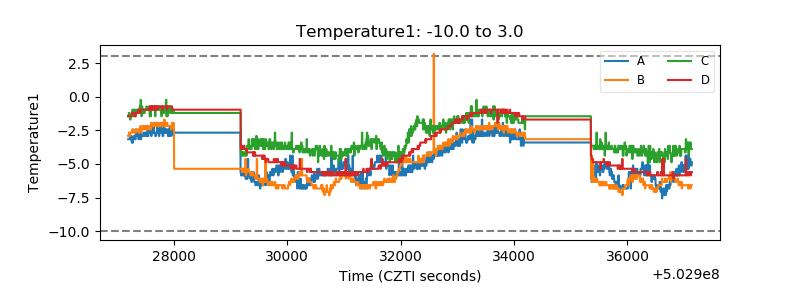 |
| Veto HV Monitor | 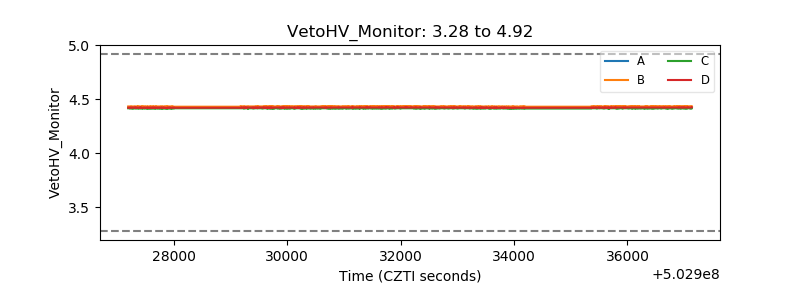 |
| Veto LLD | 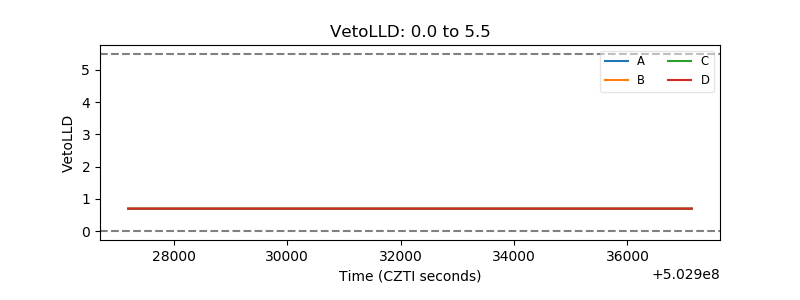 |
| Alpha Counter | 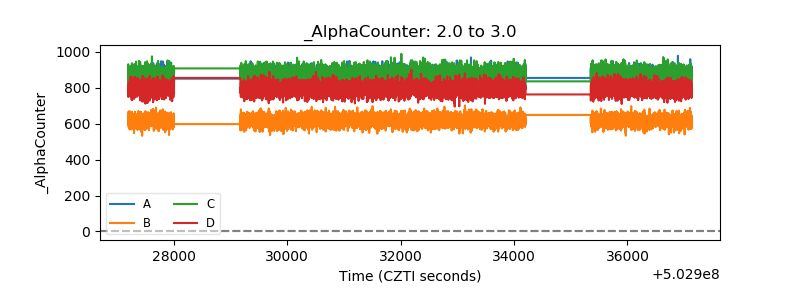 |
| _CPM_Rate | 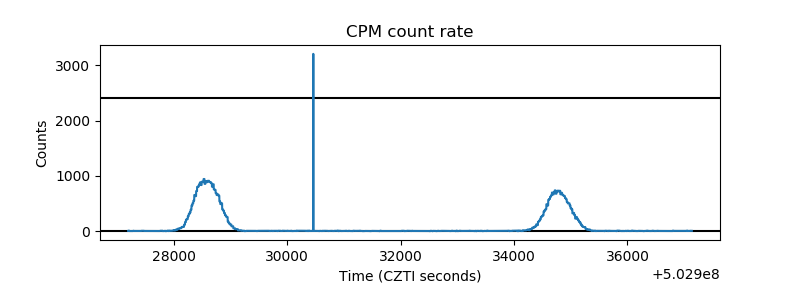 |
| CZT Counter | 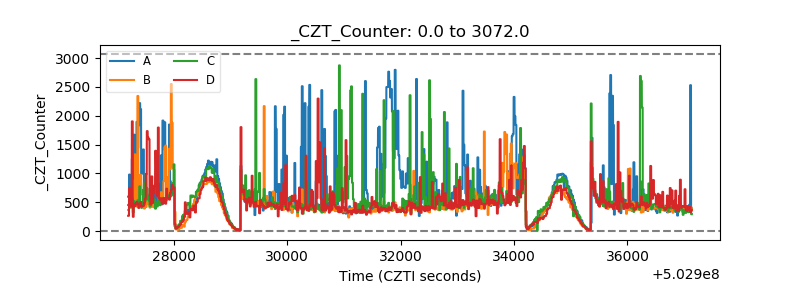 |
| +2.5 Volts monitor |  |
| +5 Volts monitor |  |
| _ROLL_ROT | 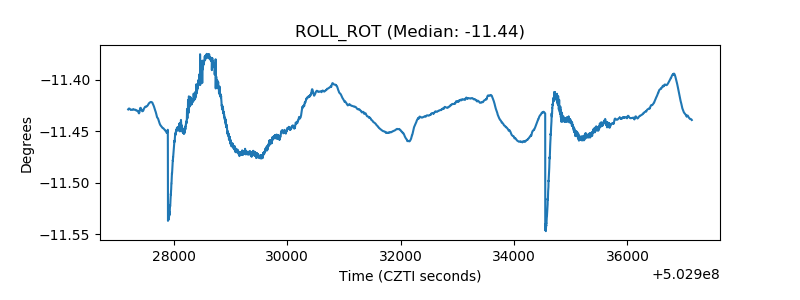 |
| _Roll_DEC | 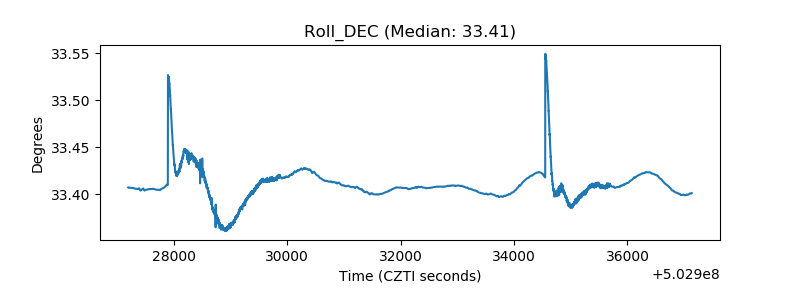 |
| _Roll_RA | 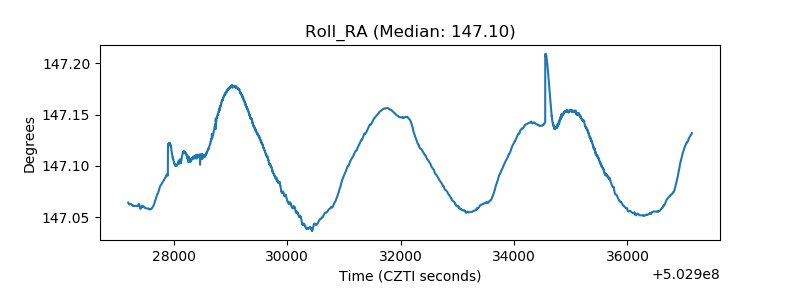 |
| Veto Counter | 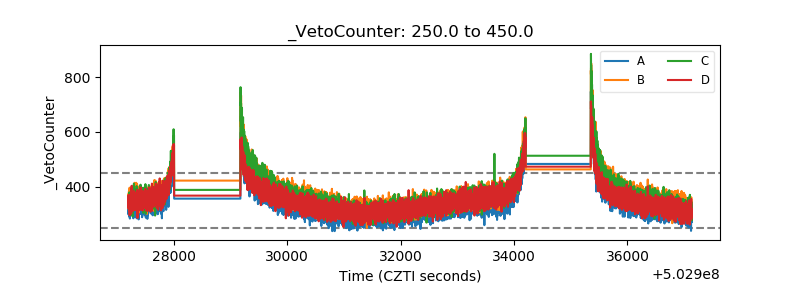 |