| Param | Original file | Final file |
|---|---|---|
| Filename | modeM0/AS1A14_022T16_9000006532_55171cztM0_level2.fits | modeM0/AS1A14_022T16_9000006532_55171cztM0_level2_quad_clean.evt |
| Size (bytes) | 434,255,040 | 102,968,640 |
| Size | 414.1 MB | 98.2 MB |
| Events in quadrant A | 4,153,511 | 668,503 |
| Events in quadrant B | 3,359,464 | 726,566 |
| Events in quadrant C | 3,914,653 | 642,058 |
| Events in quadrant D | 4,102,809 | 593,498 |
| Mode SS | |||
|---|---|---|---|
| Quadrant | BADHDUFLAG | Total packets | Discarded packets |
| A | 0 | 144 | 0 |
| B | 0 | 144 | 0 |
| C | 0 | 144 | 0 |
| D | 0 | 144 | 0 |
| Mode M0 | |||
|---|---|---|---|
| Quadrant | BADHDUFLAG | Total packets | Discarded packets |
| A | 0 | 17539 | 2 |
| B | 0 | 15343 | 2 |
| C | 0 | 16781 | 2 |
| D | 0 | 17388 | 2 |
| Mode M9 | |||
|---|---|---|---|
| Quadrant | BADHDUFLAG | Total packets | Discarded packets |
| A | 0 | 23 | 0 |
| B | 0 | 23 | 0 |
| C | 0 | 23 | 0 |
| D | 0 | 23 | 0 |
| Quadrant | Total seconds | Saturated seconds | Saturation percentage |
|---|---|---|---|
| A | 6997 | 224 | 3.201372% |
| B | 6997 | 184 | 2.629698% |
| C | 6997 | 174 | 2.486780% |
| D | 6997 | 211 | 3.015578% |
Noise dominated data is calculated using 1-second bins in cleaned event files. If a bin has >2000 counts, and if more than 50% of those come from <1% of pixels, then it is considered to be noise-dominated and hence unusable.
| Quadrant | # 1 sec bins | Bins with >0 counts | Bins with >2000 counts | High rate bins dominated by noise | Noise dominated (total time) | Noise dominated (detector-on time) | Marked lightcurve |
|---|---|---|---|---|---|---|---|
| A | 9272 | 6999 | 144 | 144 | 1.55% | 2.06% | 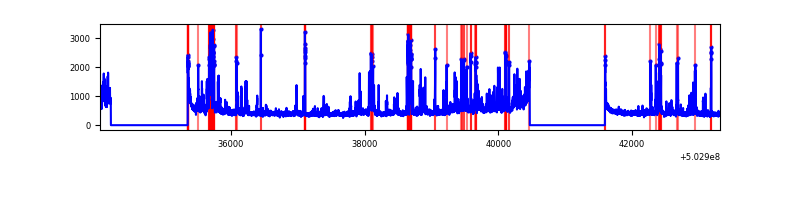 |
| B | 9272 | 6999 | 49 | 49 | 0.53% | 0.70% | 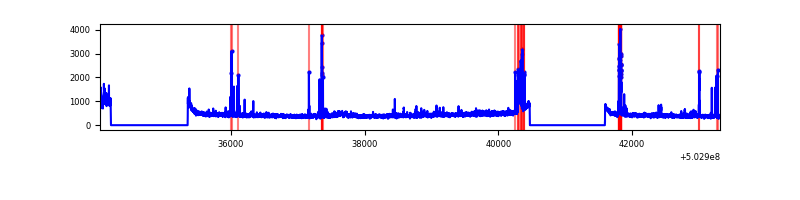 |
| C | 9272 | 6999 | 121 | 121 | 1.31% | 1.73% | 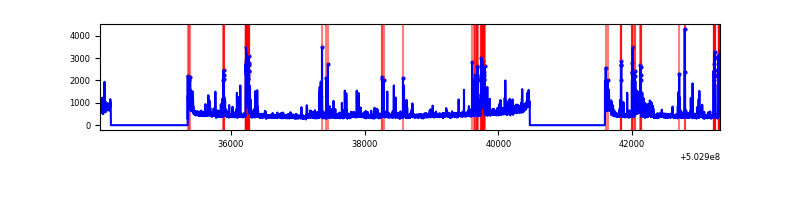 |
| D | 9272 | 6999 | 191 | 191 | 2.06% | 2.73% | 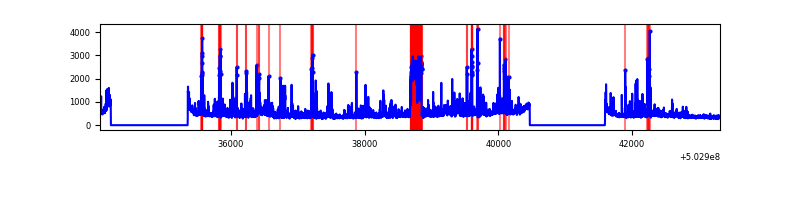 |
Top three noisy pixels from each quadrant. If the there are fewer than three noisy pixels in the level2.evt file, extra rows are filled as -1
| Pixel properties | Quadrant properties | ||||||
|---|---|---|---|---|---|---|---|
| Quadrant | DetID | PixID | Counts | Sigma | Mean | Median | Sigma |
| A | 3 | 78 | 1120258 | 6014.82 | 743 | 722 | 186.1 |
| A | 3 | 45 | 39177 | 206.6 | 743 | 722 | 186.1 |
| A | 0 | 8 | 38782 | 204.48 | 743 | 722 | 186.1 |
| B | 5 | 185 | 163002 | 1005.84 | 743 | 713 | 161.3 |
| B | 2 | 249 | 120899 | 744.89 | 743 | 713 | 161.3 |
| B | 4 | 81 | 73619 | 451.86 | 743 | 713 | 161.3 |
| C | 6 | 223 | 244328 | 1217.09 | 728 | 718 | 200.2 |
| C | 10 | 22 | 223766 | 1114.36 | 728 | 718 | 200.2 |
| C | 1 | 16 | 173804 | 864.75 | 728 | 718 | 200.2 |
| D | 11 | 129 | 1042109 | 5084.16 | 717 | 686 | 204.8 |
| D | 7 | 129 | 73629 | 356.1 | 717 | 686 | 204.8 |
| D | 5 | 173 | 48240 | 232.16 | 717 | 686 | 204.8 |
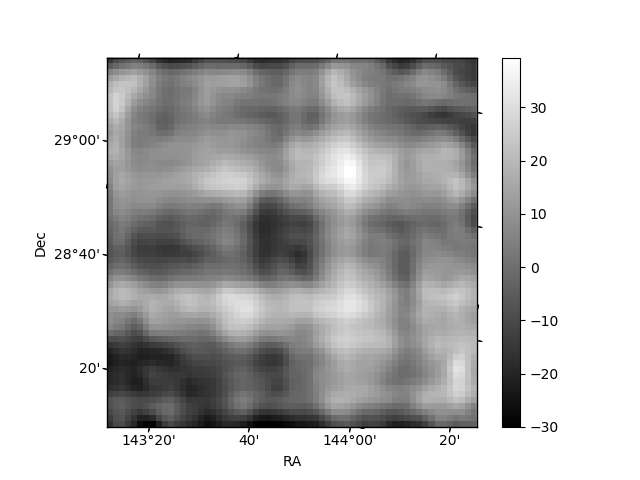
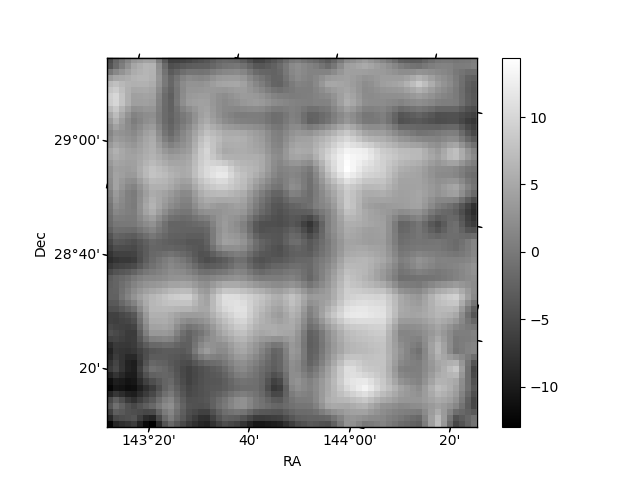
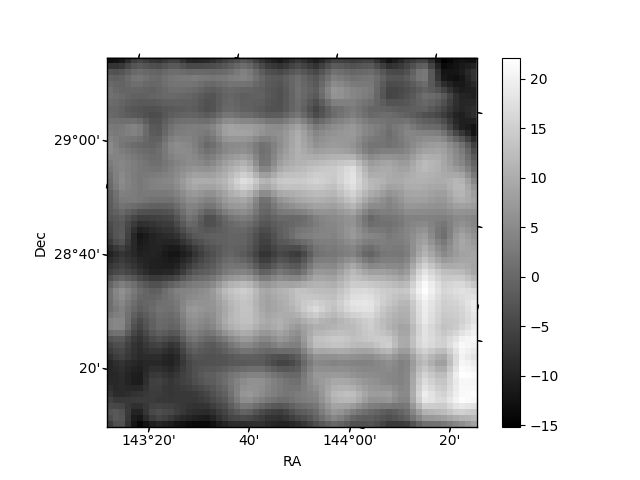
Histogram calculated using DETX and DETY for each event in the final _common_clean file
| Quadrant A | 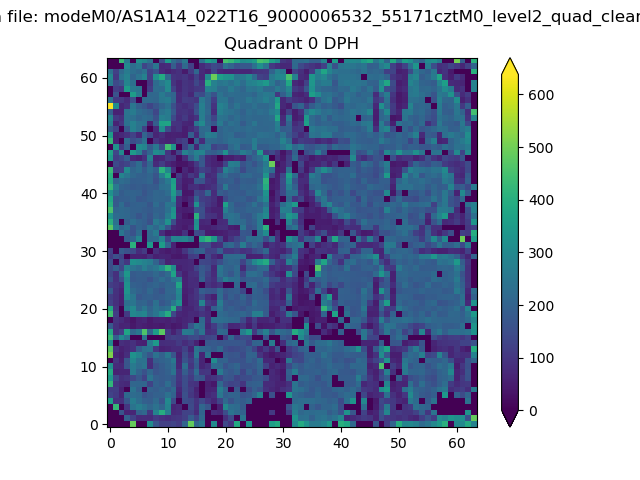 |
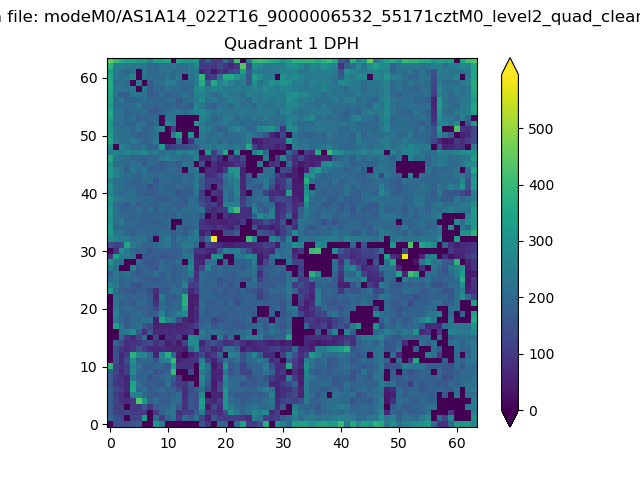 |
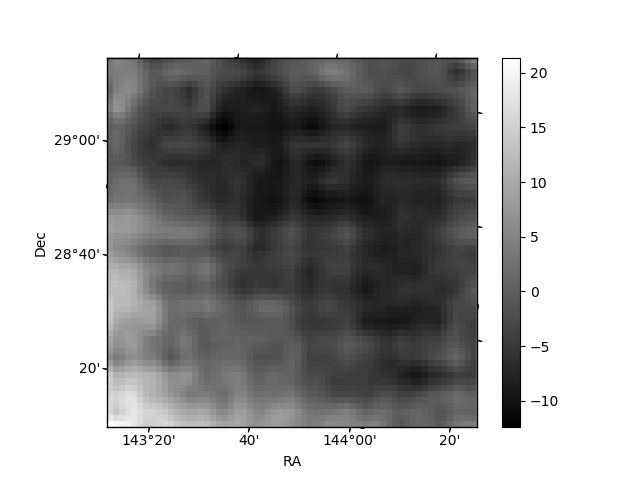
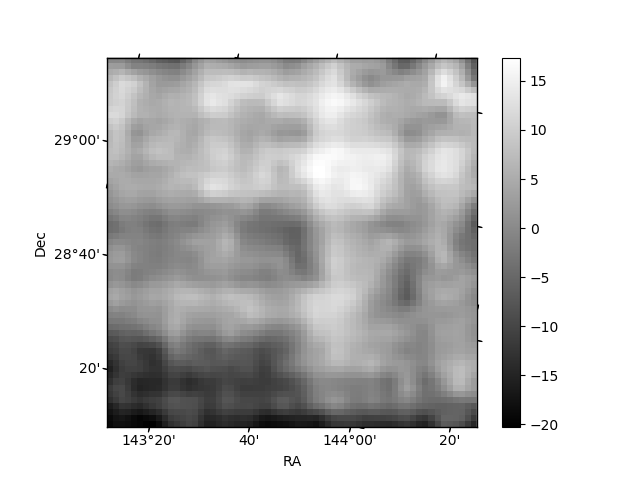
Quadrant B |
|---|---|---|---|
| Quadrant D | 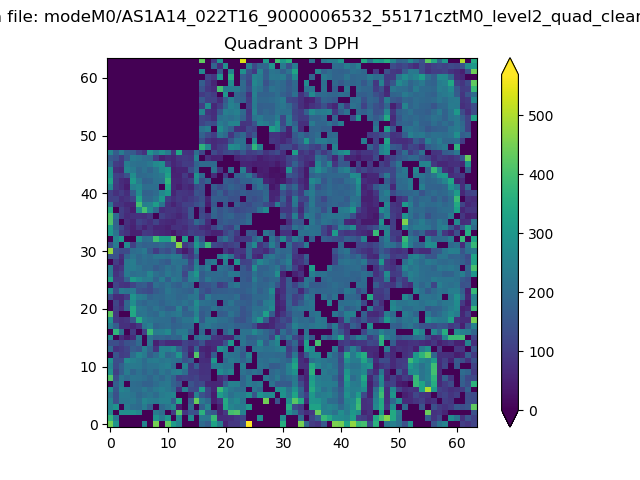 |
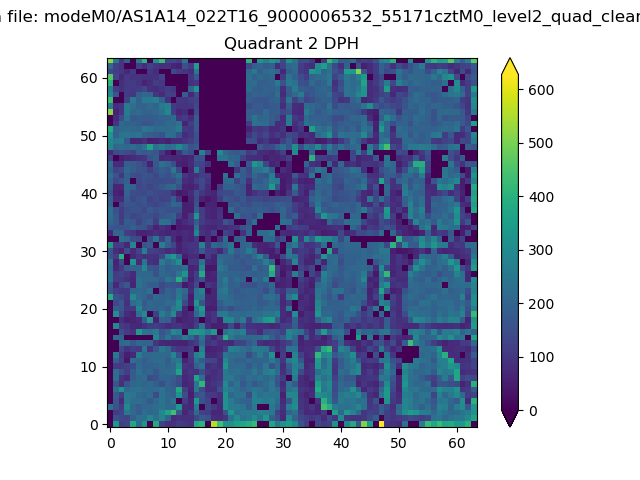 |
Quadrant C |
| Plot type | Count rate plots | Images |
|---|---|---|
| Comparison with Poisson distribution Blue bars denote a histogram of data divided into 1 sec bins. Red curve is a Poisson curve with rate = median count rate of data. |
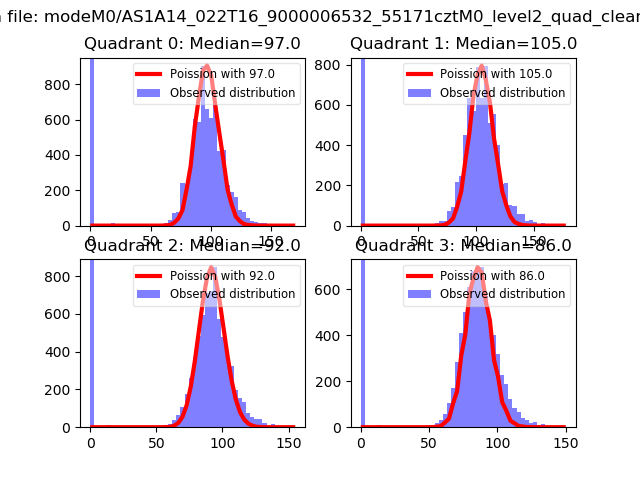 |
 |
| Quadrant-wise count rates Data is divided into 100 sec bins |
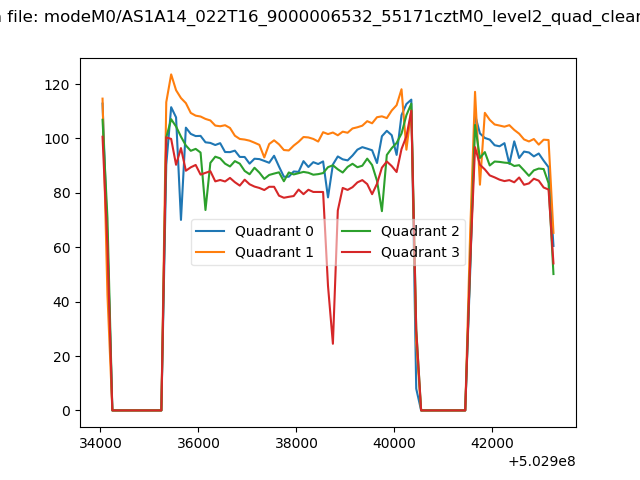 |
|
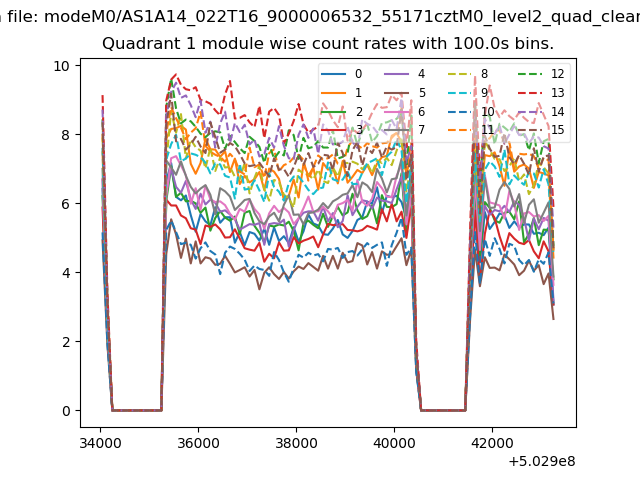
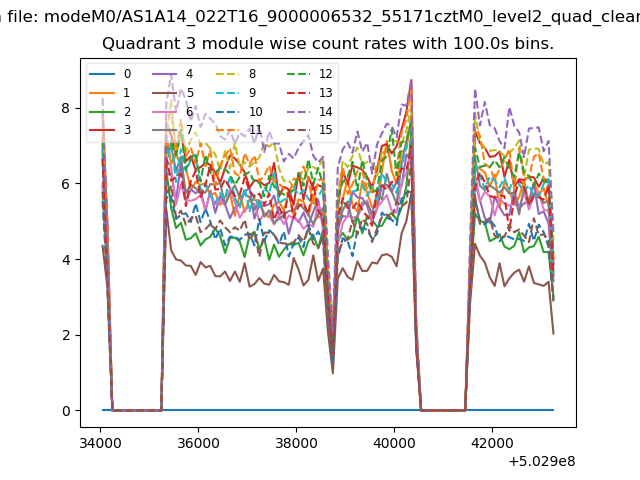
| Module-wise count rates for Quadrant A Data is divided into 100 sec bins |
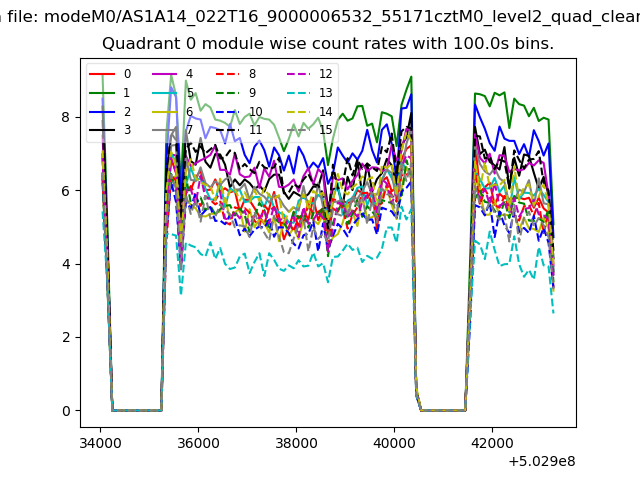 |
 |
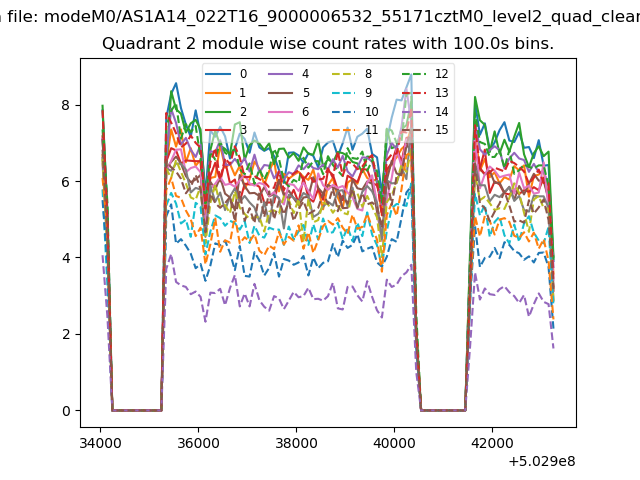
| Module-wise count rates for Quadrant B Data is divided into 100 sec bins |
 |
 |
| Module-wise count rates for Quadrant C Data is divided into 100 sec bins |
 |
 |
| Module-wise count rates for Quadrant D Data is divided into 100 sec bins |
 |
 |
| Parameter | Plot |
|---|---|
| CZT HV Monitor | 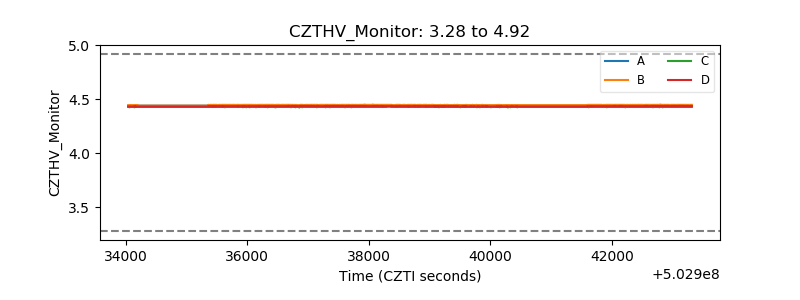 |
| D_VDD | 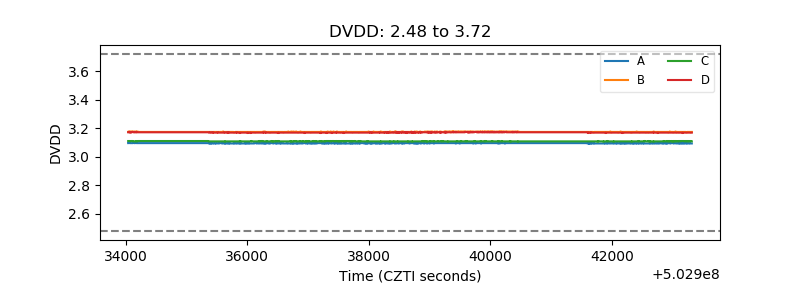 |
| Temperature 1 | 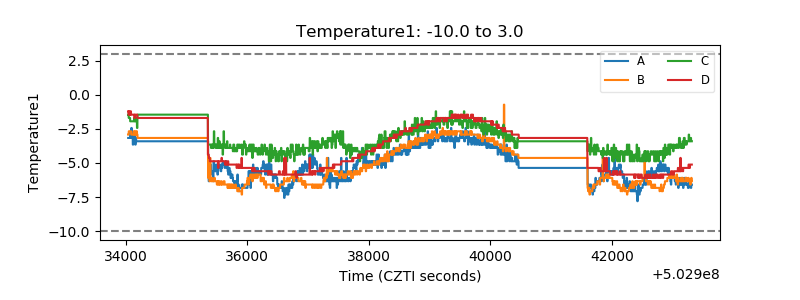 |
| Veto HV Monitor | 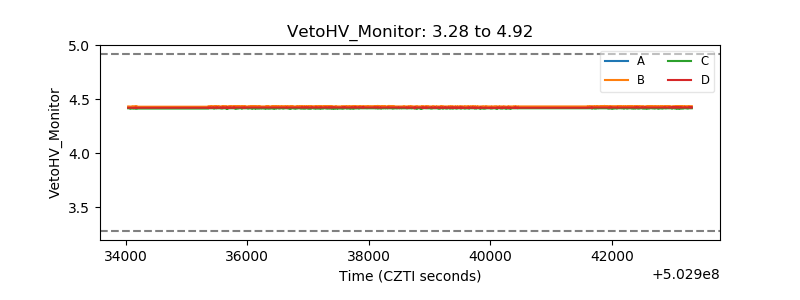 |
| Veto LLD | 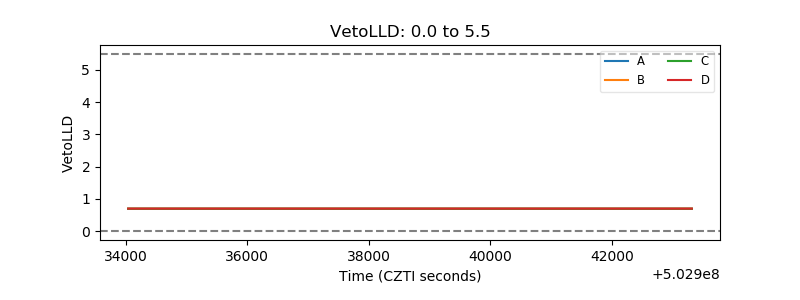 |
| Alpha Counter | 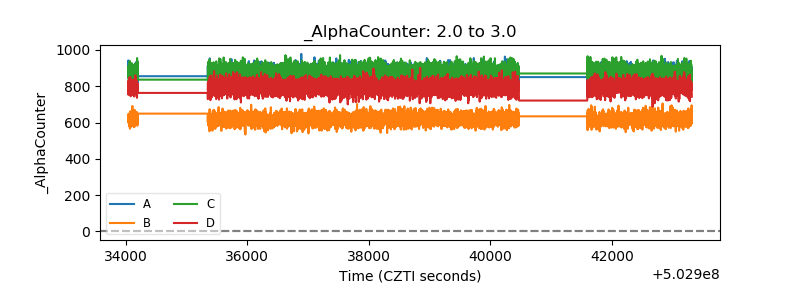 |
| _CPM_Rate | 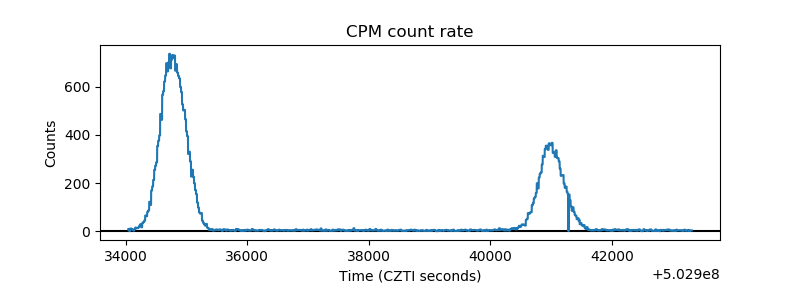 |
| CZT Counter | 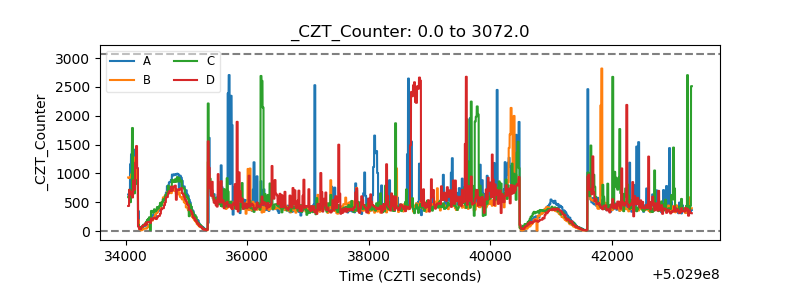 |
| +2.5 Volts monitor |  |
| +5 Volts monitor | 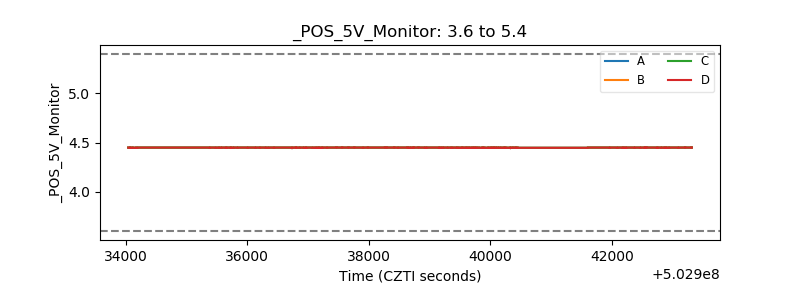 |
| _ROLL_ROT | 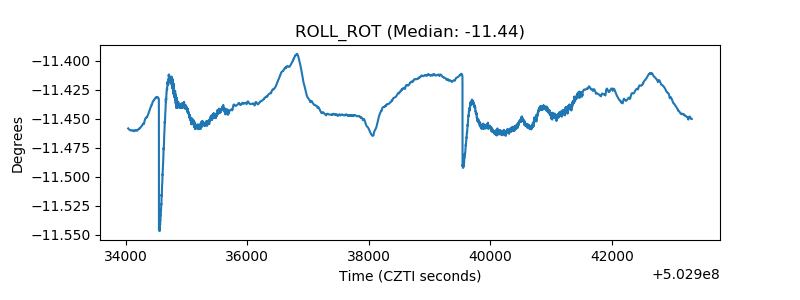 |
| _Roll_DEC | 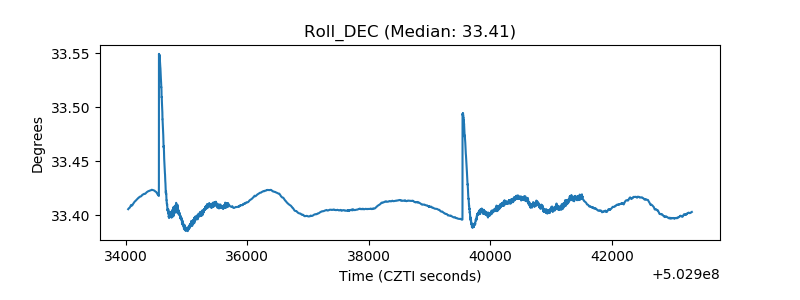 |
| _Roll_RA | 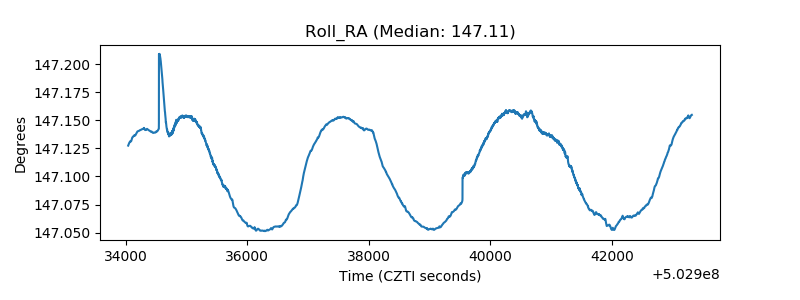 |
| Veto Counter | 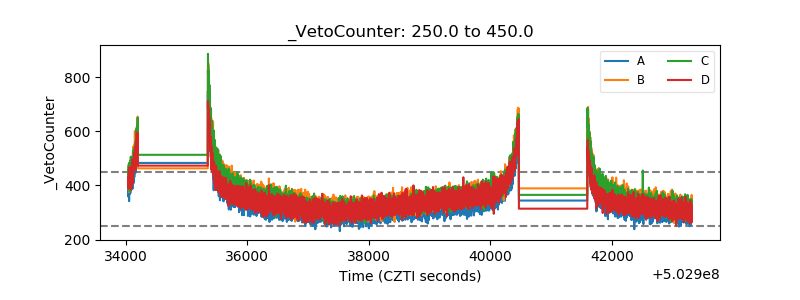 |