| Param | Original file | Final file |
|---|---|---|
| Filename | modeM0/AS1A14_022T16_9000006532_55172cztM0_level2.fits | modeM0/AS1A14_022T16_9000006532_55172cztM0_level2_quad_clean.evt |
| Size (bytes) | 152,328,960 | 39,427,200 |
| Size | 145.3 MB | 37.6 MB |
| Events in quadrant A | 1,434,770 | 251,163 |
| Events in quadrant B | 1,216,934 | 275,469 |
| Events in quadrant C | 1,518,950 | 241,045 |
| Events in quadrant D | 1,249,140 | 226,678 |
| Mode SS | |||
|---|---|---|---|
| Quadrant | BADHDUFLAG | Total packets | Discarded packets |
| A | 0 | 87 | 23 |
| B | 0 | 84 | 23 |
| C | 0 | 86 | 26 |
| D | 0 | 84 | 17 |
| Mode M0 | |||
|---|---|---|---|
| Quadrant | BADHDUFLAG | Total packets | Discarded packets |
| A | 0 | 9650 | 3258 |
| B | 0 | 8357 | 2493 |
| C | 0 | 9662 | 3065 |
| D | 0 | 9225 | 3281 |
| Mode M9 | |||
|---|---|---|---|
| Quadrant | BADHDUFLAG | Total packets | Discarded packets |
| A | 0 | 11 | 2 |
| B | 0 | 9 | 0 |
| C | 0 | 12 | 3 |
| D | 0 | 11 | 2 |
| Quadrant | Total seconds | Saturated seconds | Saturation percentage |
|---|---|---|---|
| A | 2771 | 59 | 2.129195% |
| B | 2791 | 29 | 1.039054% |
| C | 2799 | 58 | 2.072169% |
| D | 2745 | 18 | 0.655738% |
Noise dominated data is calculated using 1-second bins in cleaned event files. If a bin has >2000 counts, and if more than 50% of those come from <1% of pixels, then it is considered to be noise-dominated and hence unusable.
| Quadrant | # 1 sec bins | Bins with >0 counts | Bins with >2000 counts | High rate bins dominated by noise | Noise dominated (total time) | Noise dominated (detector-on time) | Marked lightcurve |
|---|---|---|---|---|---|---|---|
| A | 7806 | 3031 | 25 | 25 | 0.32% | 0.82% | 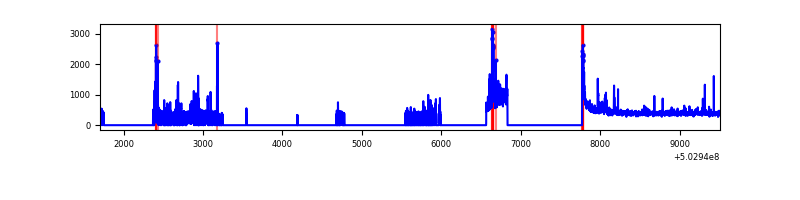 |
| B | 7802 | 3047 | 4 | 4 | 0.05% | 0.13% | 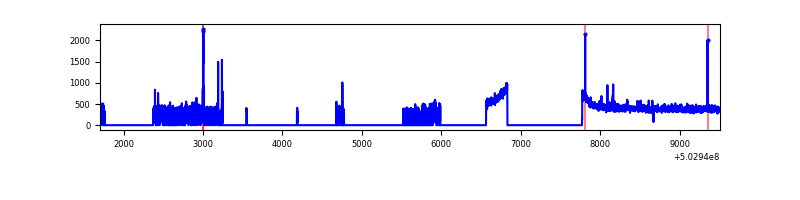 |
| C | 7804 | 3047 | 32 | 32 | 0.41% | 1.05% | 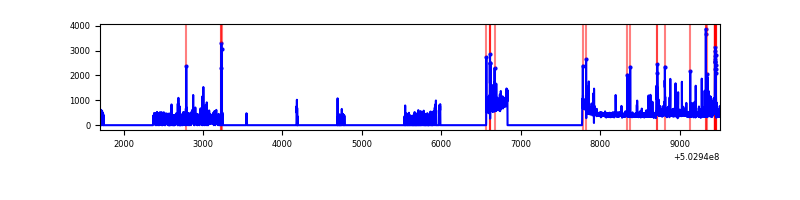 |
| D | 7805 | 3011 | 5 | 5 | 0.06% | 0.17% | 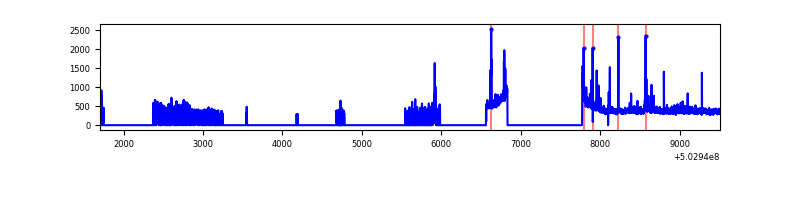 |
Top three noisy pixels from each quadrant. If the there are fewer than three noisy pixels in the level2.evt file, extra rows are filled as -1
| Pixel properties | Quadrant properties | ||||||
|---|---|---|---|---|---|---|---|
| Quadrant | DetID | PixID | Counts | Sigma | Mean | Median | Sigma |
| A | 3 | 78 | 249333 | 3353.95 | 292 | 285 | 74.3 |
| A | 3 | 45 | 17705 | 234.6 | 292 | 285 | 74.3 |
| A | 4 | 3 | 14005 | 184.77 | 292 | 285 | 74.3 |
| B | 5 | 185 | 26622 | 403.89 | 297 | 287 | 65.2 |
| B | 12 | 111 | 7973 | 117.88 | 297 | 287 | 65.2 |
| B | 14 | 111 | 7534 | 111.15 | 297 | 287 | 65.2 |
| C | 13 | 3 | 82180 | 1018.54 | 286 | 283 | 80.4 |
| C | 6 | 223 | 70186 | 869.37 | 286 | 283 | 80.4 |
| C | 1 | 16 | 65187 | 807.2 | 286 | 283 | 80.4 |
| D | 11 | 129 | 87102 | 1074.9 | 279 | 266 | 80.8 |
| D | 2 | 249 | 23284 | 284.93 | 279 | 266 | 80.8 |
| D | 5 | 173 | 17385 | 211.91 | 279 | 266 | 80.8 |
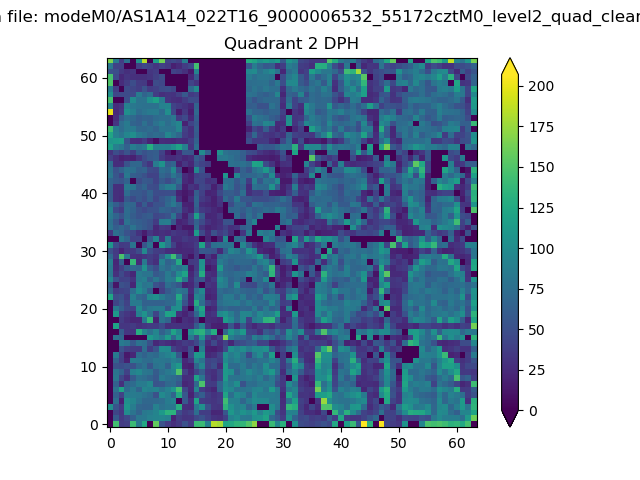
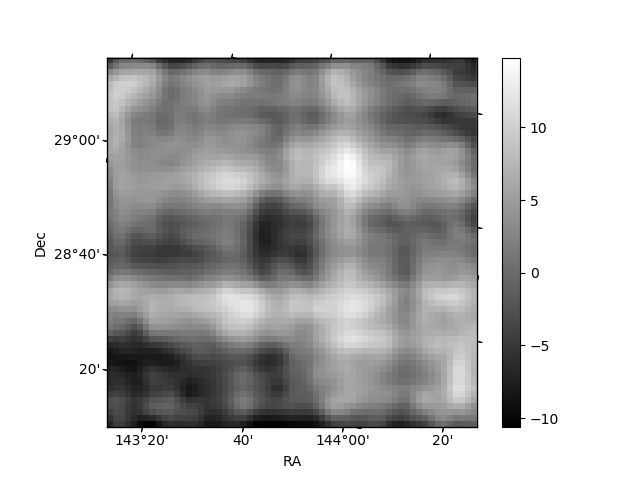
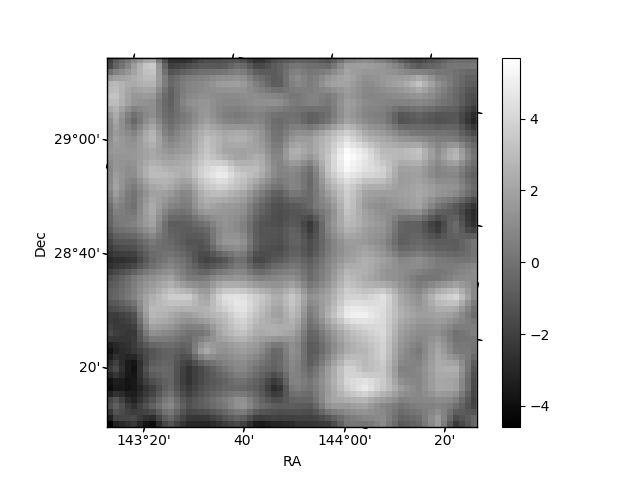
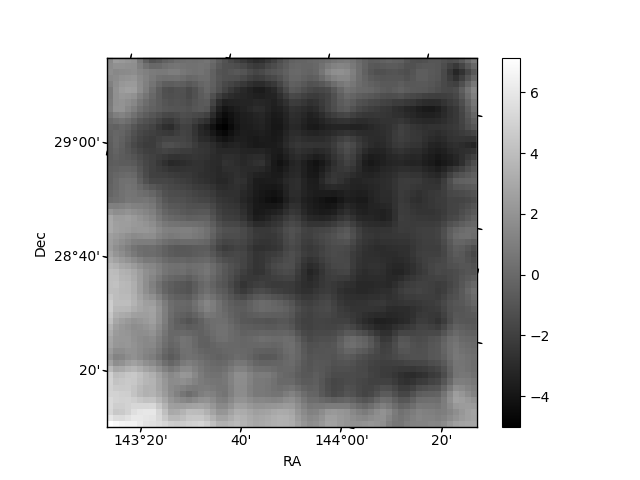
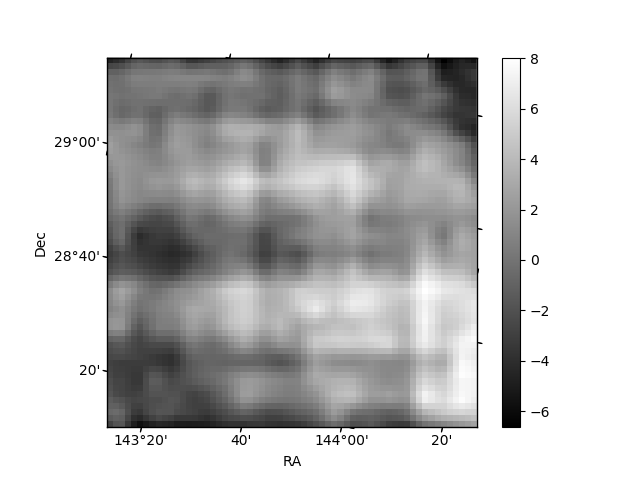
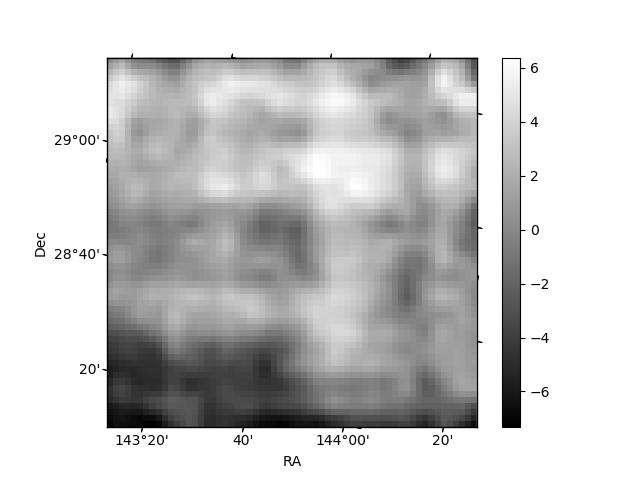
Histogram calculated using DETX and DETY for each event in the final _common_clean file
| Quadrant A | 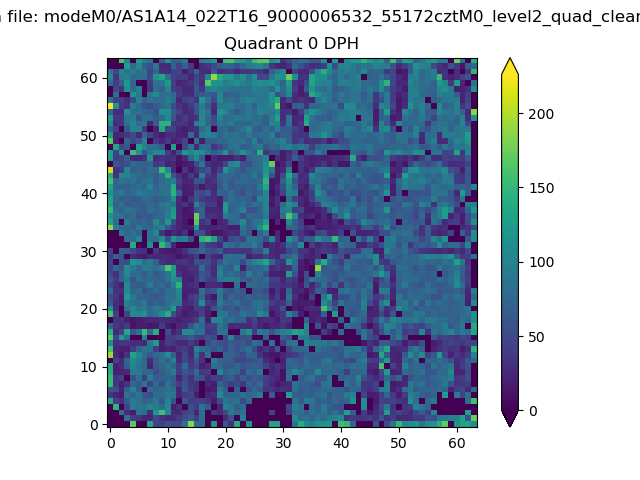 |
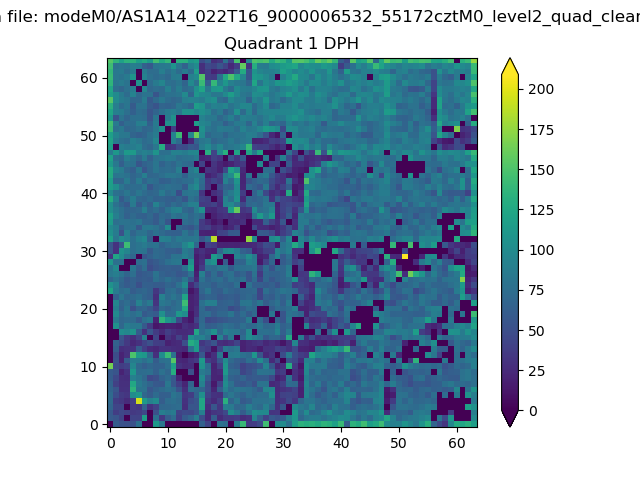 |
Quadrant B |
|---|---|---|---|
| Quadrant D | 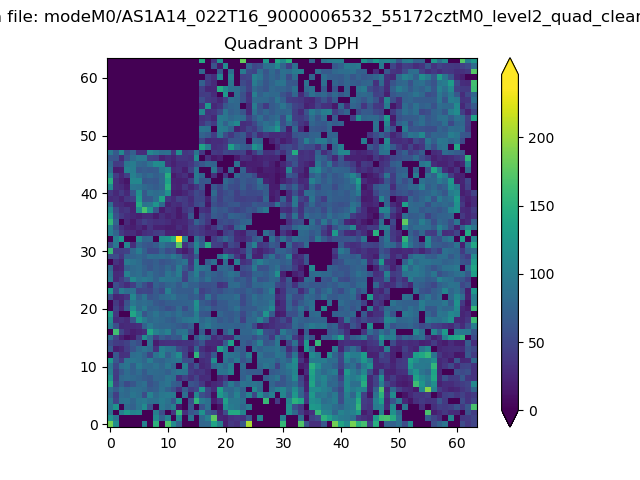 |
 |
Quadrant C |
| Plot type | Count rate plots | Images |
|---|---|---|
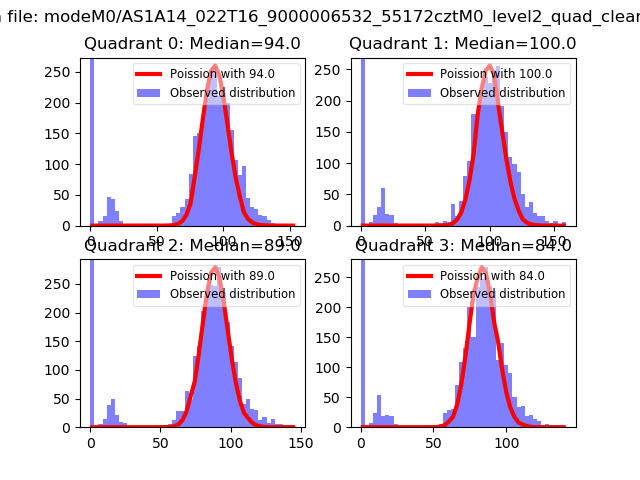
| Comparison with Poisson distribution Blue bars denote a histogram of data divided into 1 sec bins. Red curve is a Poisson curve with rate = median count rate of data. |
 |
 |
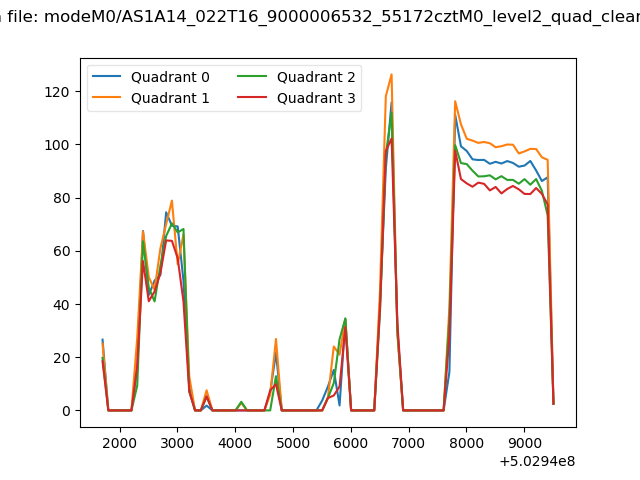
| Quadrant-wise count rates Data is divided into 100 sec bins |
 |
|
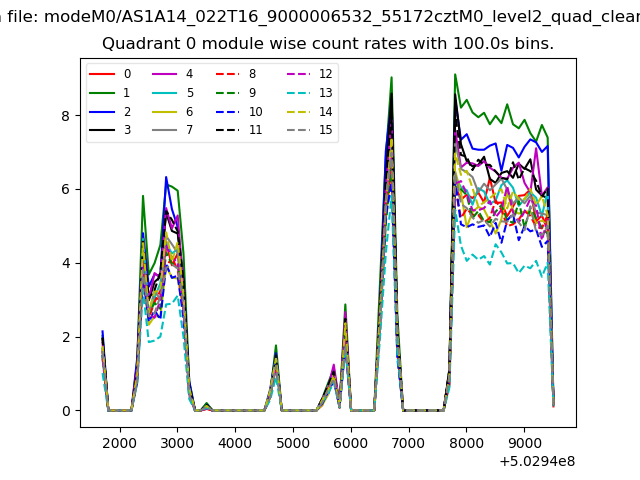
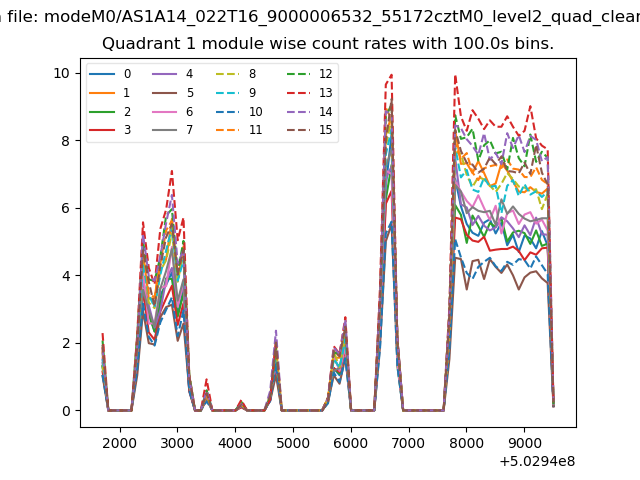
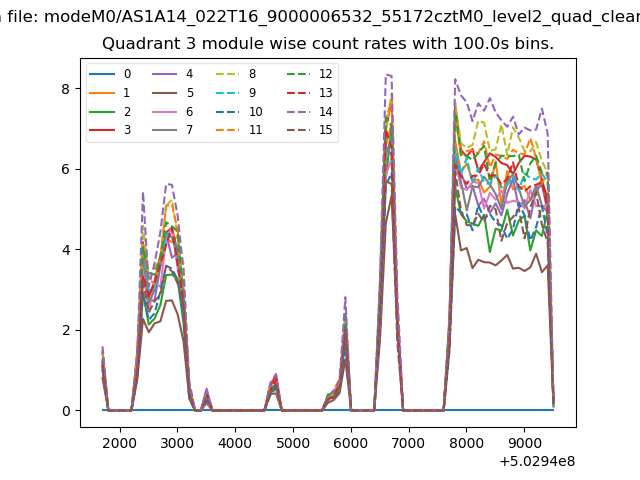
| Module-wise count rates for Quadrant A Data is divided into 100 sec bins |
 |
 |
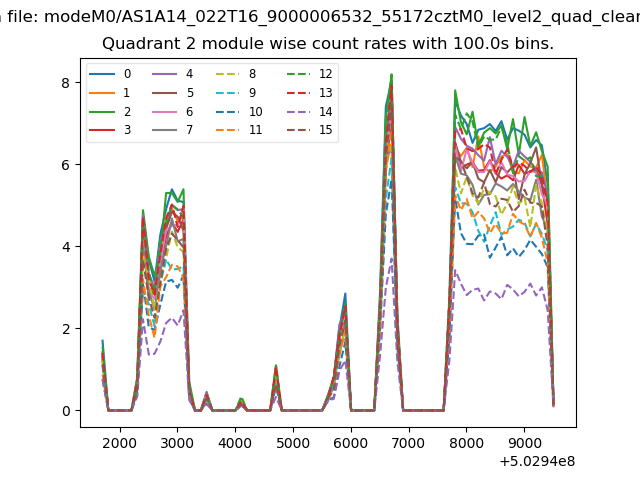
| Module-wise count rates for Quadrant B Data is divided into 100 sec bins |
 |
 |
| Module-wise count rates for Quadrant C Data is divided into 100 sec bins |
 |
 |
| Module-wise count rates for Quadrant D Data is divided into 100 sec bins |
 |
 |
| Parameter | Plot |
|---|---|
| CZT HV Monitor | 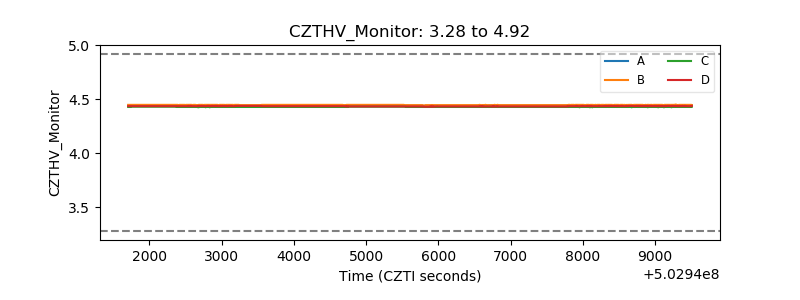 |
| D_VDD | 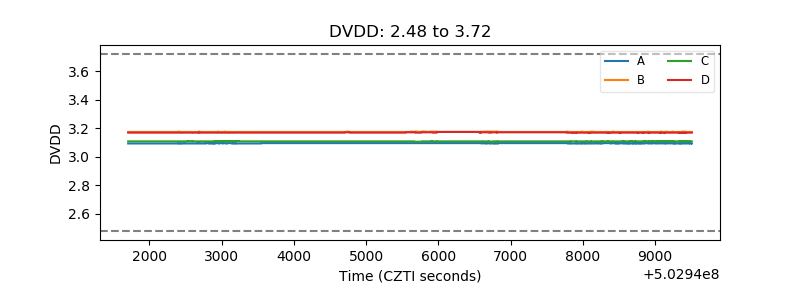 |
| Temperature 1 | 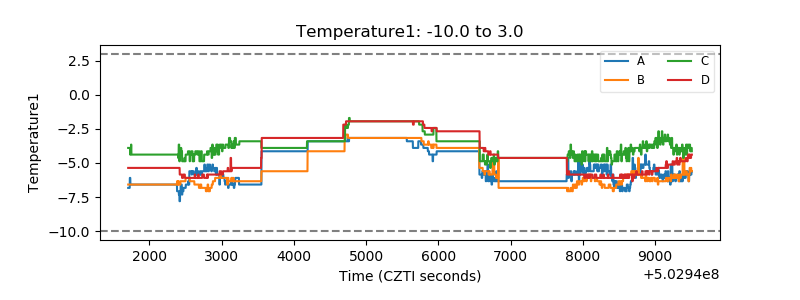 |
| Veto HV Monitor | 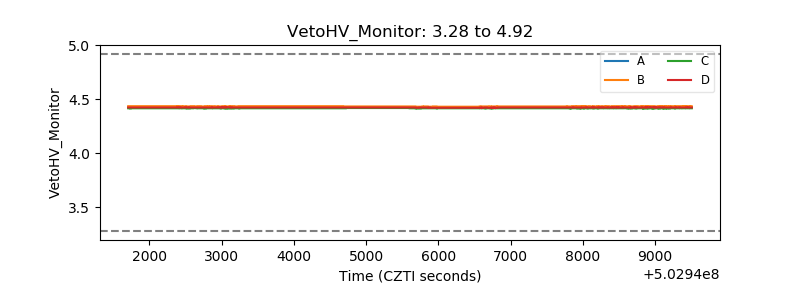 |
| Veto LLD | 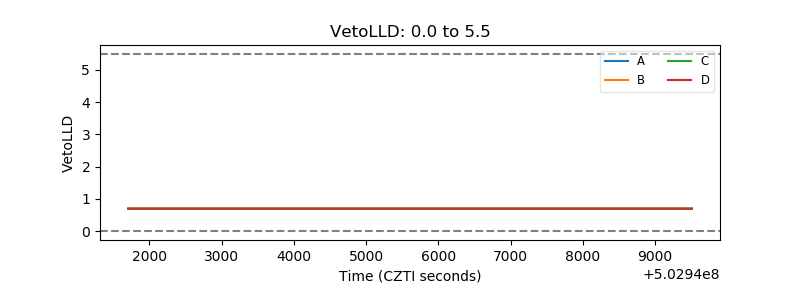 |
| Alpha Counter | 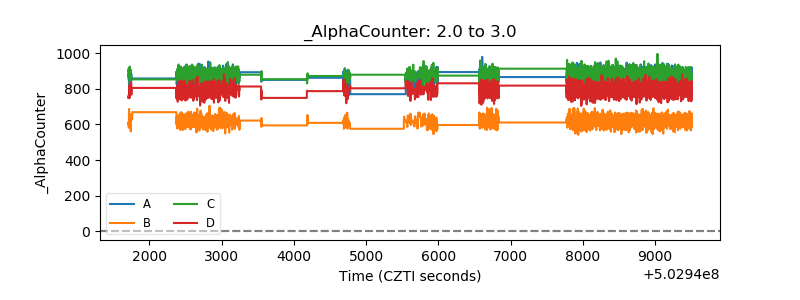 |
| _CPM_Rate | 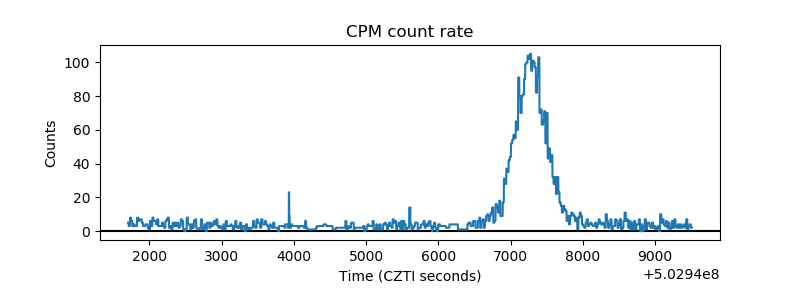 |
| CZT Counter | 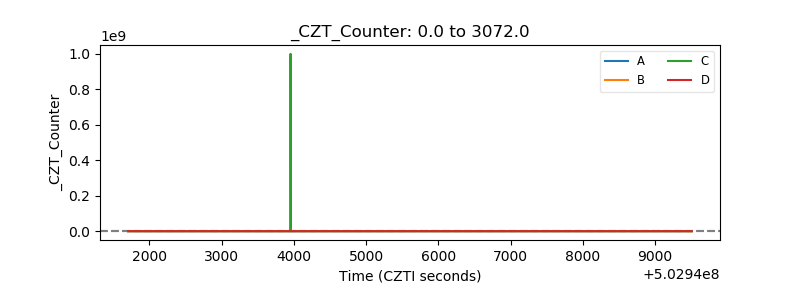 |
| +2.5 Volts monitor |  |
| +5 Volts monitor |  |
| _ROLL_ROT | 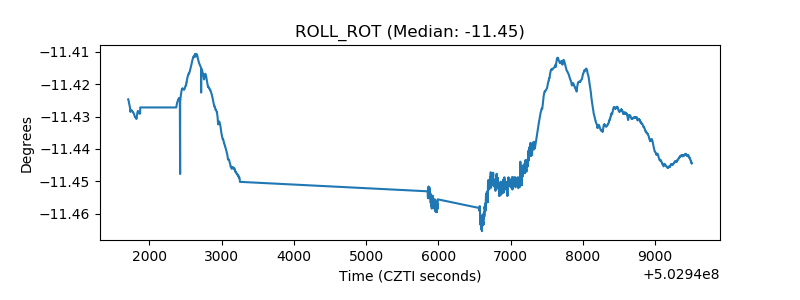 |
| _Roll_DEC | 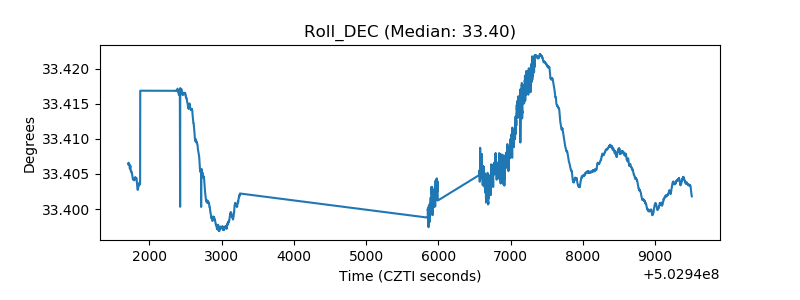 |
| _Roll_RA | 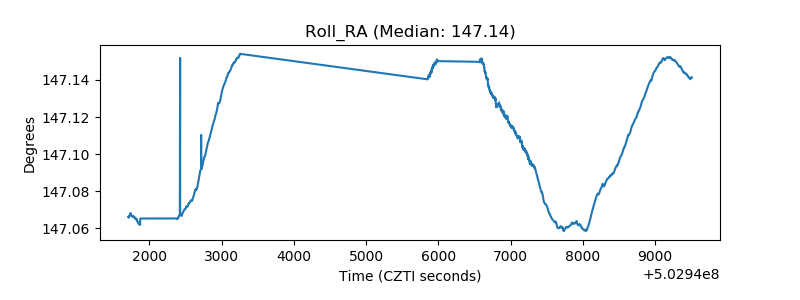 |
| Veto Counter | 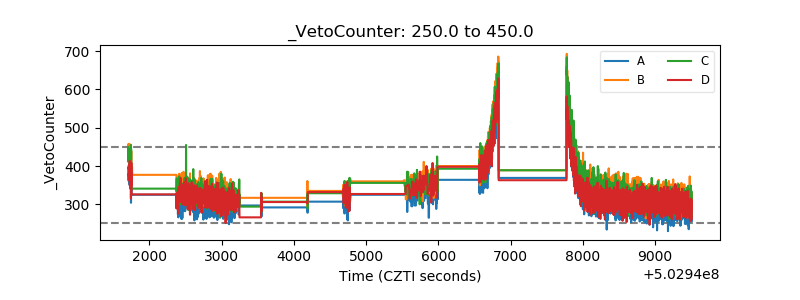 |