| Param | Original file | Final file |
|---|---|---|
| Filename | modeM0/AS1A14_022T16_9000006532_55173cztM0_level2.fits | modeM0/AS1A14_022T16_9000006532_55173cztM0_level2_quad_clean.evt |
| Size (bytes) | 453,769,920 | 104,708,160 |
| Size | 432.7 MB | 99.9 MB |
| Events in quadrant A | 4,467,045 | 668,721 |
| Events in quadrant B | 3,272,183 | 730,474 |
| Events in quadrant C | 4,185,848 | 646,928 |
| Events in quadrant D | 4,294,556 | 607,927 |
| Mode SS | |||
|---|---|---|---|
| Quadrant | BADHDUFLAG | Total packets | Discarded packets |
| A | 0 | 150 | 0 |
| B | 0 | 150 | 0 |
| C | 0 | 150 | 0 |
| D | 0 | 150 | 0 |
| Mode M0 | |||
|---|---|---|---|
| Quadrant | BADHDUFLAG | Total packets | Discarded packets |
| A | 0 | 18713 | 1 |
| B | 0 | 15575 | 1 |
| C | 0 | 17793 | 1 |
| D | 0 | 18273 | 1 |
| Mode M9 | |||
|---|---|---|---|
| Quadrant | BADHDUFLAG | Total packets | Discarded packets |
| A | 0 | 4 | 0 |
| B | 0 | 4 | 0 |
| C | 0 | 4 | 0 |
| D | 0 | 4 | 0 |
| Quadrant | Total seconds | Saturated seconds | Saturation percentage |
|---|---|---|---|
| A | 7422 | 364 | 4.904338% |
| B | 7422 | 234 | 3.152789% |
| C | 7423 | 257 | 3.462212% |
| D | 7423 | 247 | 3.327496% |
Noise dominated data is calculated using 1-second bins in cleaned event files. If a bin has >2000 counts, and if more than 50% of those come from <1% of pixels, then it is considered to be noise-dominated and hence unusable.
| Quadrant | # 1 sec bins | Bins with >0 counts | Bins with >2000 counts | High rate bins dominated by noise | Noise dominated (total time) | Noise dominated (detector-on time) | Marked lightcurve |
|---|---|---|---|---|---|---|---|
| A | 7792 | 7423 | 170 | 170 | 2.18% | 2.29% | 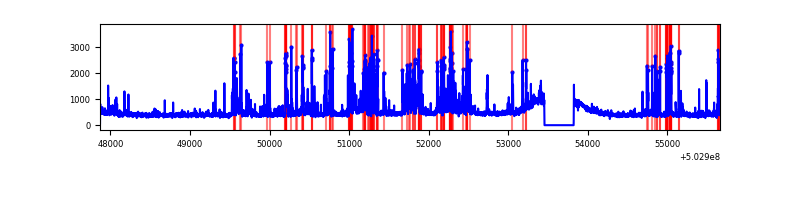 |
| B | 7792 | 7423 | 17 | 17 | 0.22% | 0.23% | 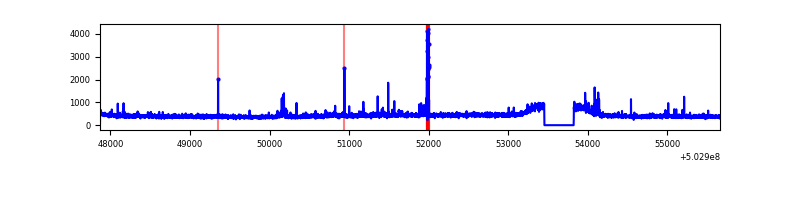 |
| C | 7793 | 7424 | 122 | 122 | 1.57% | 1.64% | 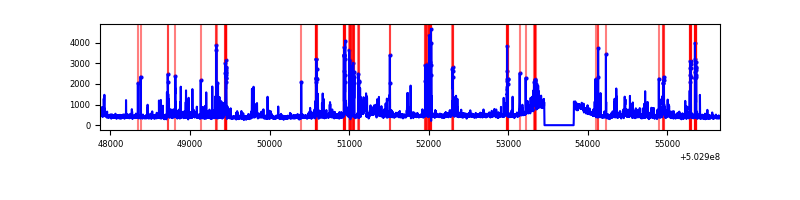 |
| D | 7793 | 7424 | 143 | 143 | 1.83% | 1.93% | 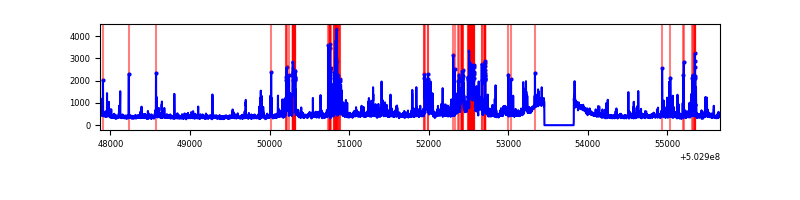 |
Top three noisy pixels from each quadrant. If the there are fewer than three noisy pixels in the level2.evt file, extra rows are filled as -1
| Pixel properties | Quadrant properties | ||||||
|---|---|---|---|---|---|---|---|
| Quadrant | DetID | PixID | Counts | Sigma | Mean | Median | Sigma |
| A | 3 | 78 | 886274 | 4538.45 | 792 | 772 | 195.1 |
| A | 0 | 8 | 379631 | 1941.76 | 792 | 772 | 195.1 |
| A | 12 | 64 | 38084 | 191.23 | 792 | 772 | 195.1 |
| B | 2 | 249 | 62452 | 363.52 | 784 | 755 | 169.7 |
| B | 5 | 185 | 56269 | 327.09 | 784 | 755 | 169.7 |
| B | 0 | 182 | 25180 | 143.91 | 784 | 755 | 169.7 |
| C | 13 | 3 | 342595 | 1629.31 | 766 | 760 | 209.8 |
| C | 1 | 16 | 201704 | 957.77 | 766 | 760 | 209.8 |
| C | 10 | 22 | 190372 | 903.76 | 766 | 760 | 209.8 |
| D | 11 | 129 | 1040291 | 4784.15 | 767 | 735 | 217.3 |
| D | 2 | 249 | 86434 | 394.4 | 767 | 735 | 217.3 |
| D | 3 | 12 | 53718 | 243.83 | 767 | 735 | 217.3 |
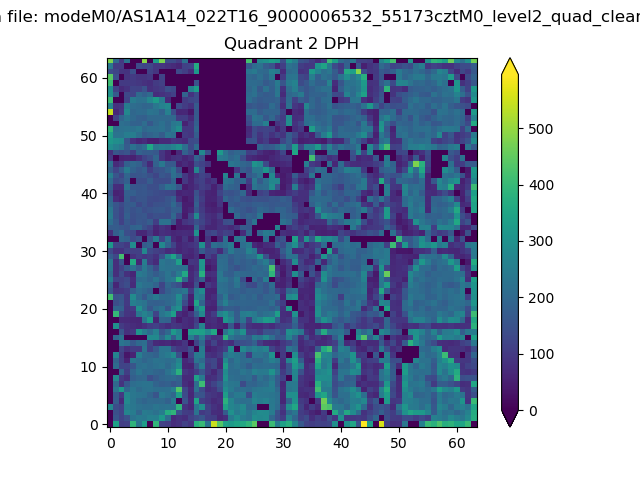
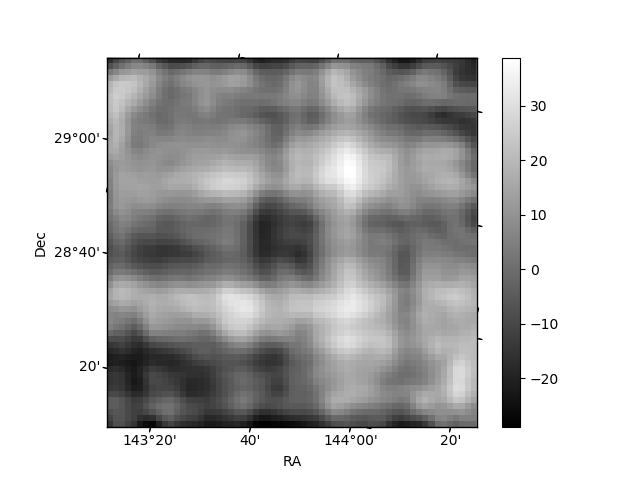
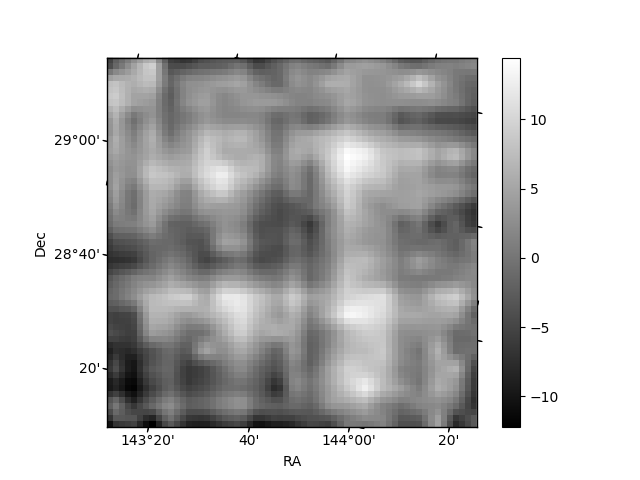
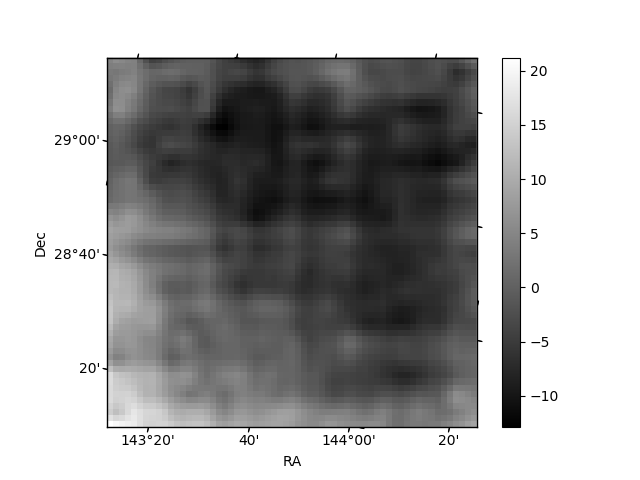
Histogram calculated using DETX and DETY for each event in the final _common_clean file
| Quadrant A | 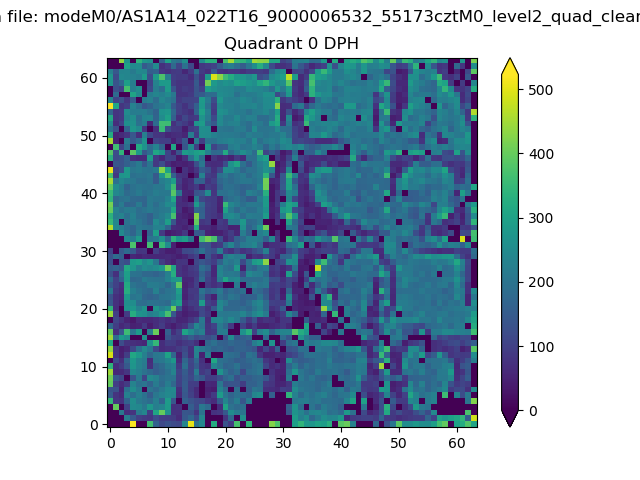 |
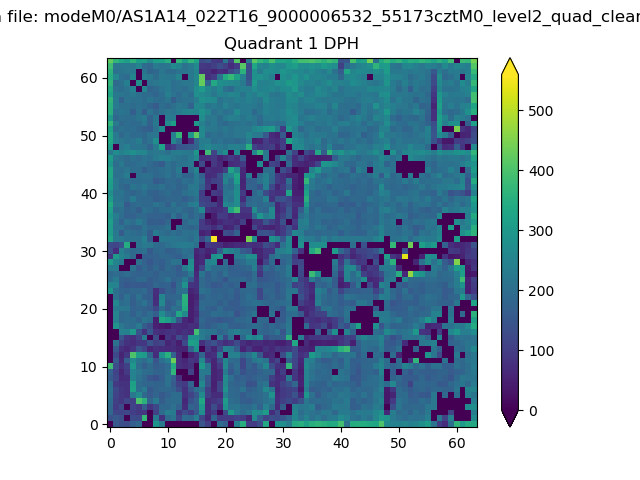 |
Quadrant B |
|---|---|---|---|
| Quadrant D | 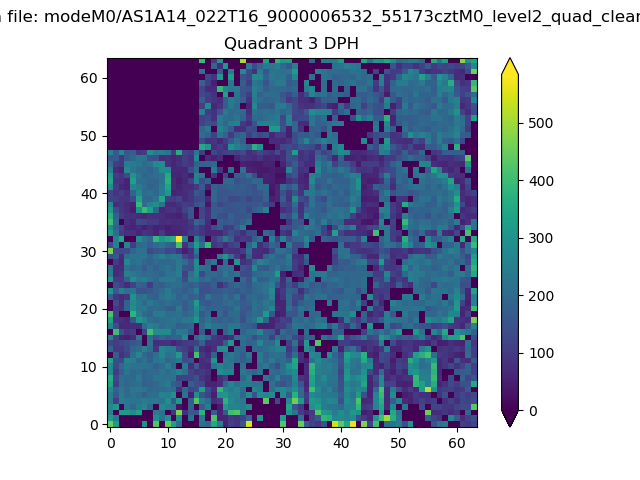 |
 |
Quadrant C |
| Plot type | Count rate plots | Images |
|---|---|---|
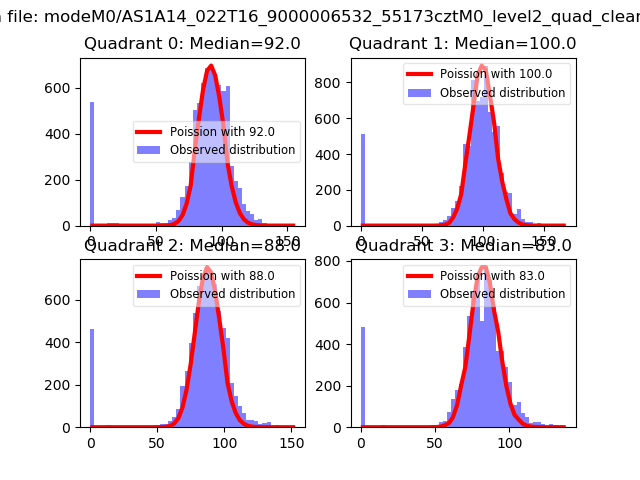
| Comparison with Poisson distribution Blue bars denote a histogram of data divided into 1 sec bins. Red curve is a Poisson curve with rate = median count rate of data. |
 |
 |
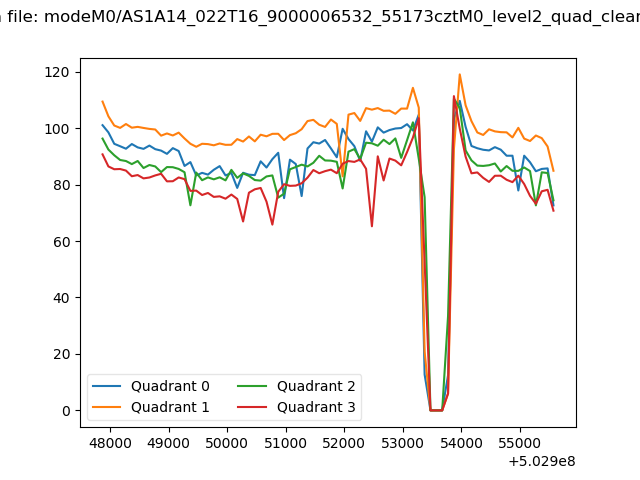
| Quadrant-wise count rates Data is divided into 100 sec bins |
 |
|
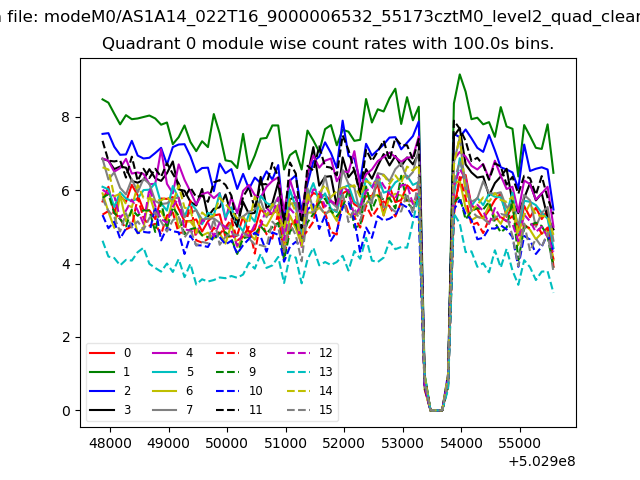
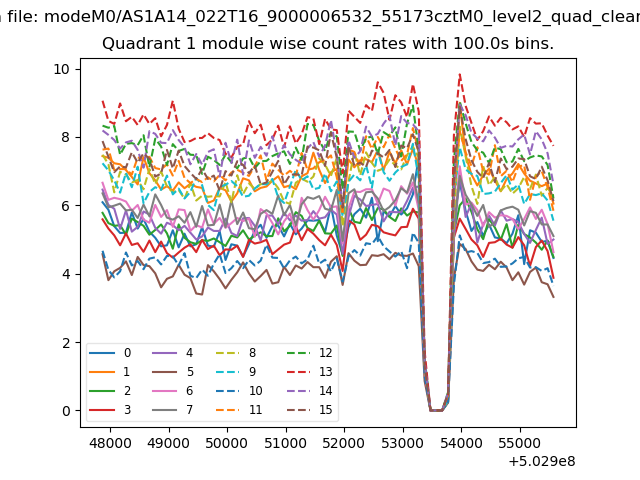
| Module-wise count rates for Quadrant A Data is divided into 100 sec bins |
 |
 |
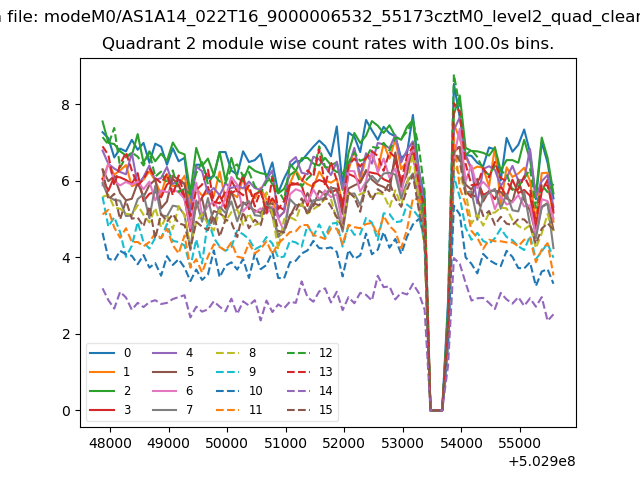
| Module-wise count rates for Quadrant B Data is divided into 100 sec bins |
 |
 |
| Module-wise count rates for Quadrant C Data is divided into 100 sec bins |
 |
 |
| Module-wise count rates for Quadrant D Data is divided into 100 sec bins |
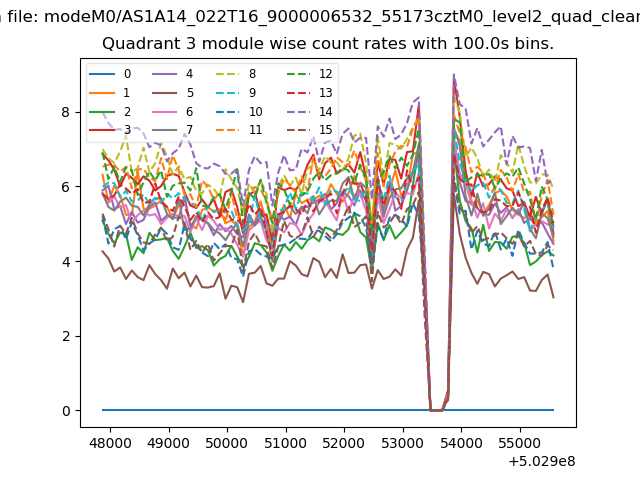 |
 |
| Parameter | Plot |
|---|---|
| CZT HV Monitor | 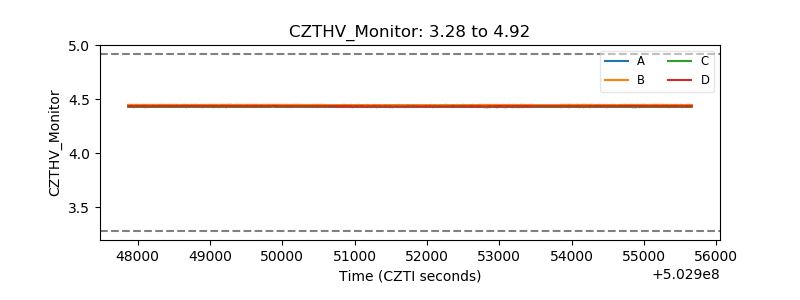 |
| D_VDD | 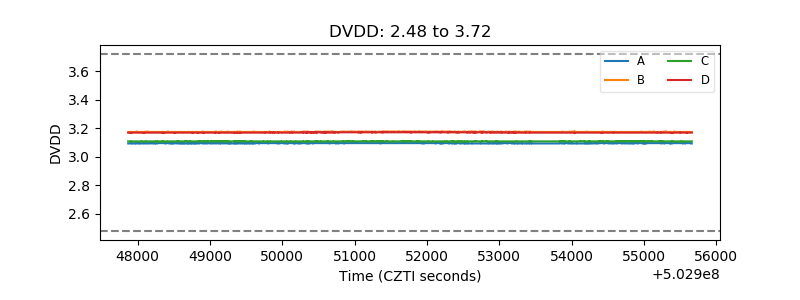 |
| Temperature 1 | 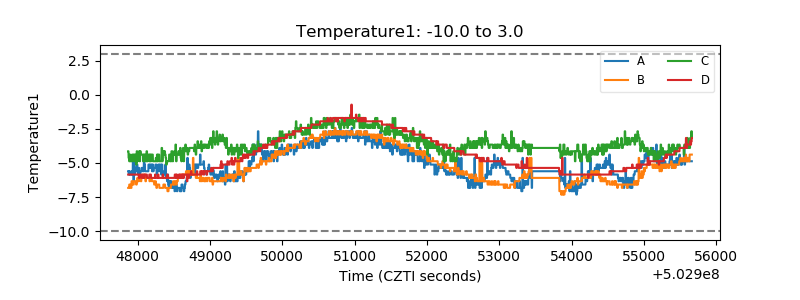 |
| Veto HV Monitor | 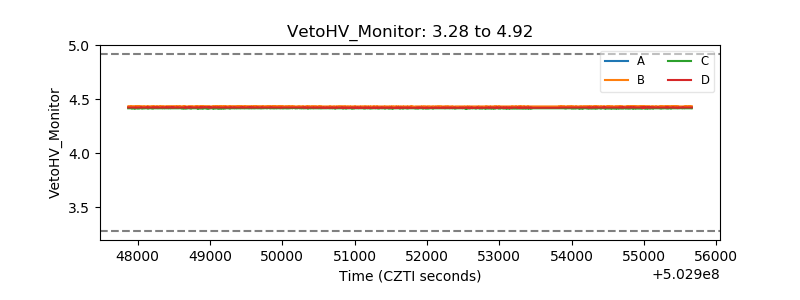 |
| Veto LLD | 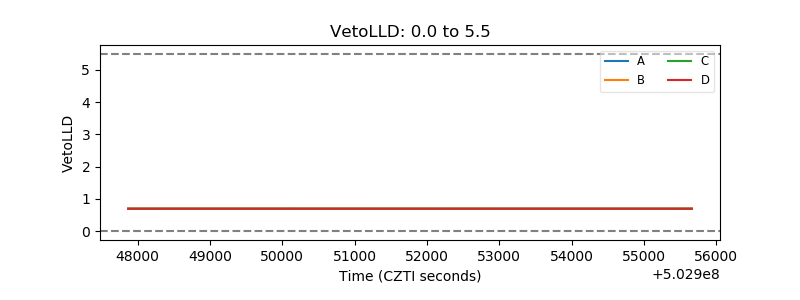 |
| Alpha Counter | 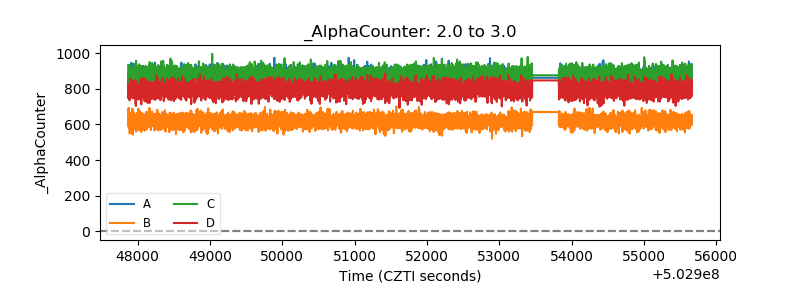 |
| _CPM_Rate | 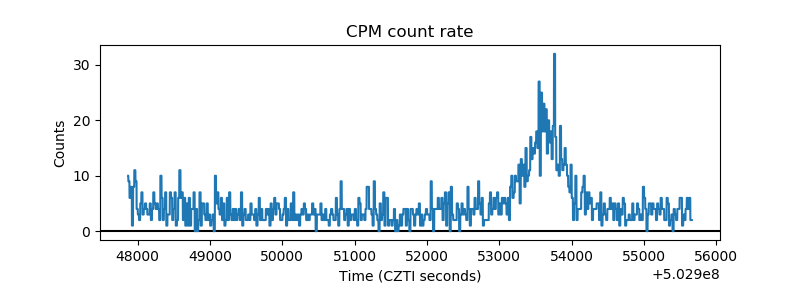 |
| CZT Counter | 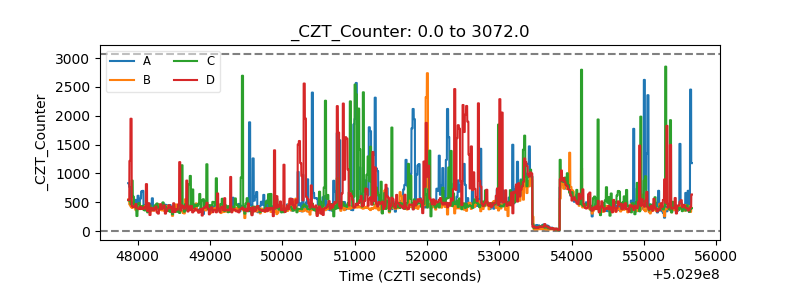 |
| +2.5 Volts monitor |  |
| +5 Volts monitor |  |
| _ROLL_ROT | 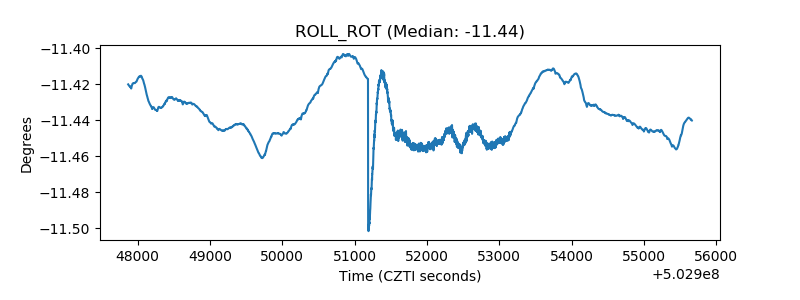 |
| _Roll_DEC | 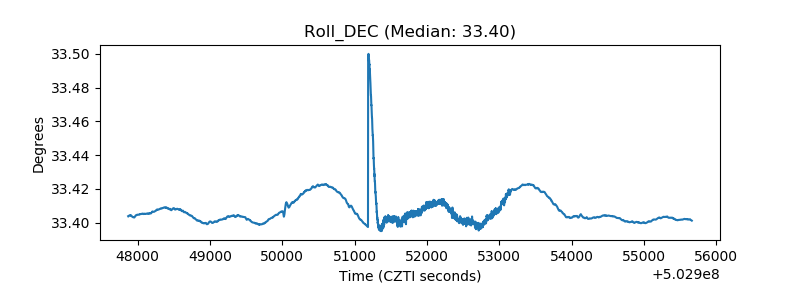 |
| _Roll_RA | 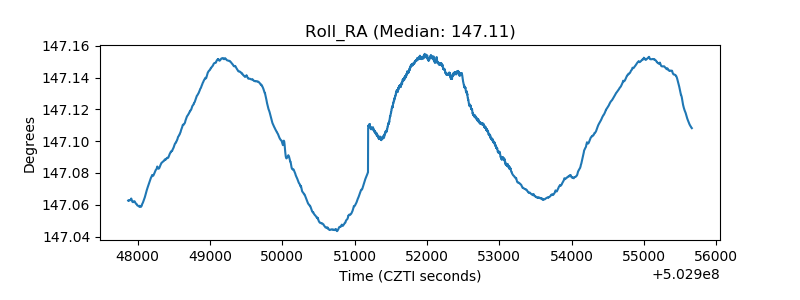 |
| Veto Counter | 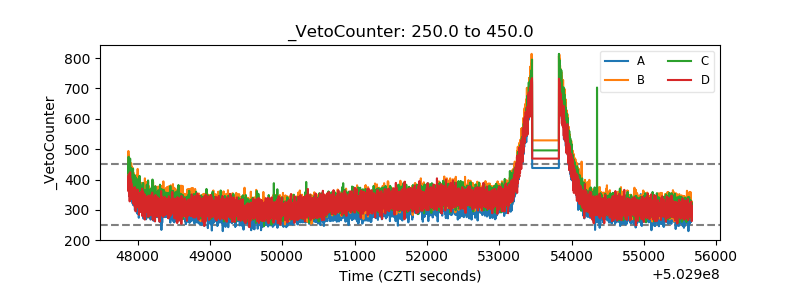 |