| Param | Original file | Final file |
|---|---|---|
| Filename | modeM0/AS1A14_022T16_9000006532_55174cztM0_level2.fits | modeM0/AS1A14_022T16_9000006532_55174cztM0_level2_quad_clean.evt |
| Size (bytes) | 470,191,680 | 96,592,320 |
| Size | 448.4 MB | 92.1 MB |
| Events in quadrant A | 5,781,864 | 593,432 |
| Events in quadrant B | 3,109,126 | 687,755 |
| Events in quadrant C | 4,484,865 | 590,694 |
| Events in quadrant D | 3,491,950 | 571,428 |
| Mode SS | |||
|---|---|---|---|
| Quadrant | BADHDUFLAG | Total packets | Discarded packets |
| A | 0 | 138 | 0 |
| B | 0 | 138 | 0 |
| C | 0 | 138 | 0 |
| D | 0 | 138 | 0 |
| Mode M0 | |||
|---|---|---|---|
| Quadrant | BADHDUFLAG | Total packets | Discarded packets |
| A | 0 | 22090 | 0 |
| B | 0 | 14626 | 0 |
| C | 0 | 18327 | 0 |
| D | 0 | 15482 | 0 |
| Quadrant | Total seconds | Saturated seconds | Saturation percentage |
|---|---|---|---|
| A | 6910 | 656 | 9.493488% |
| B | 6910 | 63 | 0.911722% |
| C | 6911 | 249 | 3.602952% |
| D | 6911 | 27 | 0.390682% |
Noise dominated data is calculated using 1-second bins in cleaned event files. If a bin has >2000 counts, and if more than 50% of those come from <1% of pixels, then it is considered to be noise-dominated and hence unusable.
| Quadrant | # 1 sec bins | Bins with >0 counts | Bins with >2000 counts | High rate bins dominated by noise | Noise dominated (total time) | Noise dominated (detector-on time) | Marked lightcurve |
|---|---|---|---|---|---|---|---|
| A | 6910 | 6910 | 583 | 583 | 8.44% | 8.44% | 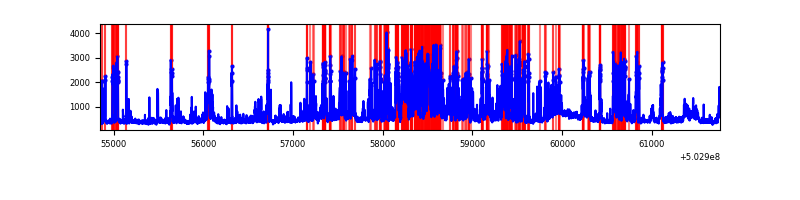 |
| B | 6910 | 6910 | 24 | 24 | 0.35% | 0.35% | 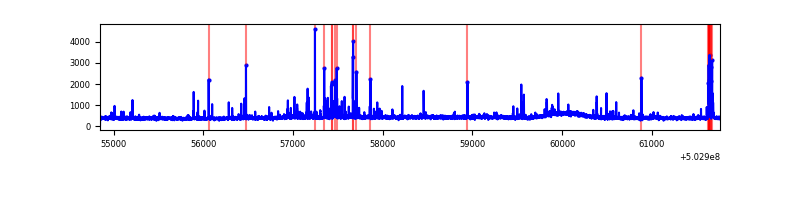 |
| C | 6911 | 6911 | 200 | 200 | 2.89% | 2.89% | 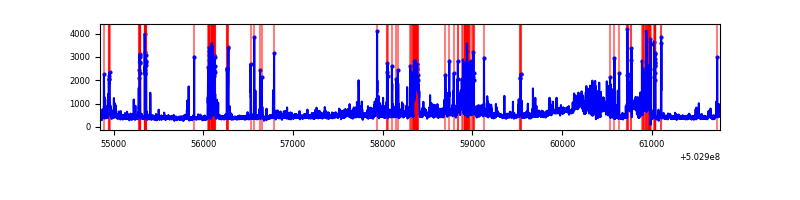 |
| D | 6911 | 6911 | 27 | 27 | 0.39% | 0.39% | 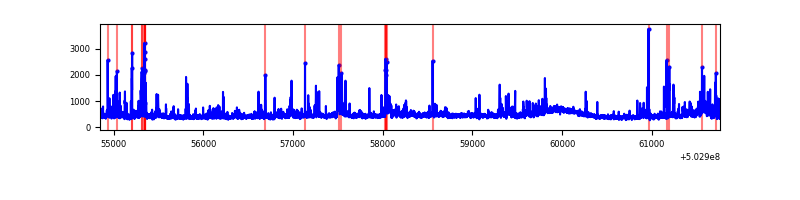 |
Top three noisy pixels from each quadrant. If the there are fewer than three noisy pixels in the level2.evt file, extra rows are filled as -1
| Pixel properties | Quadrant properties | ||||||
|---|---|---|---|---|---|---|---|
| Quadrant | DetID | PixID | Counts | Sigma | Mean | Median | Sigma |
| A | 3 | 78 | 1964166 | 11258.14 | 704 | 686 | 174.4 |
| A | 0 | 8 | 763060 | 4371.28 | 704 | 686 | 174.4 |
| A | 3 | 45 | 112468 | 640.93 | 704 | 686 | 174.4 |
| B | 5 | 185 | 93322 | 597.35 | 716 | 690 | 155.1 |
| B | 2 | 249 | 85420 | 546.39 | 716 | 690 | 155.1 |
| B | 0 | 182 | 57146 | 364.06 | 716 | 690 | 155.1 |
| C | 9 | 38 | 591379 | 3072.18 | 692 | 684 | 192.3 |
| C | 15 | 199 | 292805 | 1519.31 | 692 | 684 | 192.3 |
| C | 10 | 22 | 254209 | 1318.57 | 692 | 684 | 192.3 |
| D | 11 | 129 | 578328 | 2961.62 | 700 | 670 | 195.0 |
| D | 2 | 249 | 68841 | 349.51 | 700 | 670 | 195.0 |
| D | 5 | 173 | 53669 | 271.72 | 700 | 670 | 195.0 |
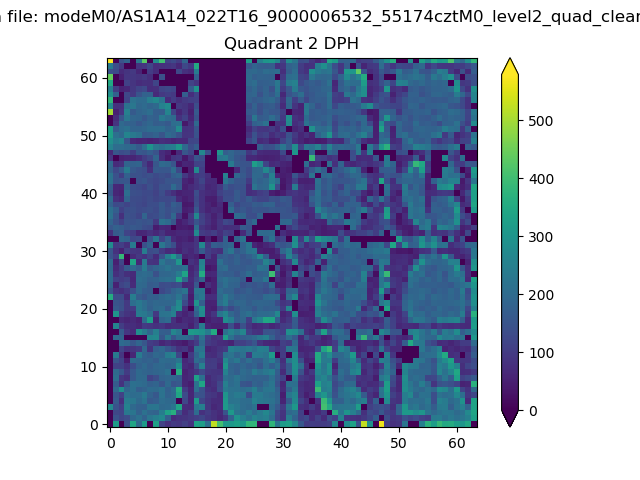
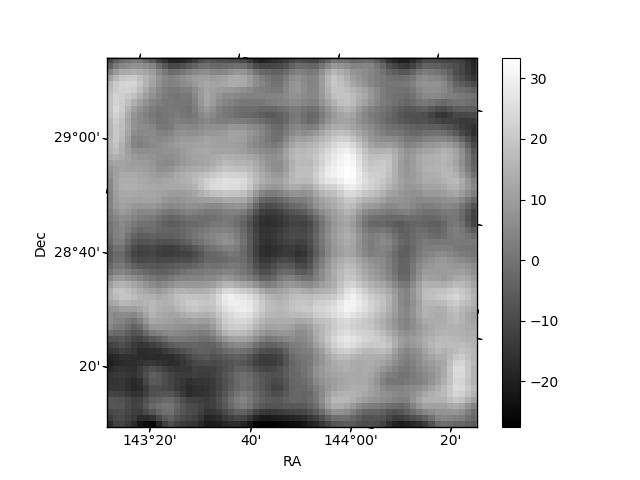
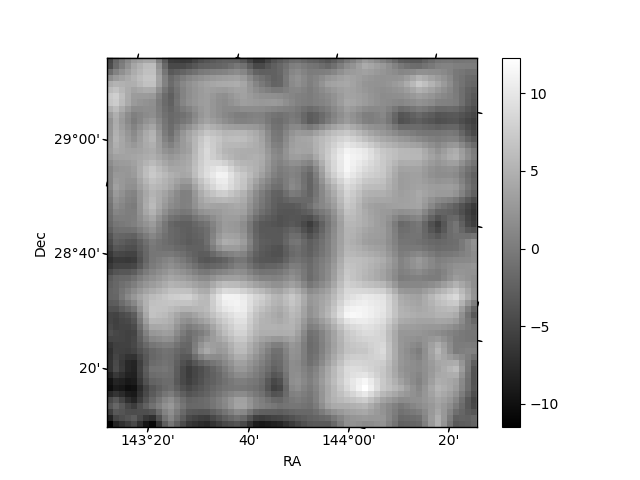
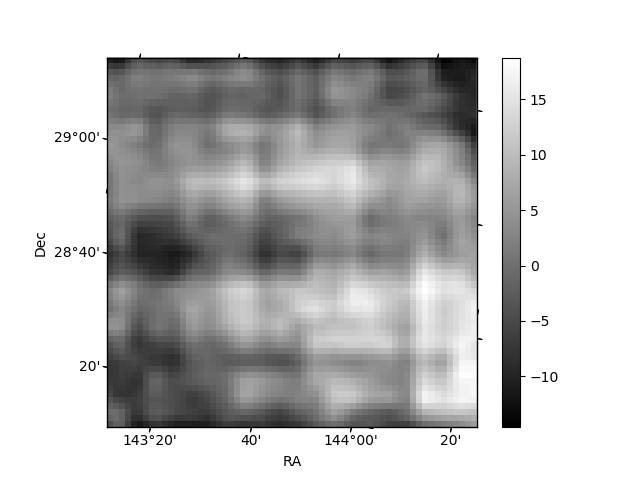
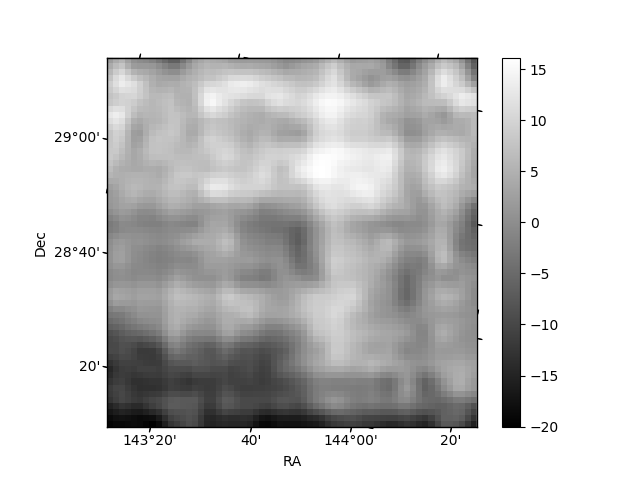
Histogram calculated using DETX and DETY for each event in the final _common_clean file
| Quadrant A | 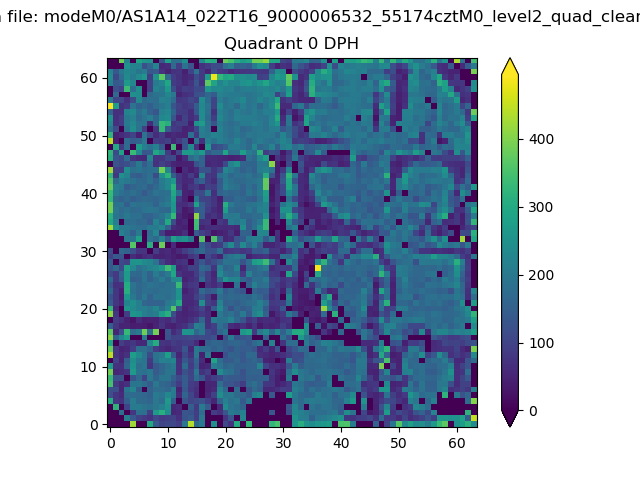 |
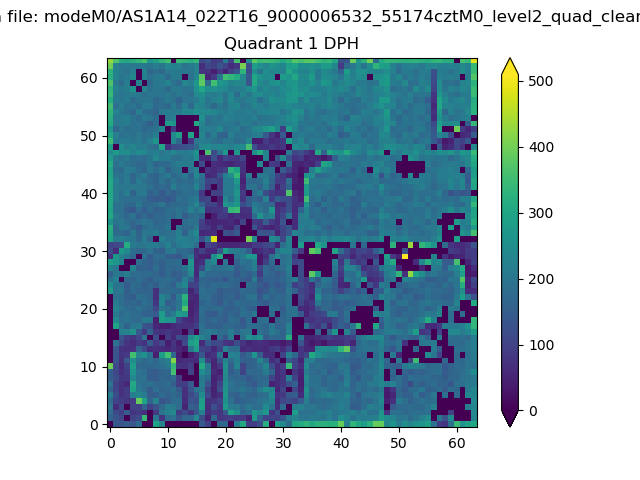 |
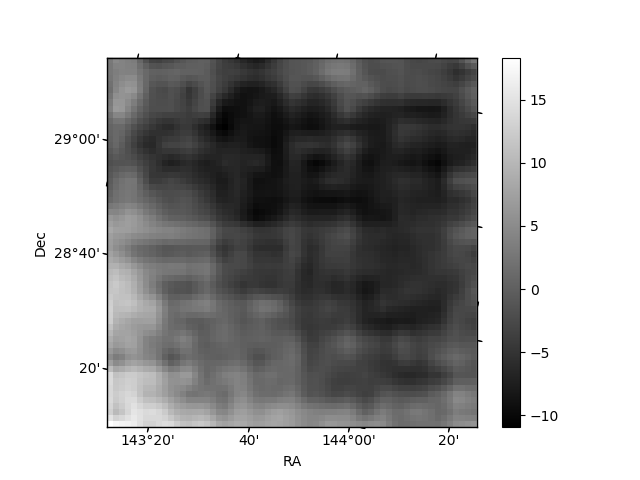
Quadrant B |
|---|---|---|---|
| Quadrant D | 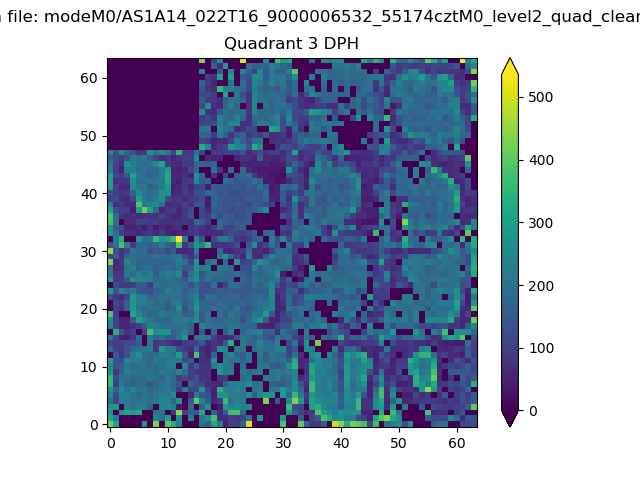 |
 |
Quadrant C |
| Plot type | Count rate plots | Images |
|---|---|---|
| Comparison with Poisson distribution Blue bars denote a histogram of data divided into 1 sec bins. Red curve is a Poisson curve with rate = median count rate of data. |
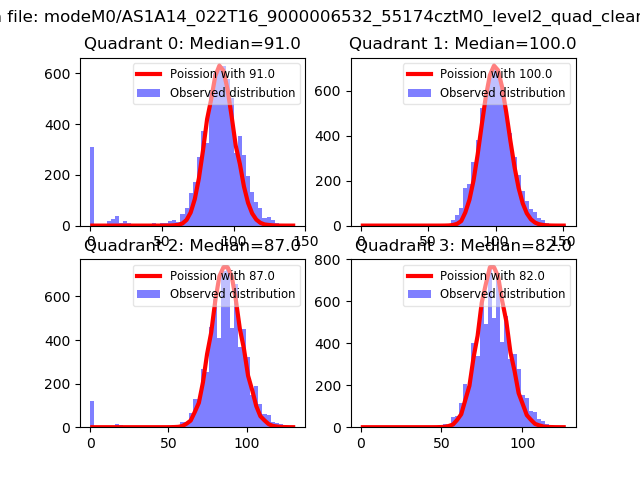 |
 |
| Quadrant-wise count rates Data is divided into 100 sec bins |
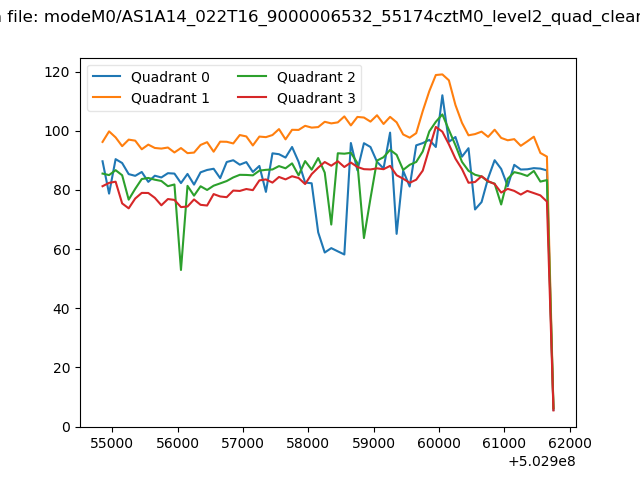 |
|
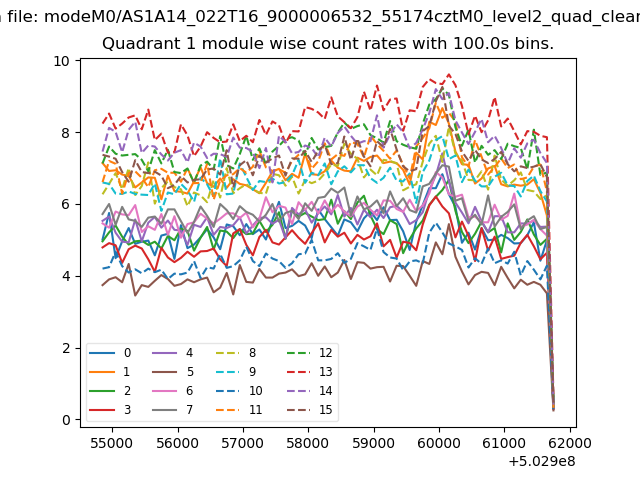
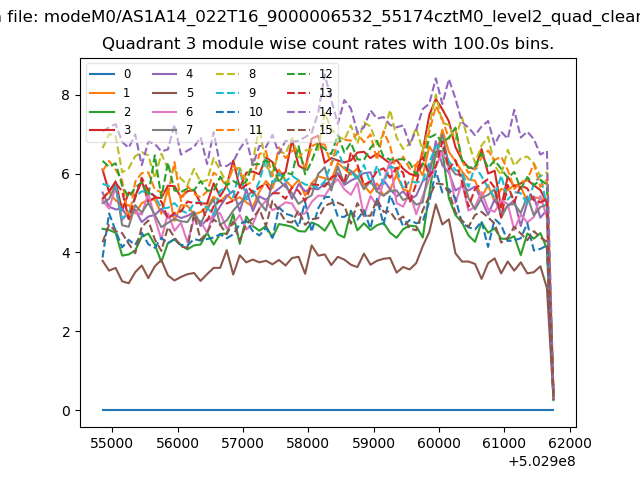
| Module-wise count rates for Quadrant A Data is divided into 100 sec bins |
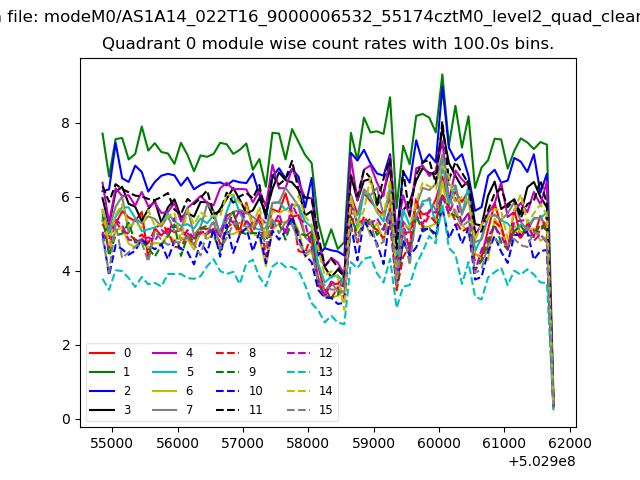 |
 |
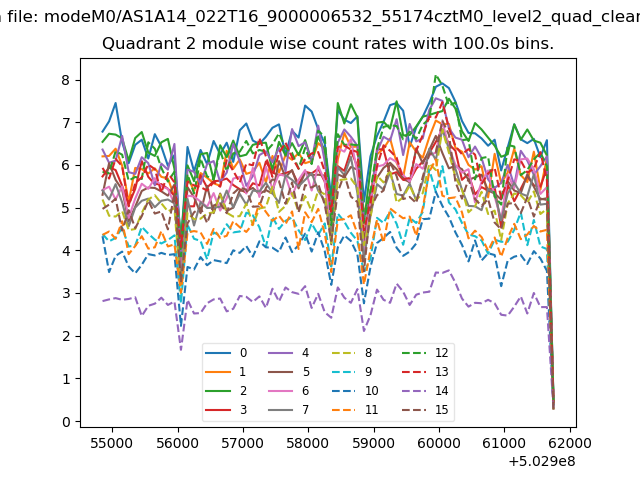
| Module-wise count rates for Quadrant B Data is divided into 100 sec bins |
 |
 |
| Module-wise count rates for Quadrant C Data is divided into 100 sec bins |
 |
 |
| Module-wise count rates for Quadrant D Data is divided into 100 sec bins |
 |
 |
| Parameter | Plot |
|---|---|
| CZT HV Monitor | 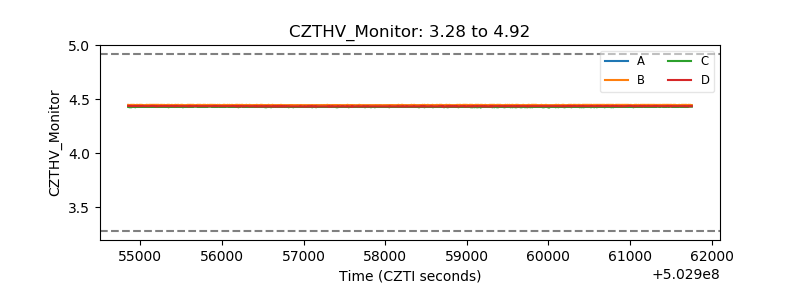 |
| D_VDD | 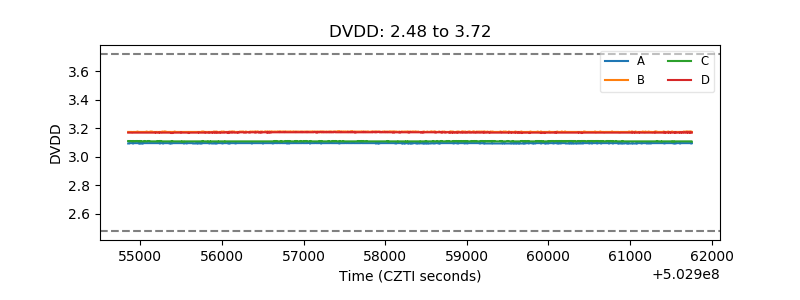 |
| Temperature 1 | 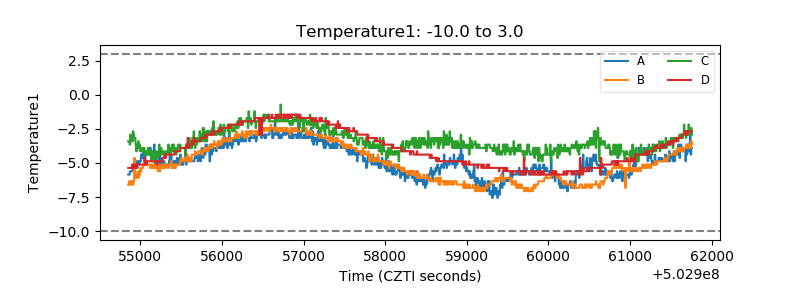 |
| Veto HV Monitor | 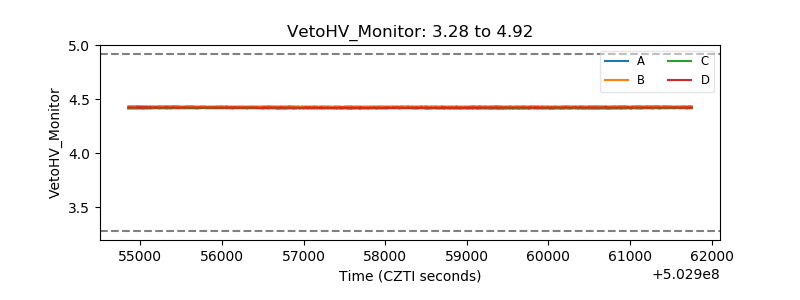 |
| Veto LLD | 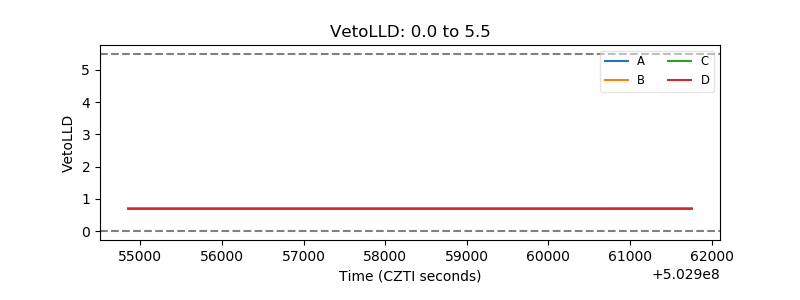 |
| Alpha Counter | 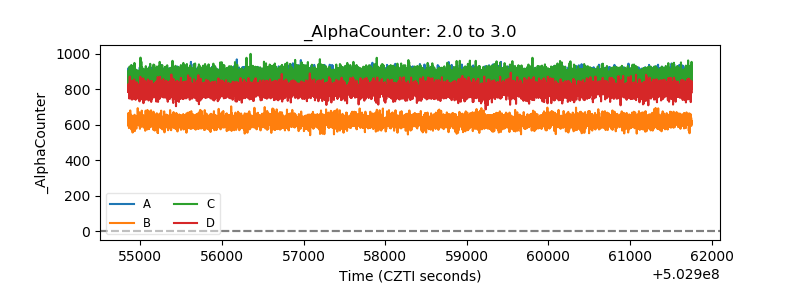 |
| _CPM_Rate | 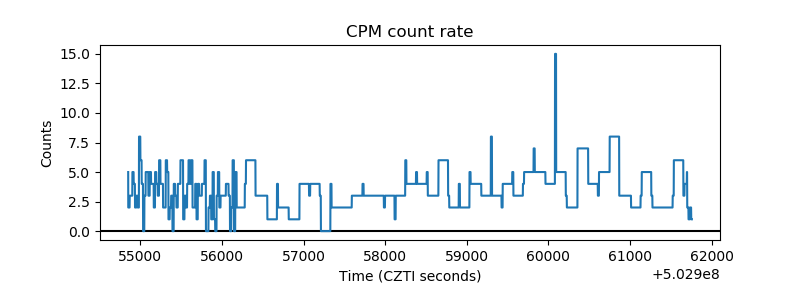 |
| CZT Counter | 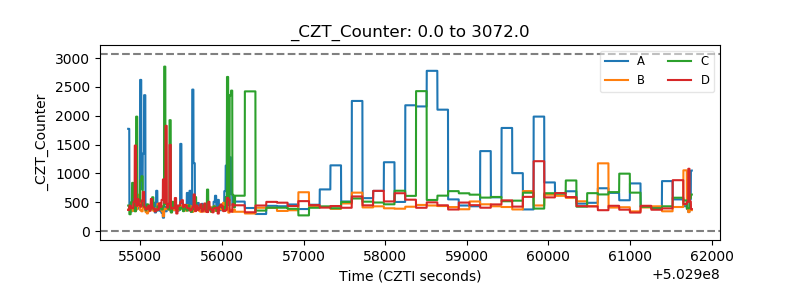 |
| +2.5 Volts monitor |  |
| +5 Volts monitor |  |
| _ROLL_ROT | 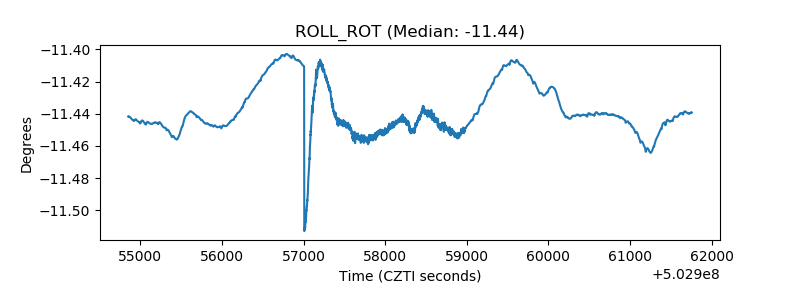 |
| _Roll_DEC | 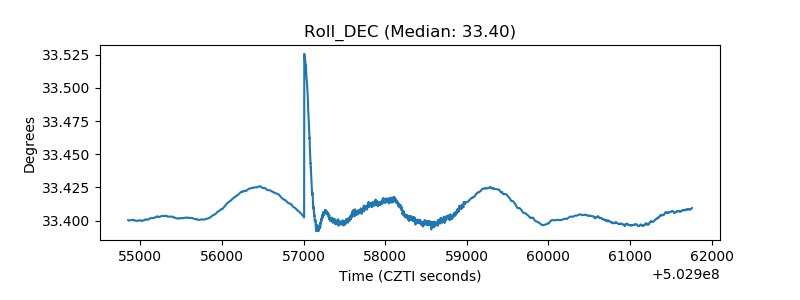 |
| _Roll_RA | 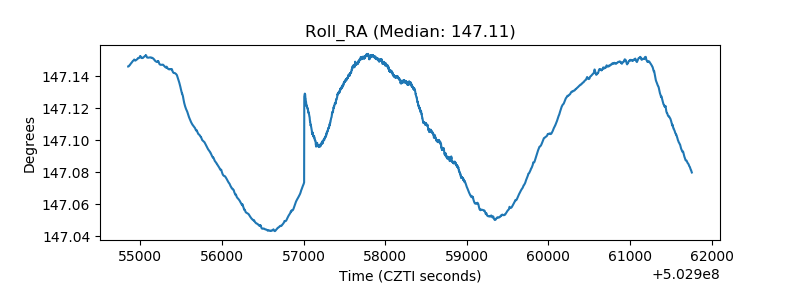 |
| Veto Counter | 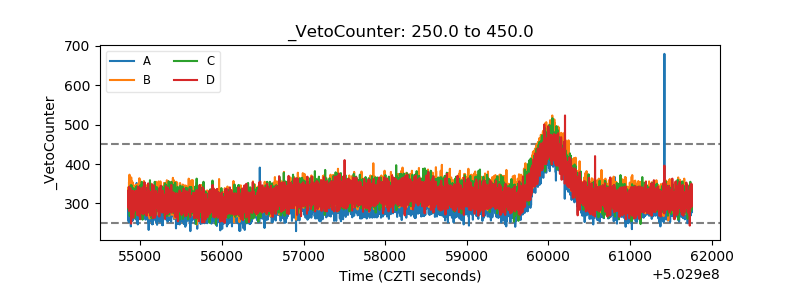 |