| Param | Original file | Final file |
|---|---|---|
| Filename | modeM0/AS1A14_022T16_9000006532_55175cztM0_level2.fits | modeM0/AS1A14_022T16_9000006532_55175cztM0_level2_quad_clean.evt |
| Size (bytes) | 1,564,358,400 | 341,732,160 |
| Size | 1.5 GB | 325.9 MB |
| Events in quadrant A | 17,062,468 | 2,163,126 |
| Events in quadrant B | 10,825,803 | 2,416,594 |
| Events in quadrant C | 14,568,001 | 2,102,008 |
| Events in quadrant D | 13,574,901 | 1,996,438 |
| Mode SS | |||
|---|---|---|---|
| Quadrant | BADHDUFLAG | Total packets | Discarded packets |
| A | 0 | 490 | 0 |
| B | 0 | 490 | 0 |
| C | 0 | 490 | 0 |
| D | 0 | 490 | 0 |
| Mode M0 | |||
|---|---|---|---|
| Quadrant | BADHDUFLAG | Total packets | Discarded packets |
| A | 0 | 67992 | 2 |
| B | 0 | 51029 | 2 |
| C | 0 | 60756 | 4 |
| D | 0 | 58287 | 3 |
| Mode M9 | |||
|---|---|---|---|
| Quadrant | BADHDUFLAG | Total packets | Discarded packets |
| A | 0 | 13 | 0 |
| B | 0 | 13 | 0 |
| C | 0 | 13 | 0 |
| D | 0 | 13 | 0 |
| Quadrant | Total seconds | Saturated seconds | Saturation percentage |
|---|---|---|---|
| A | 24249 | 1444 | 5.954885% |
| B | 24249 | 366 | 1.509341% |
| C | 24248 | 801 | 3.303365% |
| D | 24248 | 470 | 1.938304% |
Noise dominated data is calculated using 1-second bins in cleaned event files. If a bin has >2000 counts, and if more than 50% of those come from <1% of pixels, then it is considered to be noise-dominated and hence unusable.
| Quadrant | # 1 sec bins | Bins with >0 counts | Bins with >2000 counts | High rate bins dominated by noise | Noise dominated (total time) | Noise dominated (detector-on time) | Marked lightcurve |
|---|---|---|---|---|---|---|---|
| A | 25559 | 24251 | 1094 | 1094 | 4.28% | 4.51% | 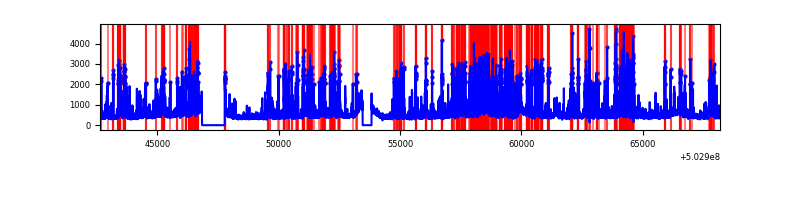 |
| B | 25559 | 24251 | 58 | 58 | 0.23% | 0.24% | 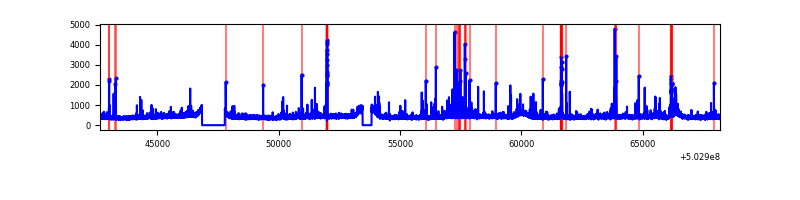 |
| C | 25559 | 24251 | 540 | 540 | 2.11% | 2.23% | 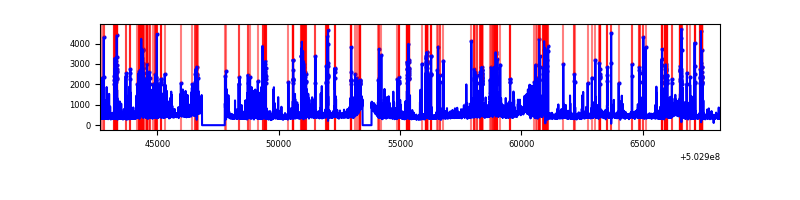 |
| D | 25558 | 24250 | 338 | 338 | 1.32% | 1.39% | 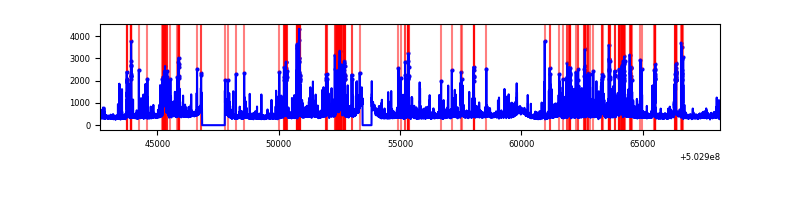 |
Top three noisy pixels from each quadrant. If the there are fewer than three noisy pixels in the level2.evt file, extra rows are filled as -1
| Pixel properties | Quadrant properties | ||||||
|---|---|---|---|---|---|---|---|
| Quadrant | DetID | PixID | Counts | Sigma | Mean | Median | Sigma |
| A | 3 | 78 | 4761423 | 7629.62 | 2537 | 2475 | 623.7 |
| A | 0 | 8 | 1293274 | 2069.43 | 2537 | 2475 | 623.7 |
| A | 3 | 45 | 647123 | 1033.51 | 2537 | 2475 | 623.7 |
| B | 5 | 185 | 238174 | 431.27 | 2541 | 2445 | 546.6 |
| B | 2 | 249 | 227146 | 411.09 | 2541 | 2445 | 546.6 |
| B | 4 | 81 | 136295 | 244.88 | 2541 | 2445 | 546.6 |
| C | 6 | 223 | 924459 | 1371.95 | 2467 | 2444 | 672.0 |
| C | 10 | 22 | 685951 | 1017.05 | 2467 | 2444 | 672.0 |
| C | 9 | 38 | 669604 | 992.73 | 2467 | 2444 | 672.0 |
| D | 11 | 129 | 2797290 | 4018.63 | 2485 | 2383 | 695.5 |
| D | 2 | 249 | 326025 | 465.34 | 2485 | 2383 | 695.5 |
| D | 2 | 120 | 204761 | 290.99 | 2485 | 2383 | 695.5 |
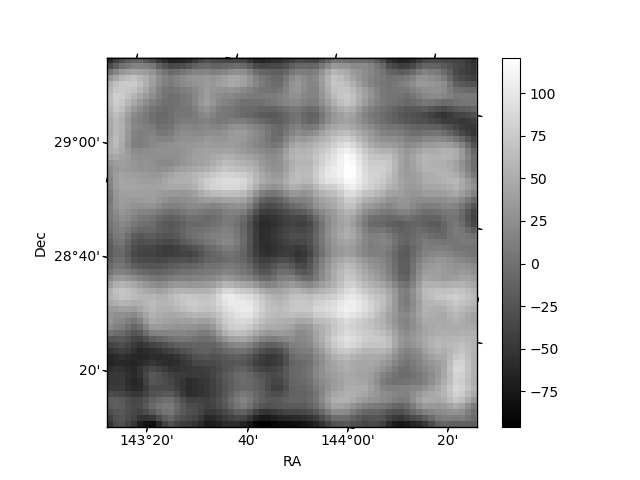
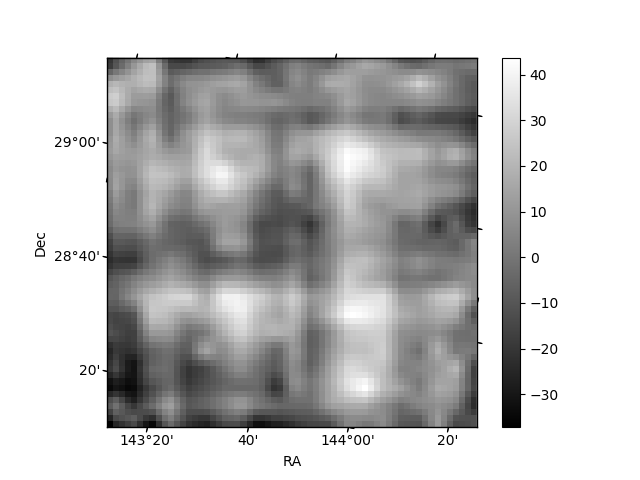
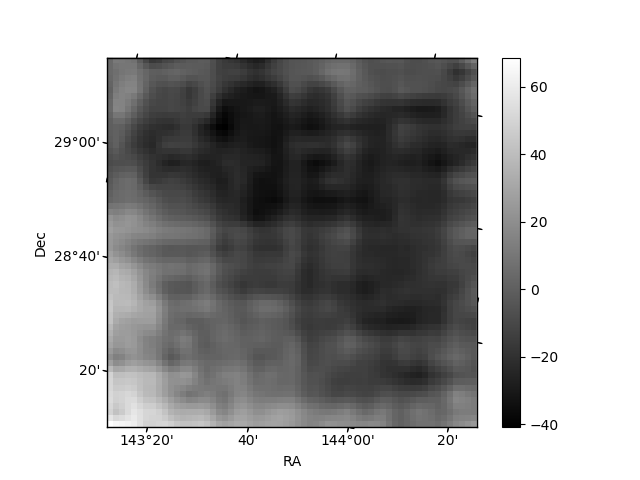
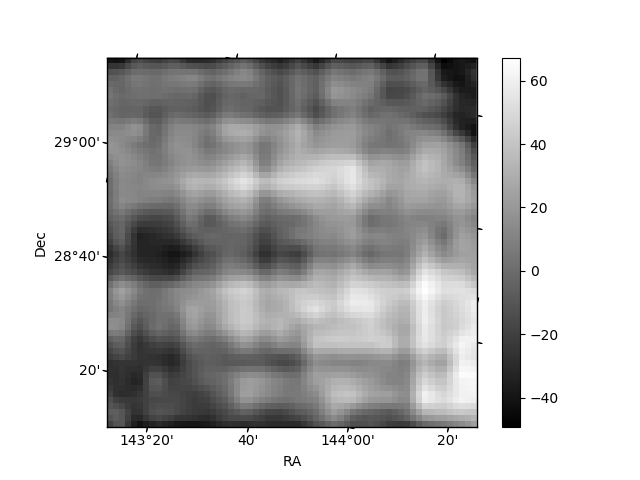
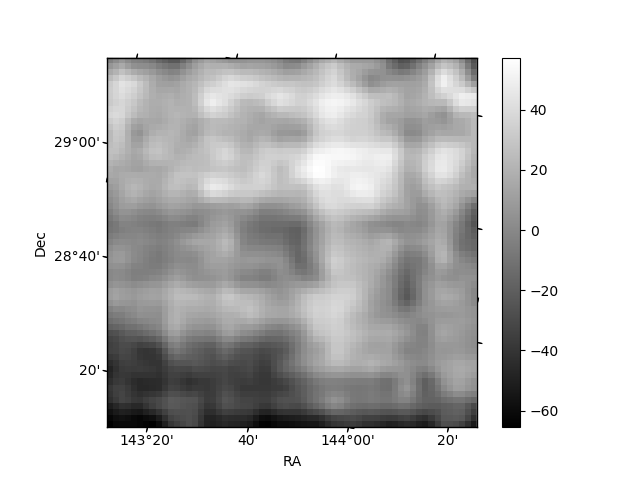
Histogram calculated using DETX and DETY for each event in the final _common_clean file
| Quadrant A | 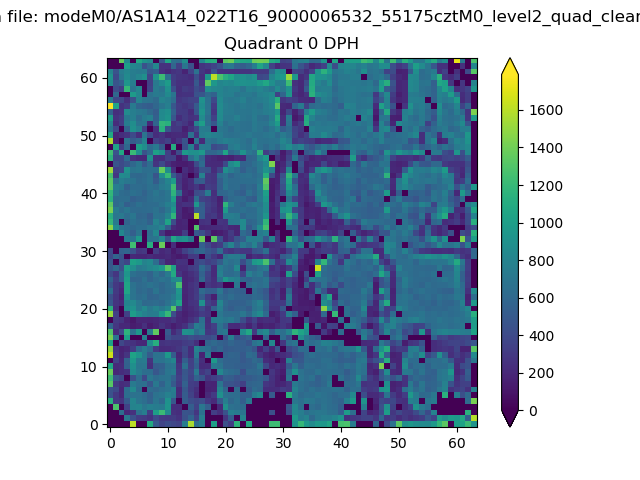 |
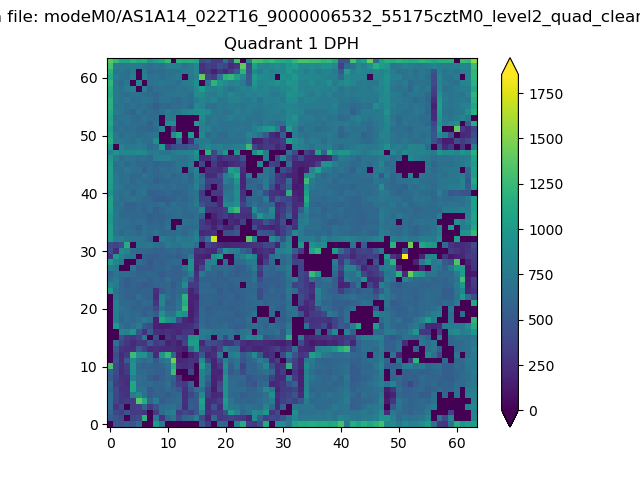 |
Quadrant B |
|---|---|---|---|
| Quadrant D | 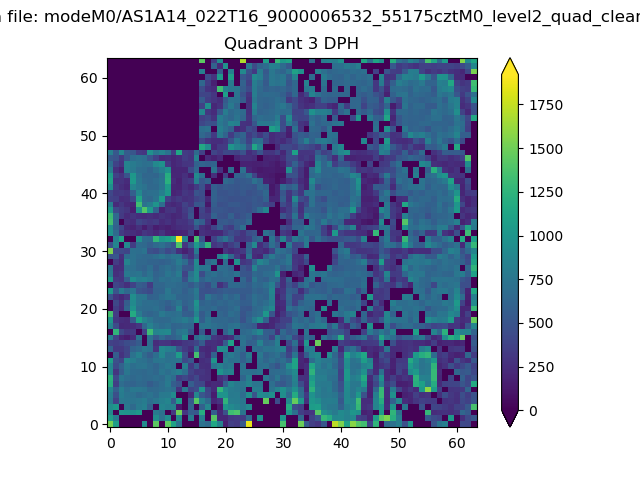 |
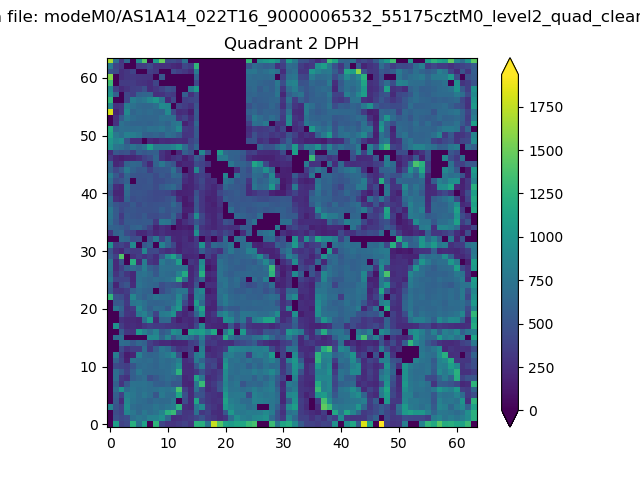 |
Quadrant C |
| Plot type | Count rate plots | Images |
|---|---|---|
| Comparison with Poisson distribution Blue bars denote a histogram of data divided into 1 sec bins. Red curve is a Poisson curve with rate = median count rate of data. |
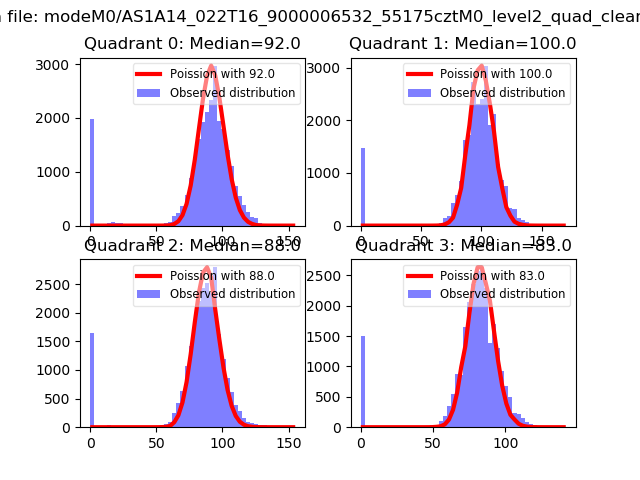 |
 |
| Quadrant-wise count rates Data is divided into 100 sec bins |
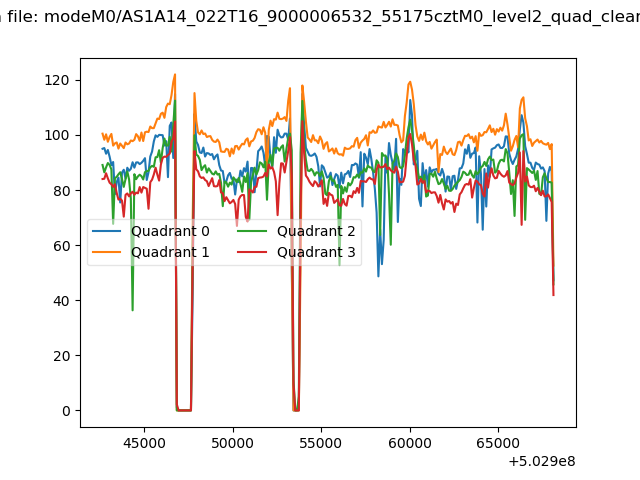 |
|
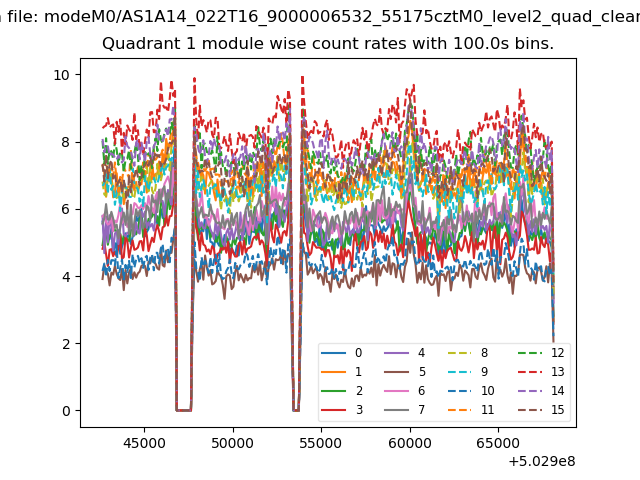
| Module-wise count rates for Quadrant A Data is divided into 100 sec bins |
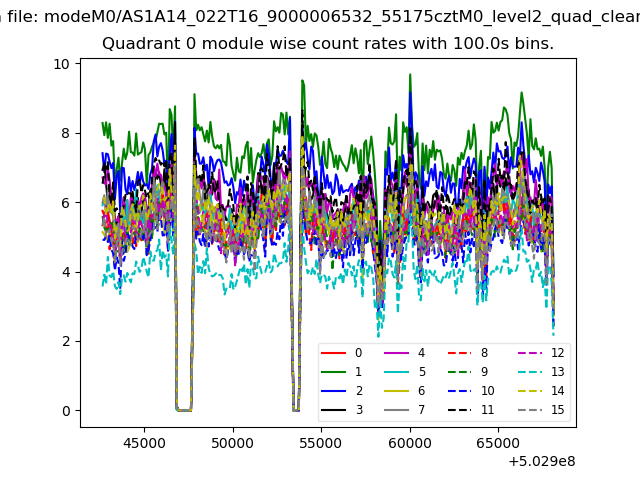 |
 |
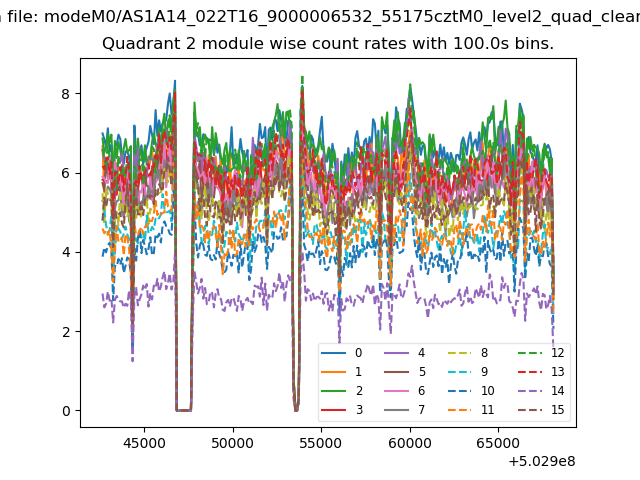
| Module-wise count rates for Quadrant B Data is divided into 100 sec bins |
 |
 |
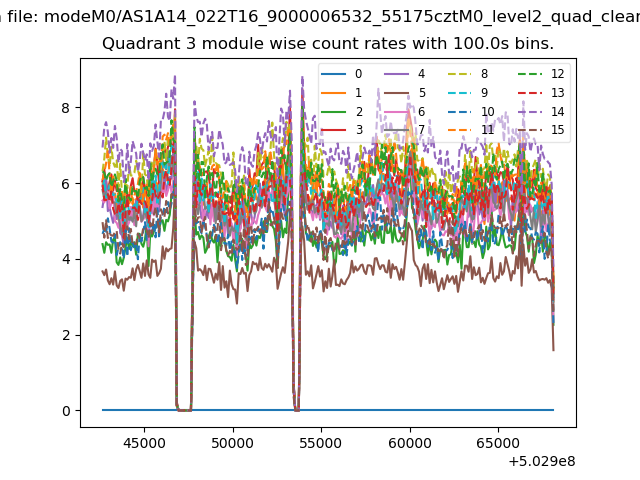
| Module-wise count rates for Quadrant C Data is divided into 100 sec bins |
 |
 |
| Module-wise count rates for Quadrant D Data is divided into 100 sec bins |
 |
 |
| Parameter | Plot |
|---|---|
| CZT HV Monitor | 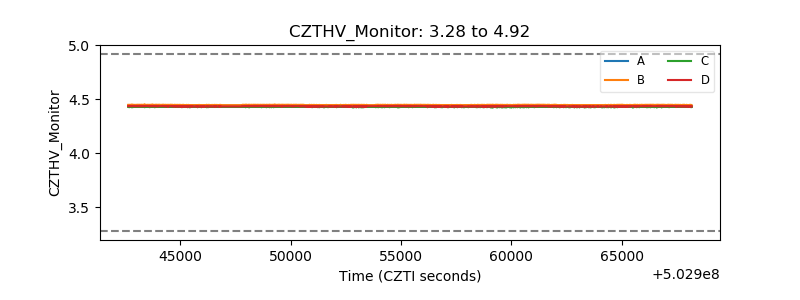 |
| D_VDD | 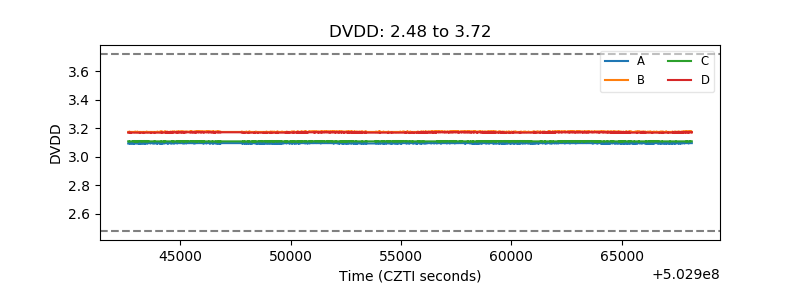 |
| Temperature 1 | 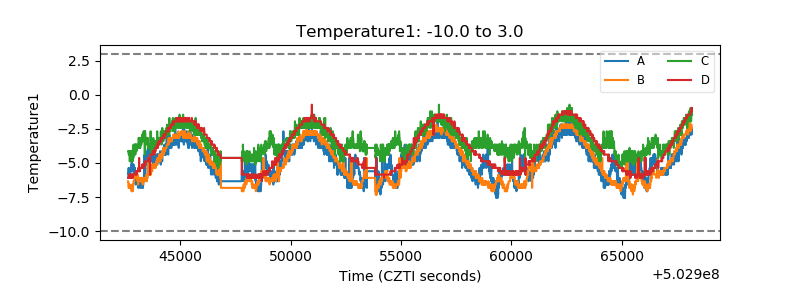 |
| Veto HV Monitor | 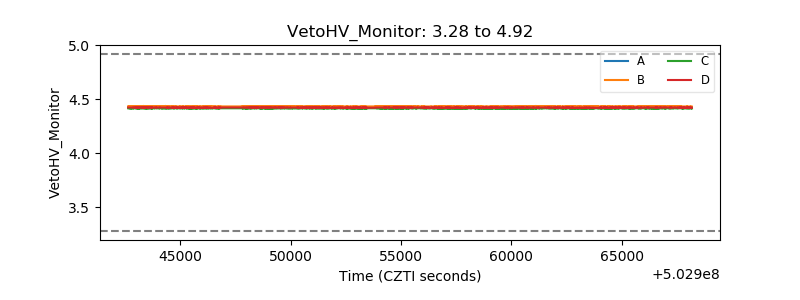 |
| Veto LLD | 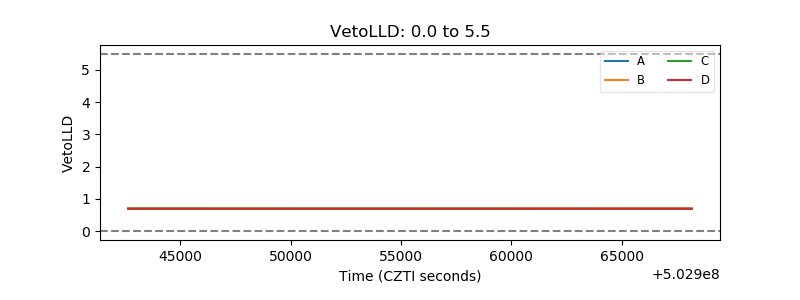 |
| Alpha Counter | 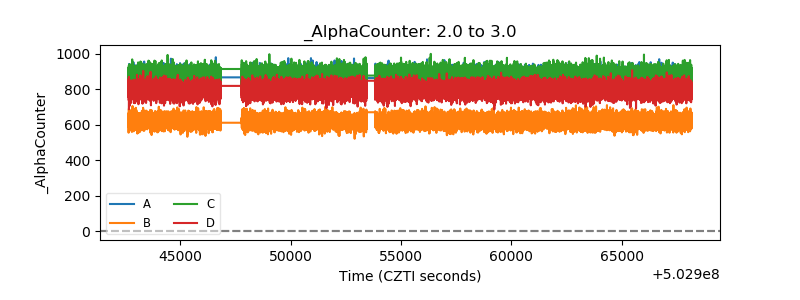 |
| _CPM_Rate | 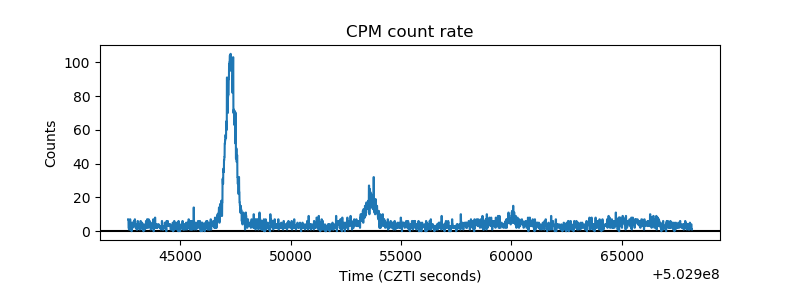 |
| CZT Counter | 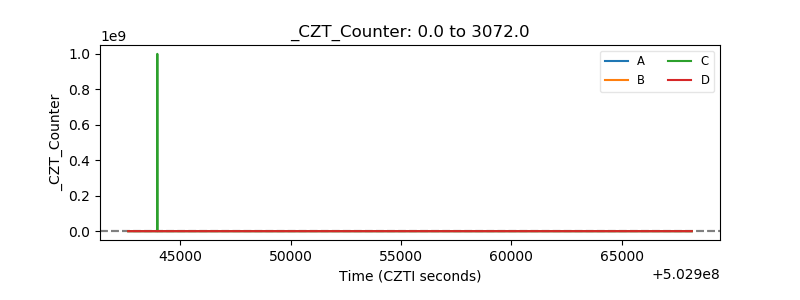 |
| +2.5 Volts monitor |  |
| +5 Volts monitor |  |
| _ROLL_ROT | 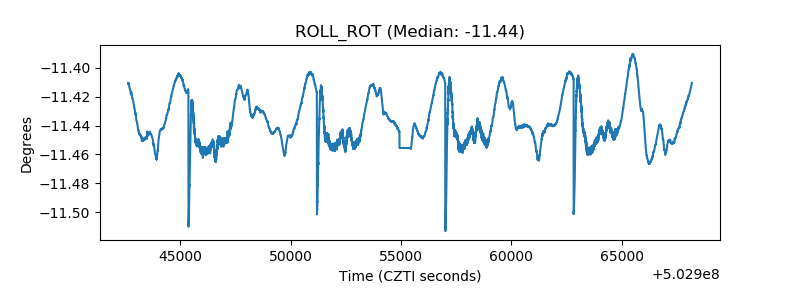 |
| _Roll_DEC | 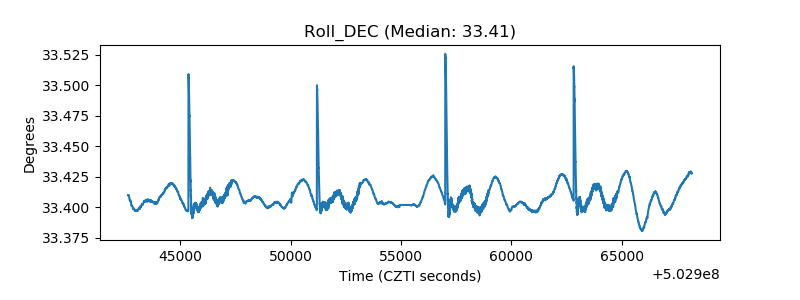 |
| _Roll_RA | 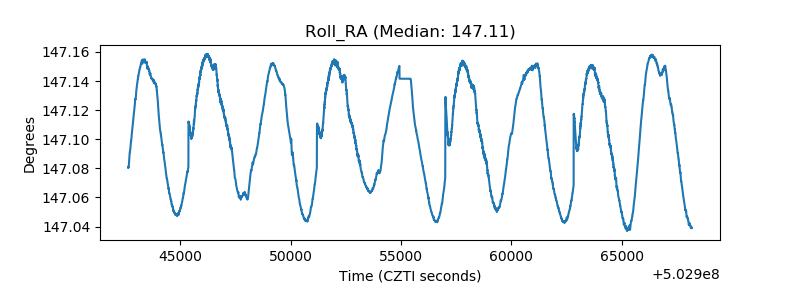 |
| Veto Counter | 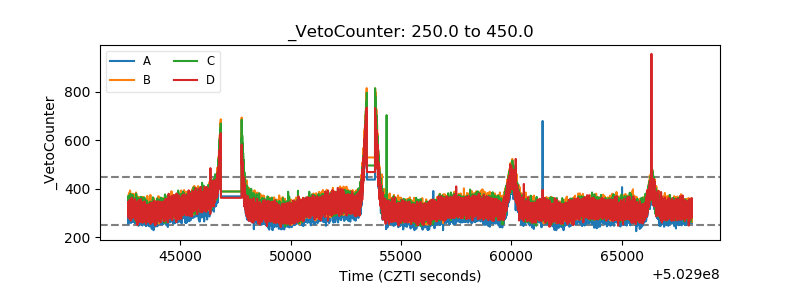 |