| Param | Original file | Final file |
|---|---|---|
| Filename | modeM0/AS1A14_022T16_9000006532_55179cztM0_level2.fits | modeM0/AS1A14_022T16_9000006532_55179cztM0_level2_quad_clean.evt |
| Size (bytes) | 1,833,344,640 | 343,880,640 |
| Size | 1.7 GB | 328.0 MB |
| Events in quadrant A | 21,474,499 | 2,132,255 |
| Events in quadrant B | 12,099,748 | 2,453,808 |
| Events in quadrant C | 15,070,751 | 2,107,372 |
| Events in quadrant D | 17,275,093 | 1,988,738 |
| Mode SS | |||
|---|---|---|---|
| Quadrant | BADHDUFLAG | Total packets | Discarded packets |
| A | 0 | 508 | 0 |
| B | 0 | 508 | 0 |
| C | 0 | 508 | 0 |
| D | 0 | 508 | 0 |
| Mode M0 | |||
|---|---|---|---|
| Quadrant | BADHDUFLAG | Total packets | Discarded packets |
| A | 0 | 81267 | 4 |
| B | 0 | 55313 | 4 |
| C | 0 | 62584 | 4 |
| D | 0 | 69650 | 8 |
| Mode M9 | |||
|---|---|---|---|
| Quadrant | BADHDUFLAG | Total packets | Discarded packets |
| A | 0 | 15 | 0 |
| B | 0 | 15 | 0 |
| C | 0 | 15 | 0 |
| D | 0 | 15 | 0 |
| Quadrant | Total seconds | Saturated seconds | Saturation percentage |
|---|---|---|---|
| A | 25137 | 2833 | 11.270239% |
| B | 25138 | 701 | 2.788607% |
| C | 25138 | 1288 | 5.123717% |
| D | 25135 | 1666 | 6.628208% |
Noise dominated data is calculated using 1-second bins in cleaned event files. If a bin has >2000 counts, and if more than 50% of those come from <1% of pixels, then it is considered to be noise-dominated and hence unusable.
| Quadrant | # 1 sec bins | Bins with >0 counts | Bins with >2000 counts | High rate bins dominated by noise | Noise dominated (total time) | Noise dominated (detector-on time) | Marked lightcurve |
|---|---|---|---|---|---|---|---|
| A | 26582 | 25143 | 2147 | 2147 | 8.08% | 8.54% | 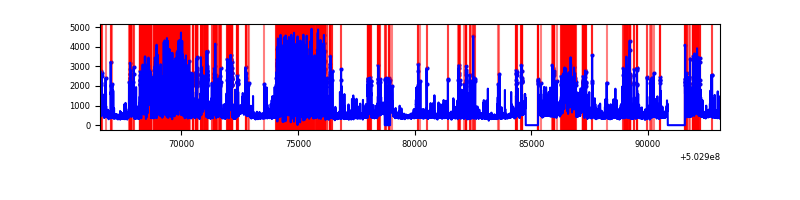 |
| B | 26583 | 25144 | 246 | 246 | 0.93% | 0.98% | 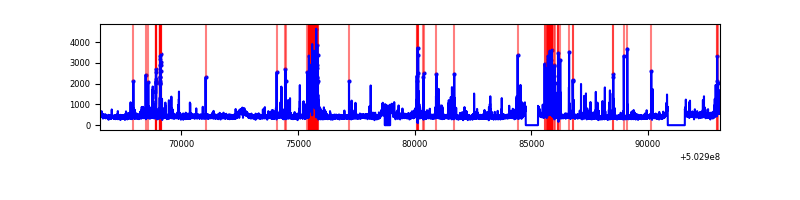 |
| C | 26583 | 25144 | 918 | 918 | 3.45% | 3.65% | 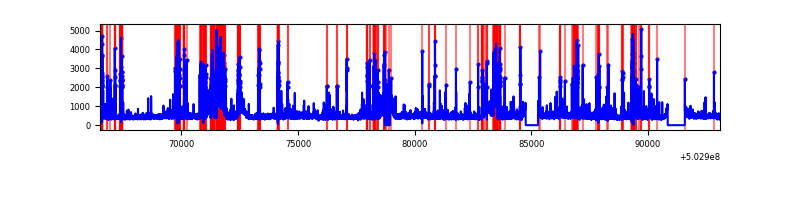 |
| D | 26582 | 25142 | 1193 | 1193 | 4.49% | 4.75% | 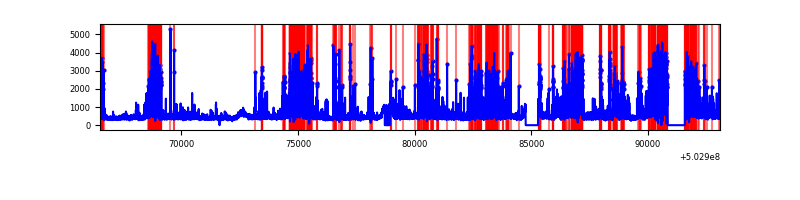 |
Top three noisy pixels from each quadrant. If the there are fewer than three noisy pixels in the level2.evt file, extra rows are filled as -1
| Pixel properties | Quadrant properties | ||||||
|---|---|---|---|---|---|---|---|
| Quadrant | DetID | PixID | Counts | Sigma | Mean | Median | Sigma |
| A | 3 | 78 | 4887165 | 7771.91 | 2564 | 2503 | 628.5 |
| A | 3 | 45 | 4312595 | 6857.72 | 2564 | 2503 | 628.5 |
| A | 12 | 115 | 1340952 | 2129.58 | 2564 | 2503 | 628.5 |
| B | 2 | 249 | 742655 | 1313.36 | 2628 | 2520 | 563.5 |
| B | 5 | 185 | 435334 | 768.02 | 2628 | 2520 | 563.5 |
| B | 10 | 247 | 405700 | 715.44 | 2628 | 2520 | 563.5 |
| C | 10 | 22 | 2923464 | 4224.69 | 2542 | 2514 | 691.4 |
| C | 1 | 16 | 681758 | 982.42 | 2542 | 2514 | 691.4 |
| C | 14 | 254 | 376105 | 540.34 | 2542 | 2514 | 691.4 |
| D | 2 | 249 | 4486786 | 6247.65 | 2542 | 2430 | 717.8 |
| D | 11 | 129 | 1843212 | 2564.59 | 2542 | 2430 | 717.8 |
| D | 5 | 173 | 214692 | 295.72 | 2542 | 2430 | 717.8 |
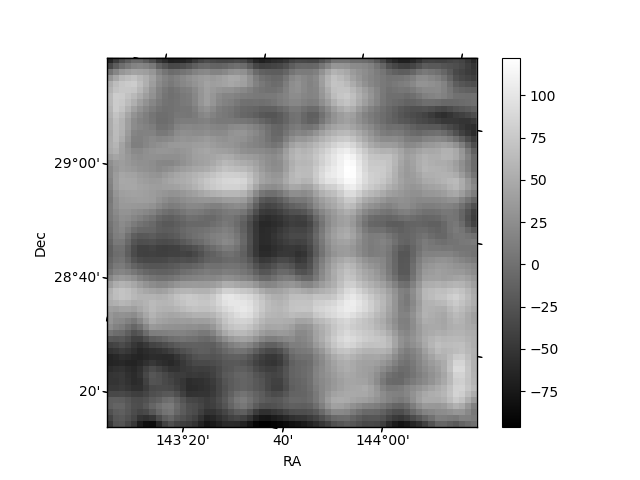
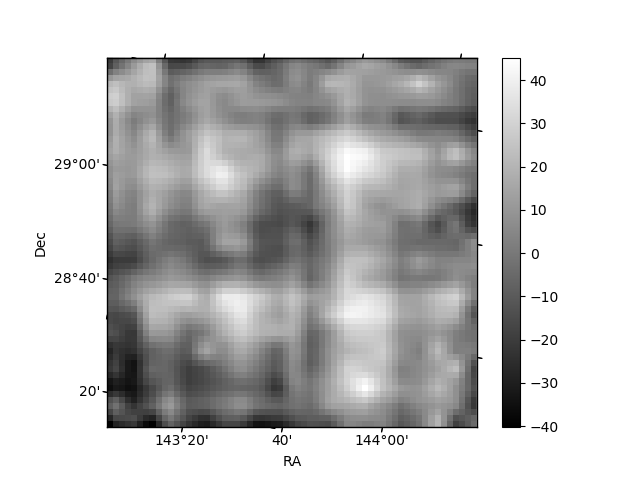
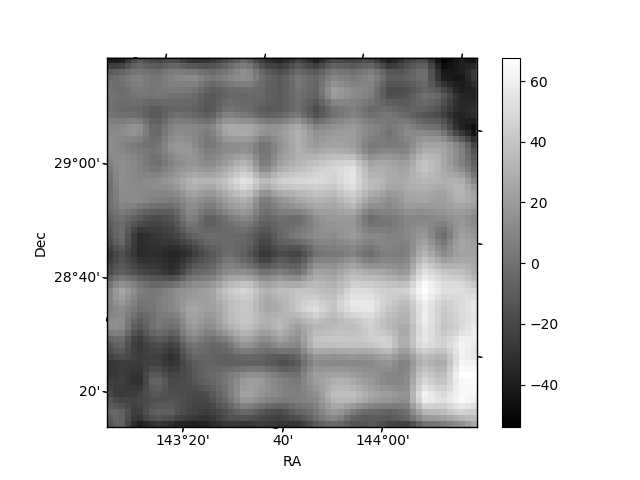
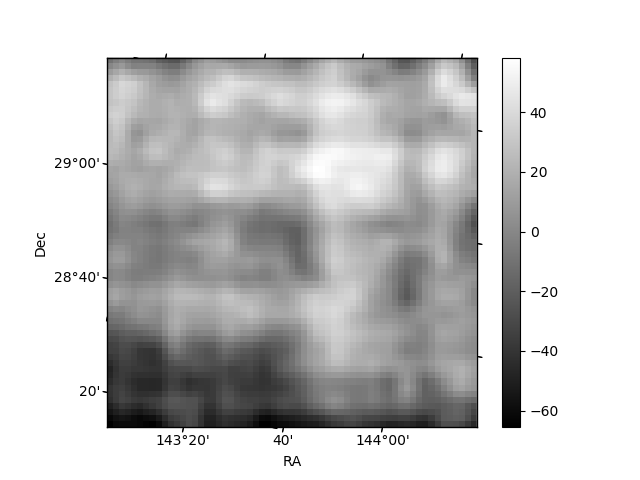
Histogram calculated using DETX and DETY for each event in the final _common_clean file
| Quadrant A | 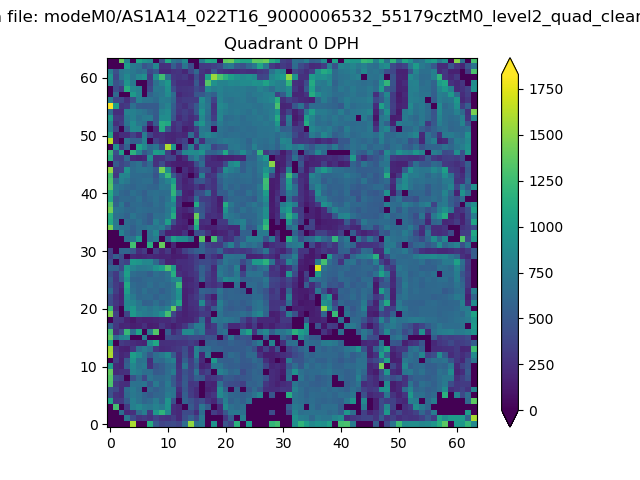 |
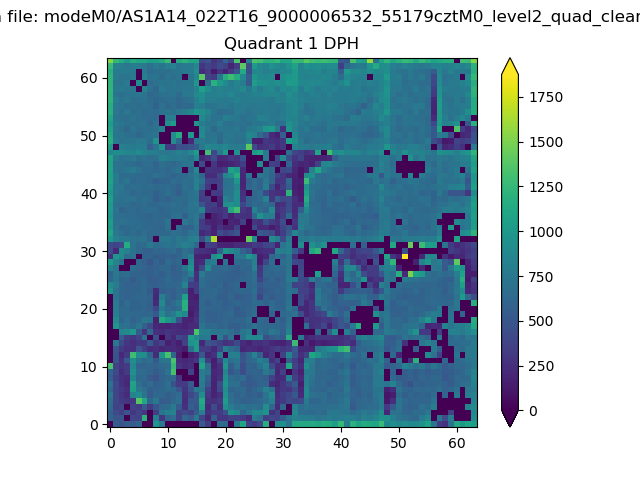 |
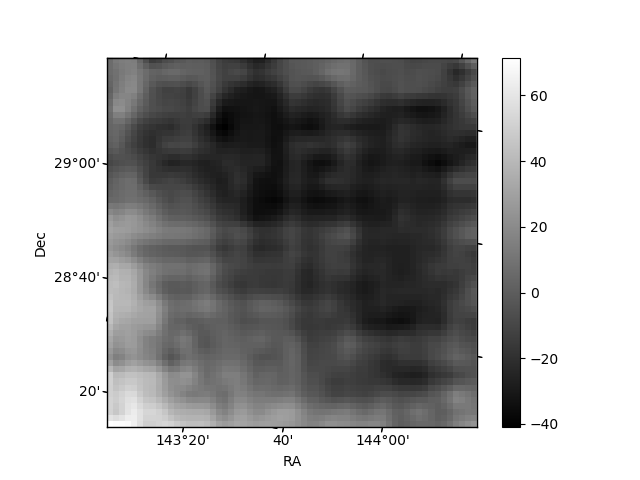
Quadrant B |
|---|---|---|---|
| Quadrant D | 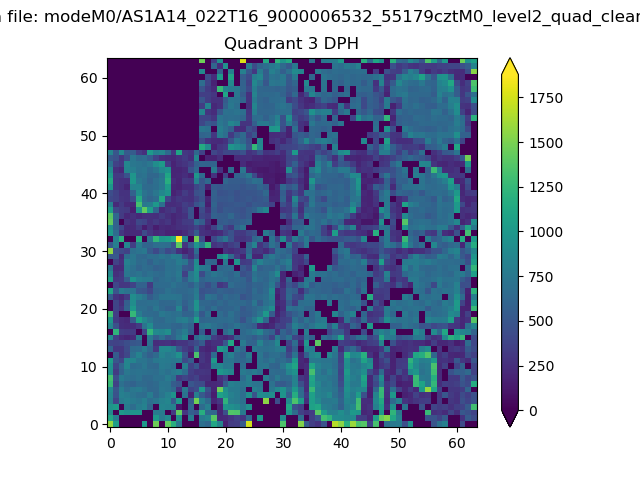 |
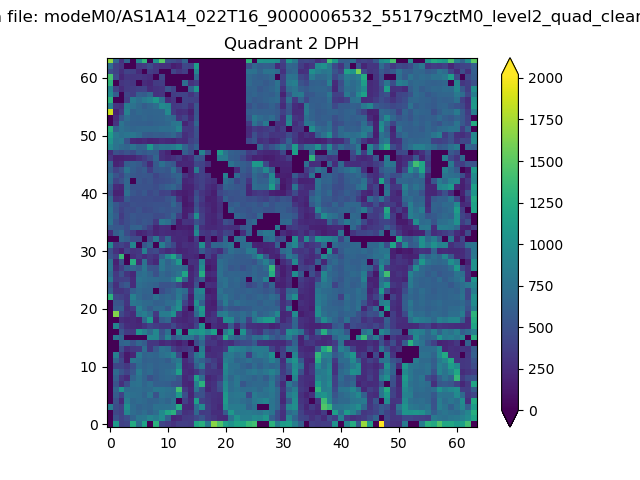 |
Quadrant C |
| Plot type | Count rate plots | Images |
|---|---|---|
| Comparison with Poisson distribution Blue bars denote a histogram of data divided into 1 sec bins. Red curve is a Poisson curve with rate = median count rate of data. |
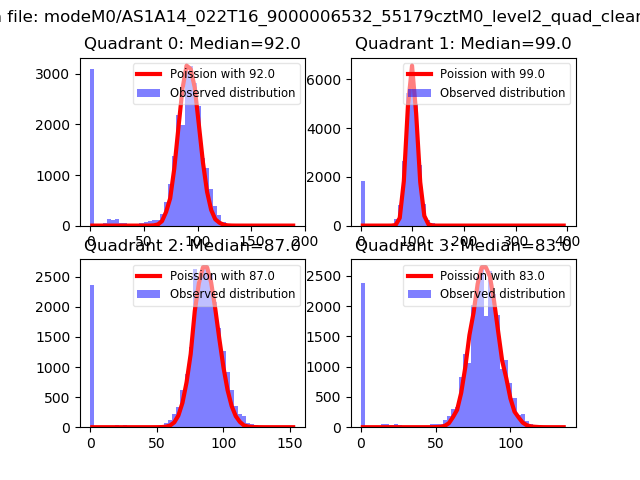 |
 |
| Quadrant-wise count rates Data is divided into 100 sec bins |
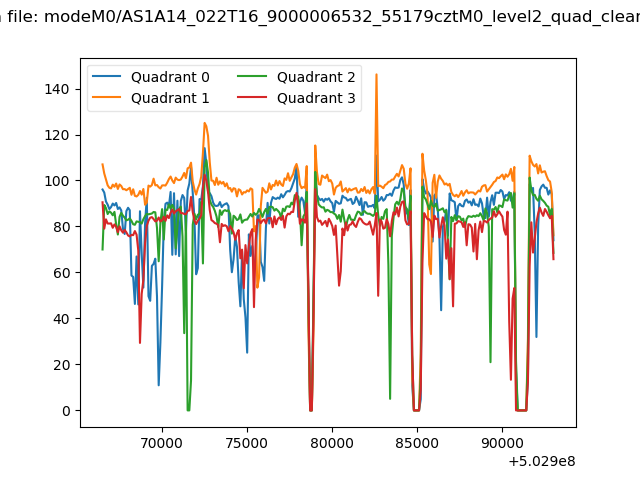 |
|
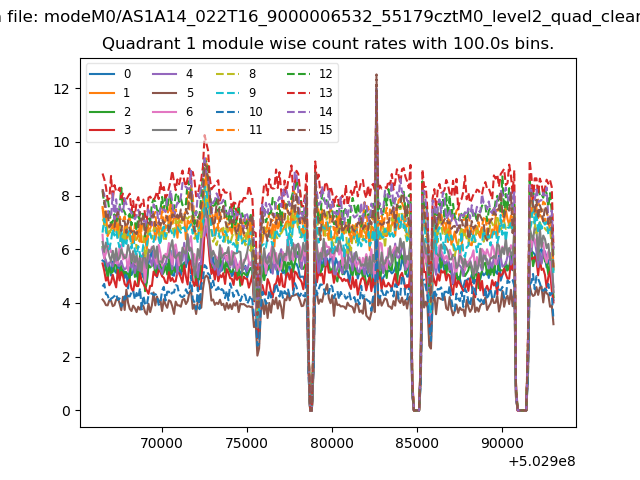
| Module-wise count rates for Quadrant A Data is divided into 100 sec bins |
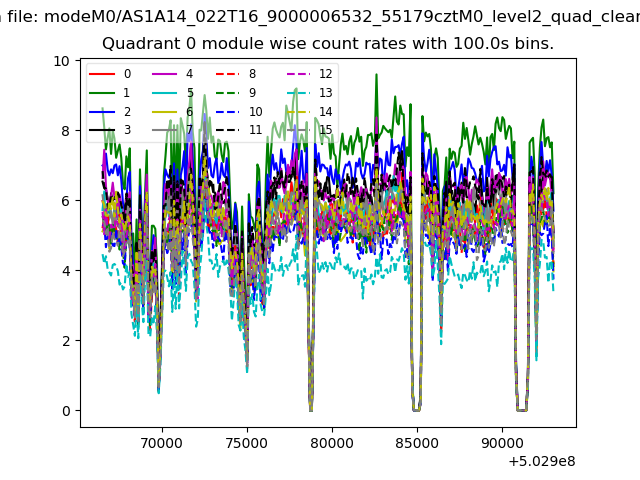 |
 |
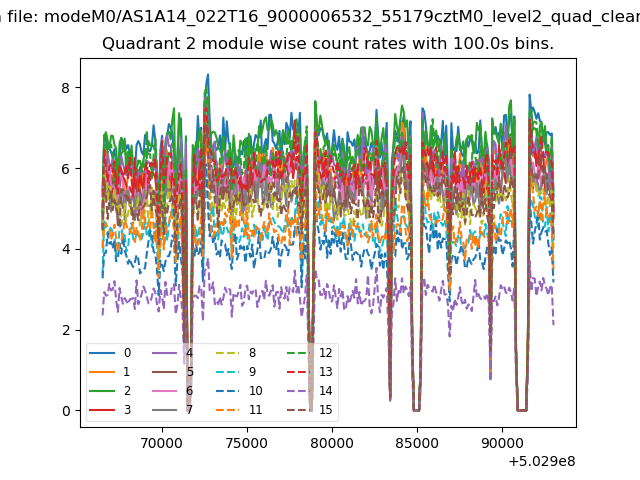
| Module-wise count rates for Quadrant B Data is divided into 100 sec bins |
 |
 |
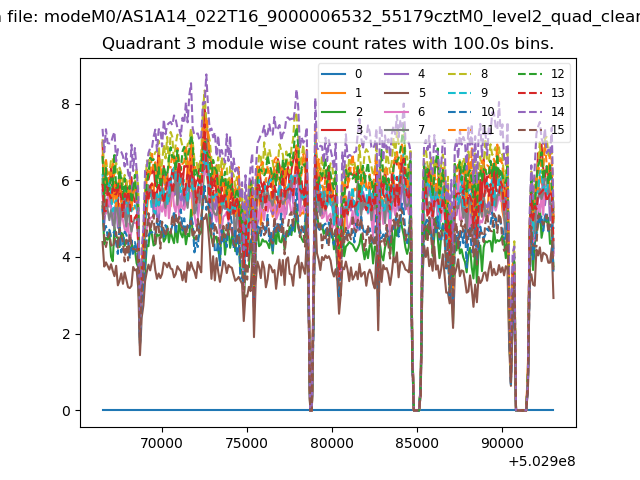
| Module-wise count rates for Quadrant C Data is divided into 100 sec bins |
 |
 |
| Module-wise count rates for Quadrant D Data is divided into 100 sec bins |
 |
 |
| Parameter | Plot |
|---|---|
| CZT HV Monitor | 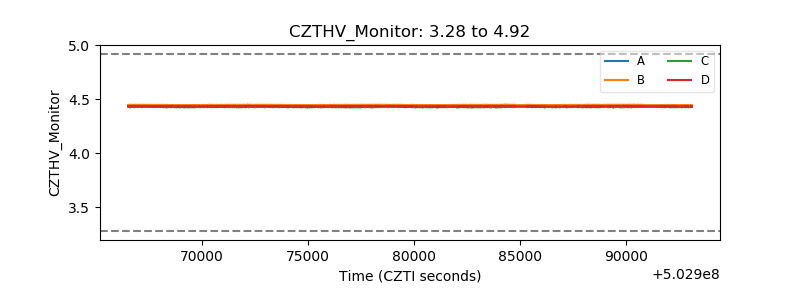 |
| D_VDD | 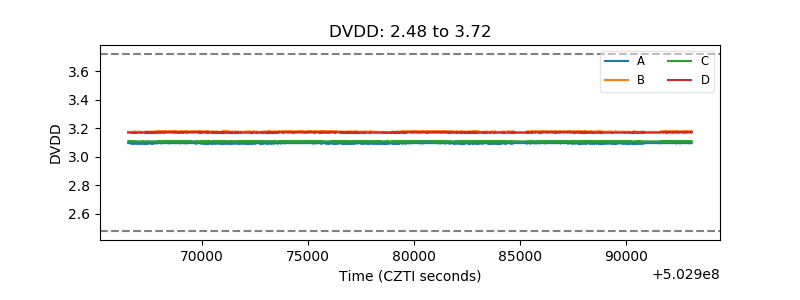 |
| Temperature 1 | 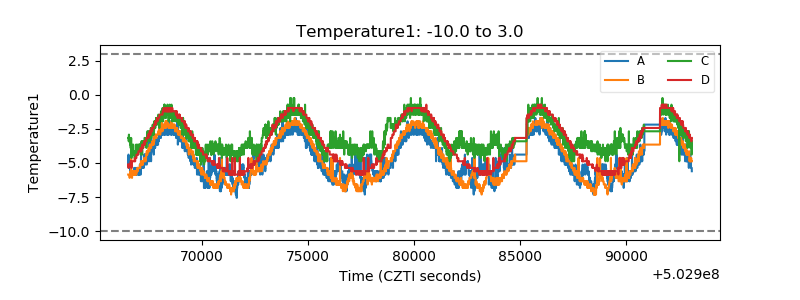 |
| Veto HV Monitor | 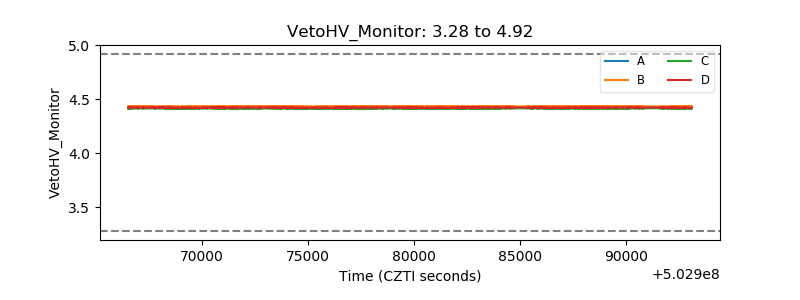 |
| Veto LLD | 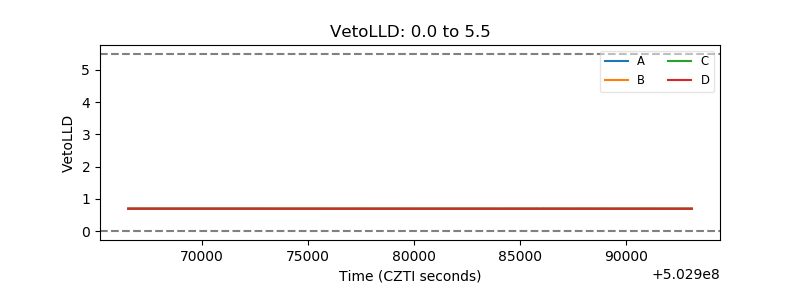 |
| Alpha Counter | 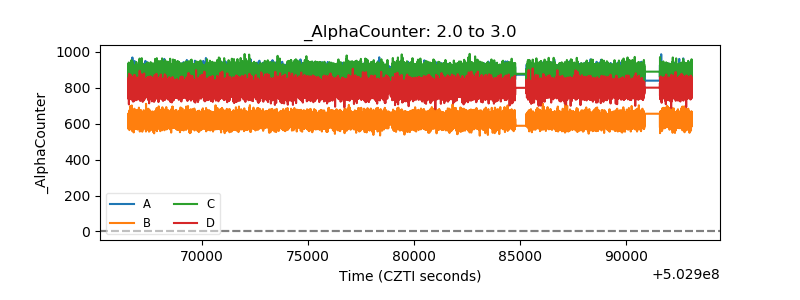 |
| _CPM_Rate | 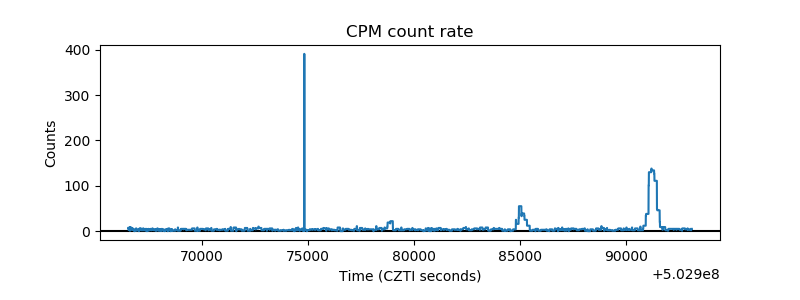 |
| CZT Counter | 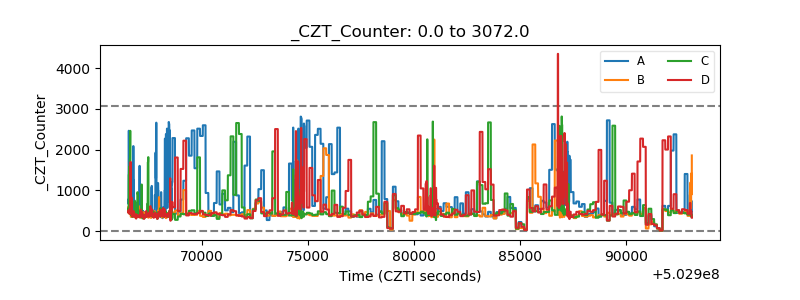 |
| +2.5 Volts monitor |  |
| +5 Volts monitor |  |
| _ROLL_ROT | 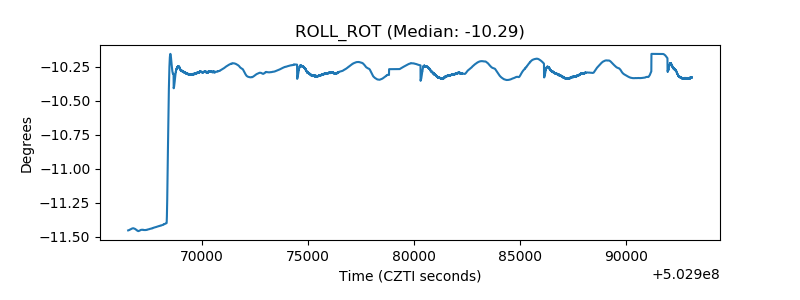 |
| _Roll_DEC | 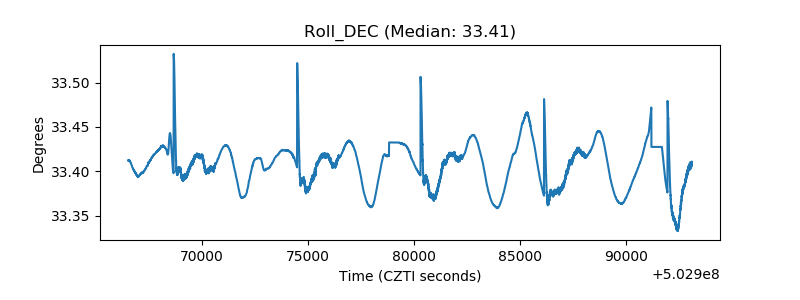 |
| _Roll_RA | 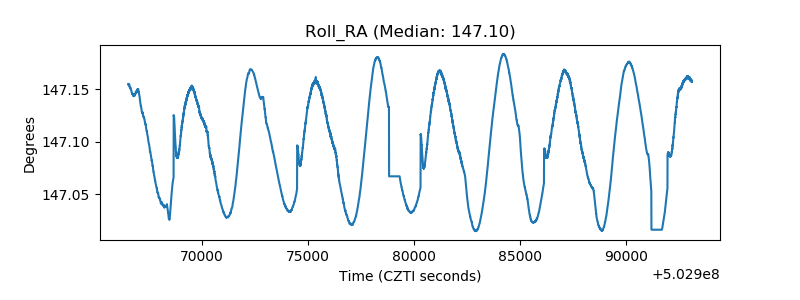 |
| Veto Counter | 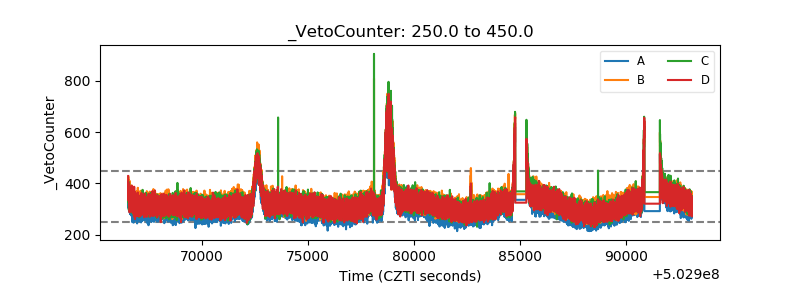 |