| Param | Original file | Final file |
|---|---|---|
| Filename | modeM0/AS1A14_022T16_9000006532_55180cztM0_level2.fits | modeM0/AS1A14_022T16_9000006532_55180cztM0_level2_quad_clean.evt |
| Size (bytes) | 438,534,720 | 94,890,240 |
| Size | 418.2 MB | 90.5 MB |
| Events in quadrant A | 4,507,436 | 607,869 |
| Events in quadrant B | 3,089,106 | 669,938 |
| Events in quadrant C | 3,771,291 | 582,696 |
| Events in quadrant D | 4,346,251 | 547,721 |
| Mode SS | |||
|---|---|---|---|
| Quadrant | BADHDUFLAG | Total packets | Discarded packets |
| A | 0 | 134 | 0 |
| B | 0 | 134 | 0 |
| C | 0 | 134 | 0 |
| D | 0 | 134 | 0 |
| Mode M0 | |||
|---|---|---|---|
| Quadrant | BADHDUFLAG | Total packets | Discarded packets |
| A | 0 | 18017 | 1 |
| B | 0 | 14255 | 1 |
| C | 0 | 15812 | 2 |
| D | 0 | 17655 | 1 |
| Mode M9 | |||
|---|---|---|---|
| Quadrant | BADHDUFLAG | Total packets | Discarded packets |
| A | 0 | 10 | 0 |
| B | 0 | 10 | 0 |
| C | 0 | 10 | 0 |
| D | 0 | 10 | 0 |
| Quadrant | Total seconds | Saturated seconds | Saturation percentage |
|---|---|---|---|
| A | 6673 | 301 | 4.510715% |
| B | 6673 | 49 | 0.734302% |
| C | 6672 | 190 | 2.847722% |
| D | 6673 | 307 | 4.600629% |
Noise dominated data is calculated using 1-second bins in cleaned event files. If a bin has >2000 counts, and if more than 50% of those come from <1% of pixels, then it is considered to be noise-dominated and hence unusable.
| Quadrant | # 1 sec bins | Bins with >0 counts | Bins with >2000 counts | High rate bins dominated by noise | Noise dominated (total time) | Noise dominated (detector-on time) | Marked lightcurve |
|---|---|---|---|---|---|---|---|
| A | 7613 | 6674 | 240 | 240 | 3.15% | 3.60% | 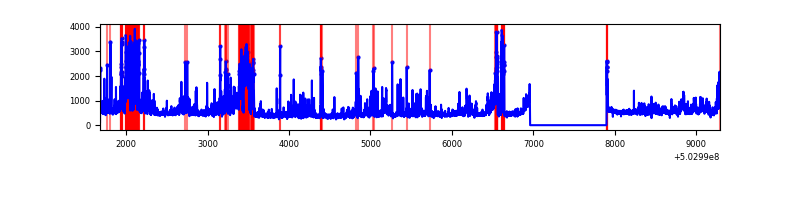 |
| B | 7613 | 6674 | 7 | 7 | 0.09% | 0.10% | 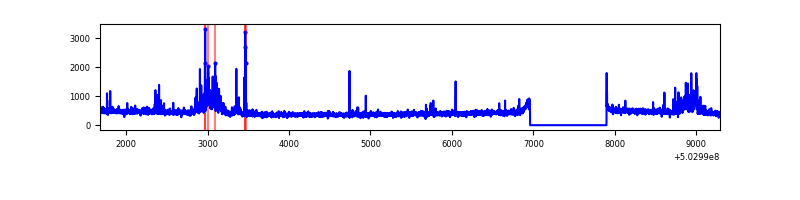 |
| C | 7612 | 6673 | 146 | 146 | 1.92% | 2.19% | 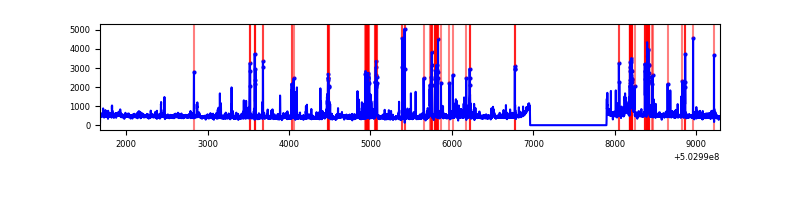 |
| D | 7613 | 6674 | 214 | 214 | 2.81% | 3.21% | 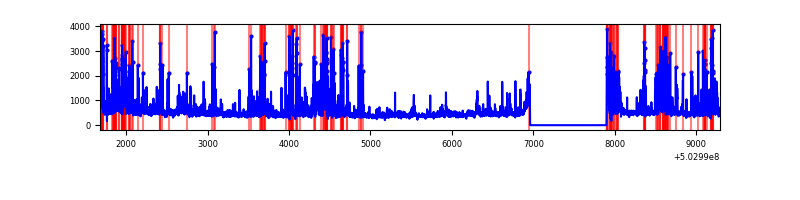 |
Top three noisy pixels from each quadrant. If the there are fewer than three noisy pixels in the level2.evt file, extra rows are filled as -1
| Pixel properties | Quadrant properties | ||||||
|---|---|---|---|---|---|---|---|
| Quadrant | DetID | PixID | Counts | Sigma | Mean | Median | Sigma |
| A | 3 | 45 | 674141 | 3887.59 | 698 | 681 | 173.2 |
| A | 3 | 78 | 449613 | 2591.49 | 698 | 681 | 173.2 |
| A | 12 | 115 | 232741 | 1339.58 | 698 | 681 | 173.2 |
| B | 2 | 249 | 248871 | 1633.79 | 701 | 673 | 151.9 |
| B | 10 | 247 | 29318 | 188.56 | 701 | 673 | 151.9 |
| B | 5 | 185 | 21835 | 139.3 | 701 | 673 | 151.9 |
| C | 10 | 22 | 428291 | 2267.04 | 684 | 679 | 188.6 |
| C | 1 | 16 | 205561 | 1086.21 | 684 | 679 | 188.6 |
| C | 7 | 2 | 186159 | 983.34 | 684 | 679 | 188.6 |
| D | 2 | 249 | 1139343 | 5948.5 | 678 | 647 | 191.4 |
| D | 11 | 129 | 366520 | 1911.31 | 678 | 647 | 191.4 |
| D | 5 | 173 | 55827 | 288.26 | 678 | 647 | 191.4 |
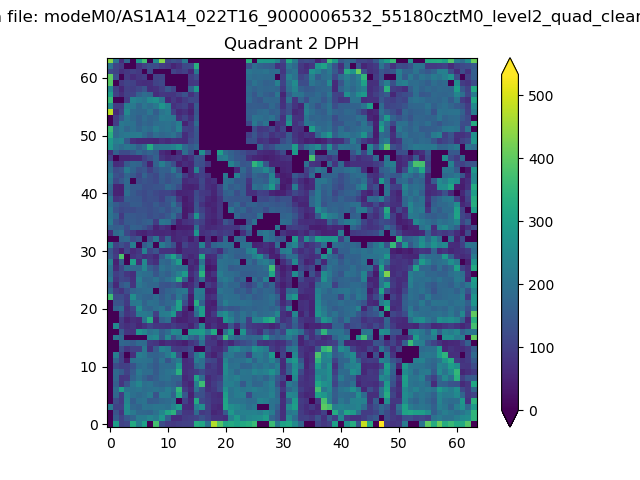
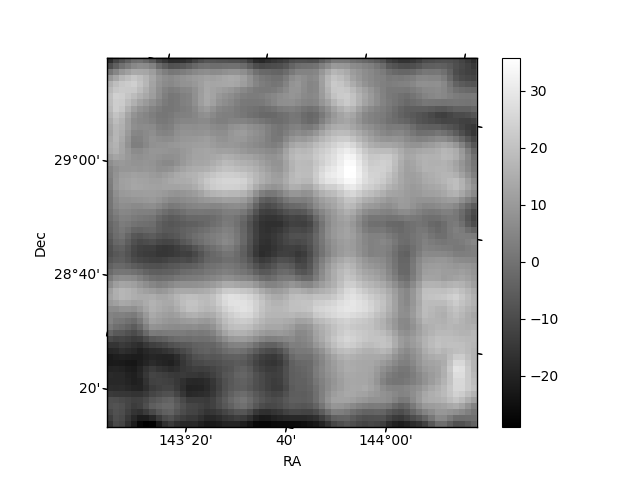
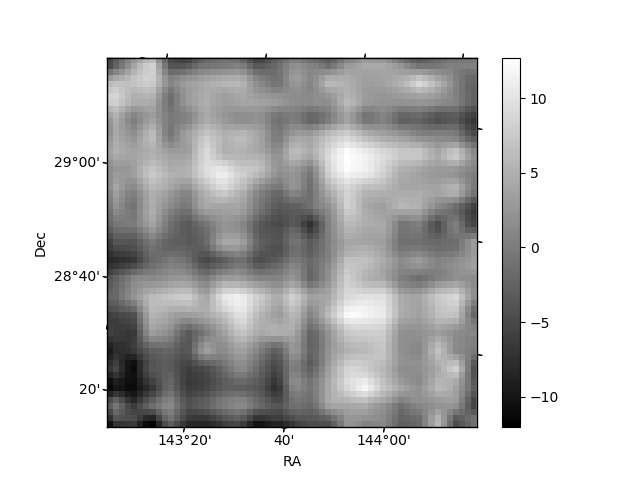
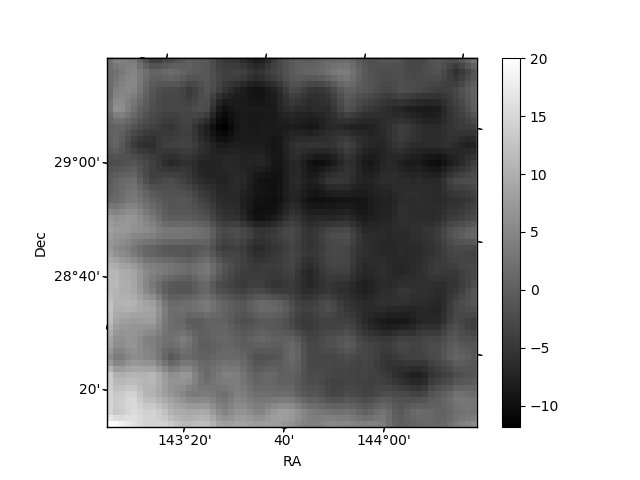
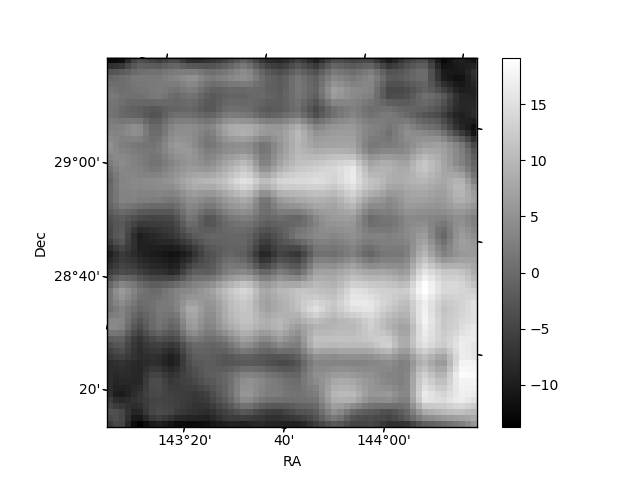
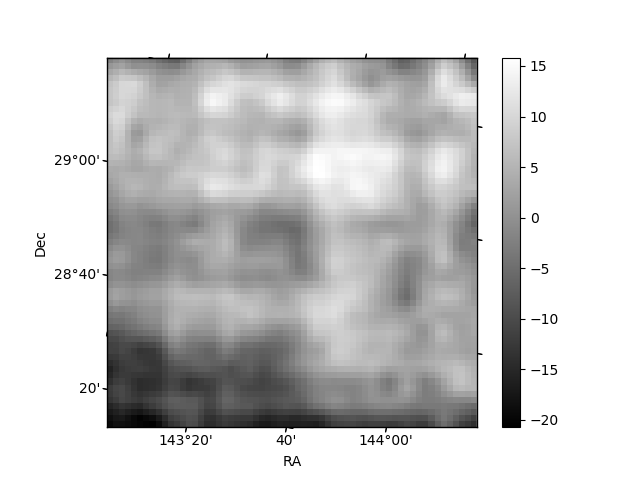
Histogram calculated using DETX and DETY for each event in the final _common_clean file
| Quadrant A | 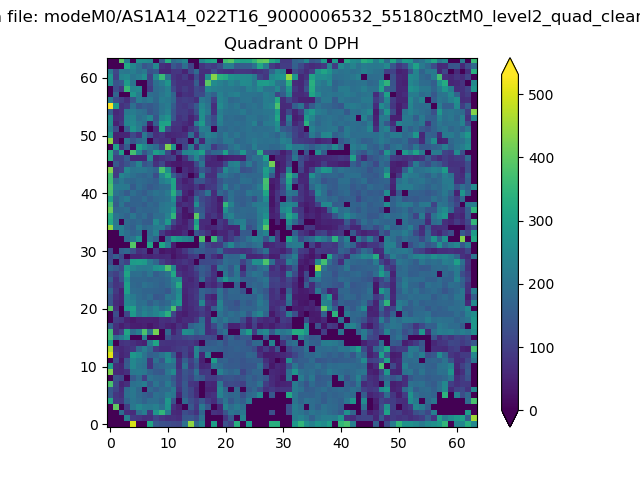 |
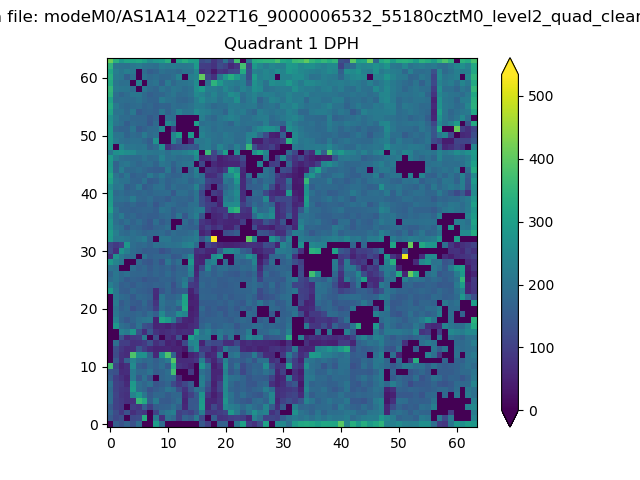 |
Quadrant B |
|---|---|---|---|
| Quadrant D | 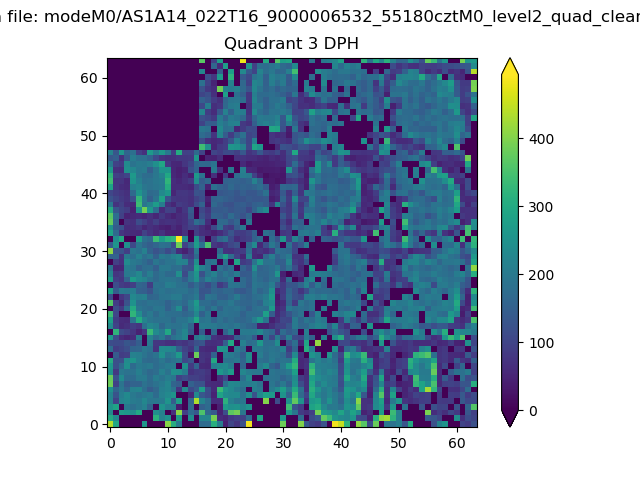 |
 |
Quadrant C |
| Plot type | Count rate plots | Images |
|---|---|---|
| Comparison with Poisson distribution Blue bars denote a histogram of data divided into 1 sec bins. Red curve is a Poisson curve with rate = median count rate of data. |
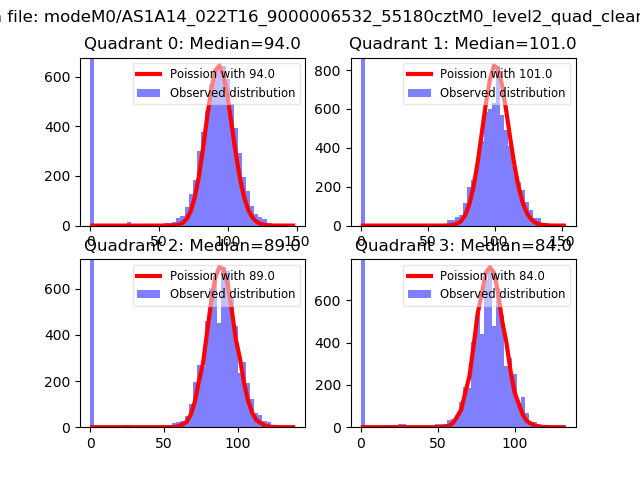 |
 |
| Quadrant-wise count rates Data is divided into 100 sec bins |
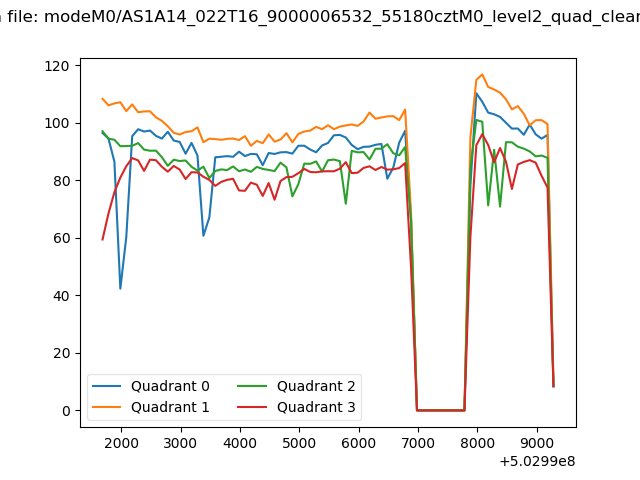 |
|
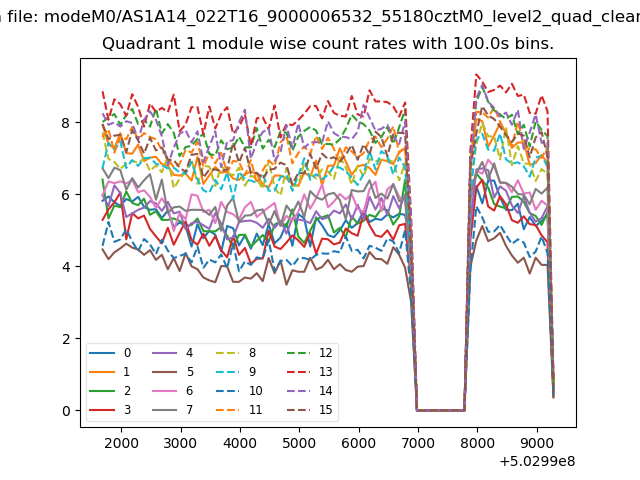
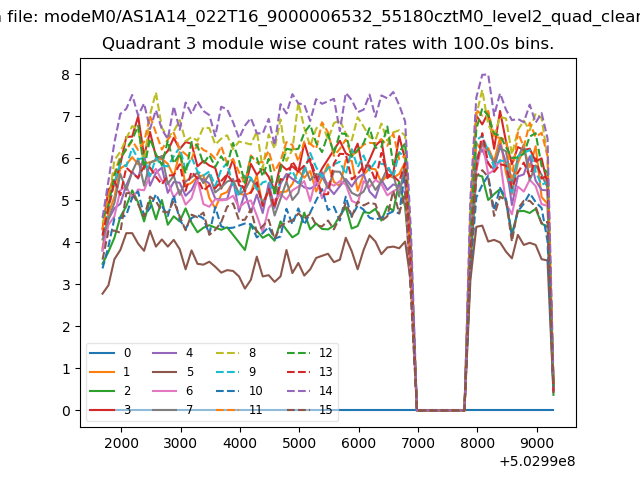
| Module-wise count rates for Quadrant A Data is divided into 100 sec bins |
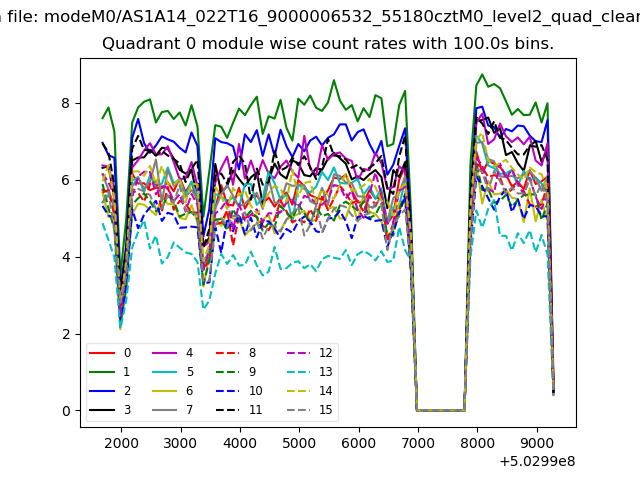 |
 |
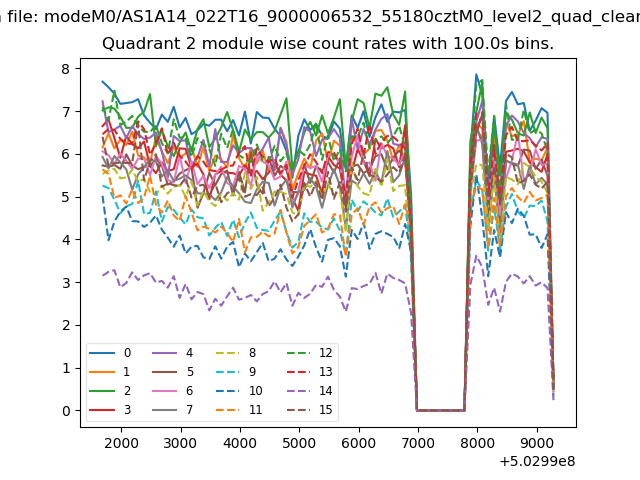
| Module-wise count rates for Quadrant B Data is divided into 100 sec bins |
 |
 |
| Module-wise count rates for Quadrant C Data is divided into 100 sec bins |
 |
 |
| Module-wise count rates for Quadrant D Data is divided into 100 sec bins |
 |
 |
| Parameter | Plot |
|---|---|
| CZT HV Monitor | 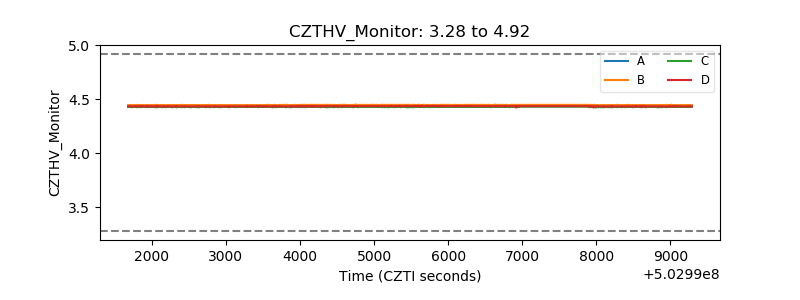 |
| D_VDD | 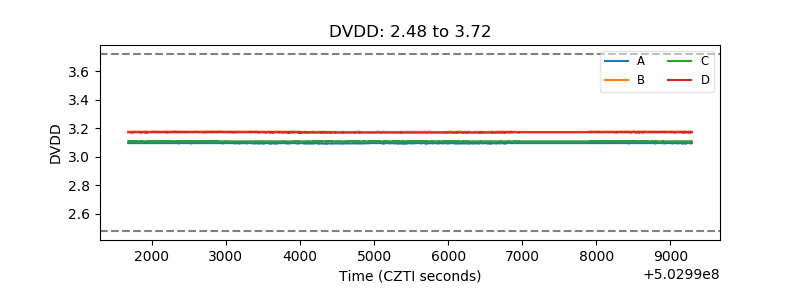 |
| Temperature 1 | 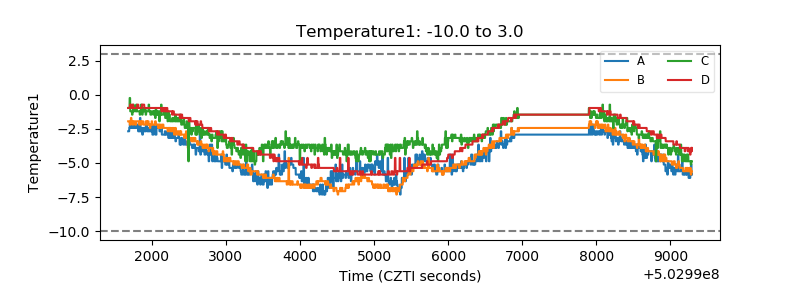 |
| Veto HV Monitor | 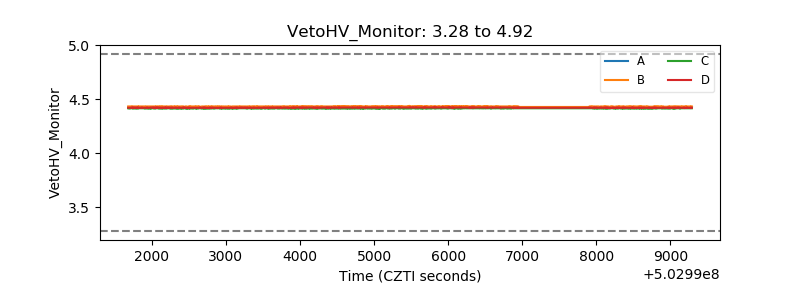 |
| Veto LLD | 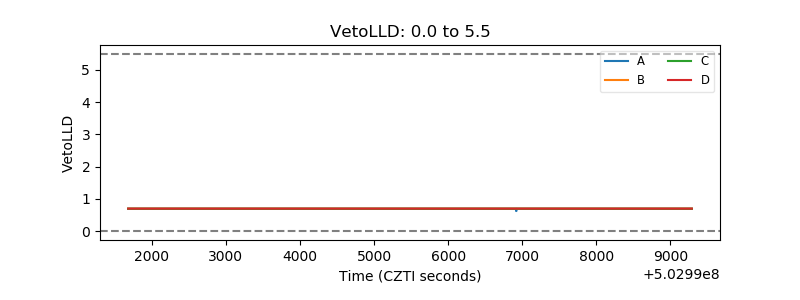 |
| Alpha Counter | 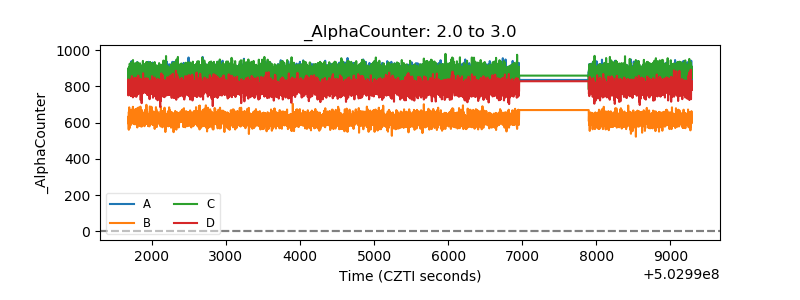 |
| _CPM_Rate | 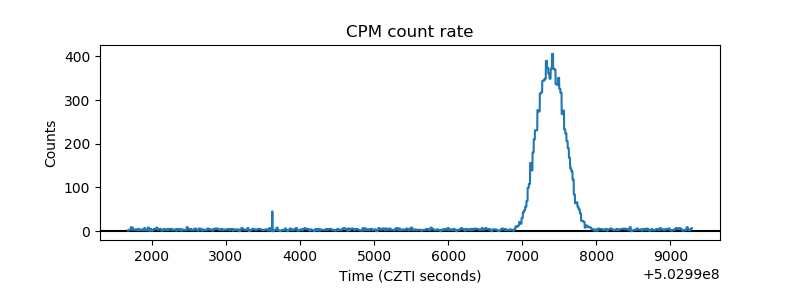 |
| CZT Counter | 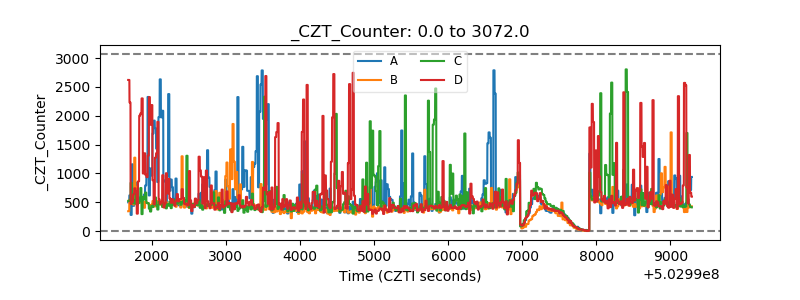 |
| +2.5 Volts monitor | 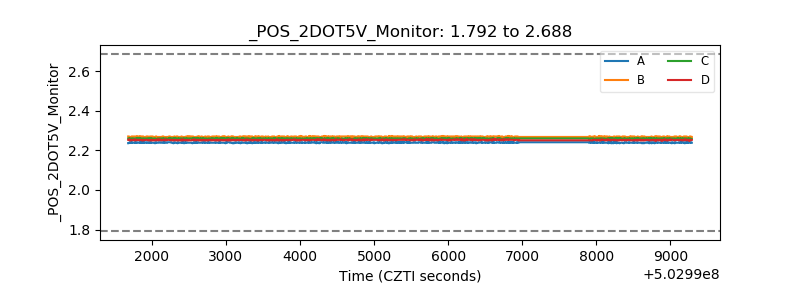 |
| +5 Volts monitor | 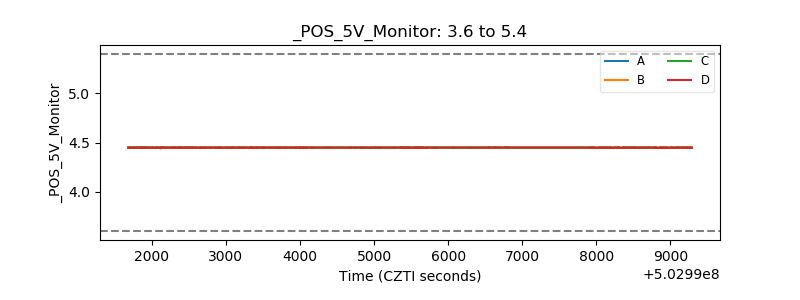 |
| _ROLL_ROT | 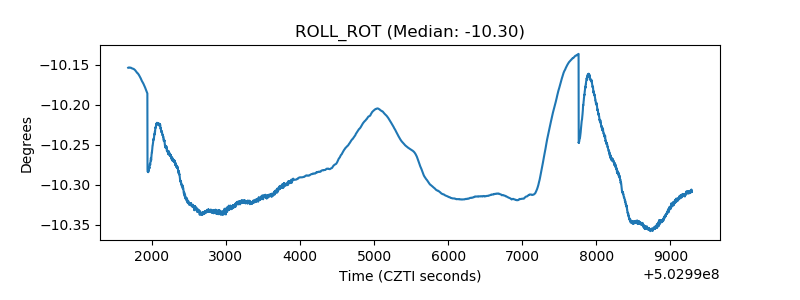 |
| _Roll_DEC | 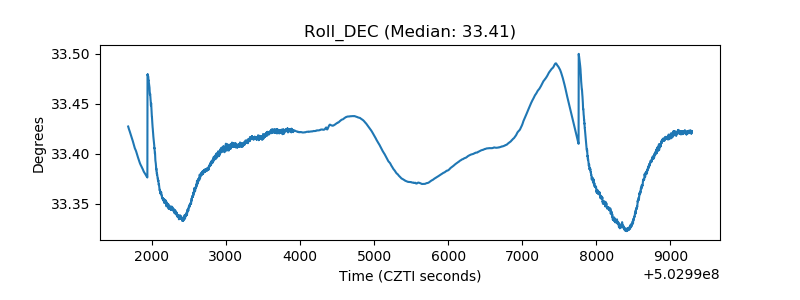 |
| _Roll_RA | 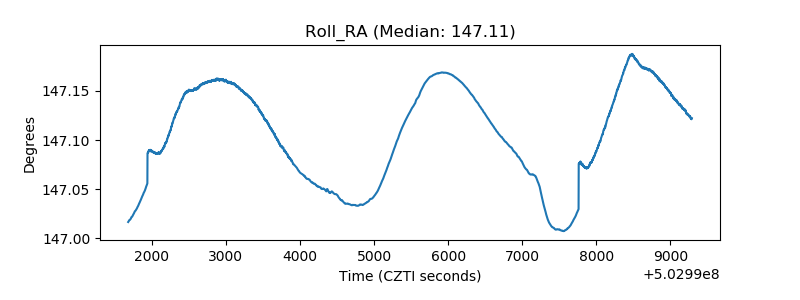 |
| Veto Counter | 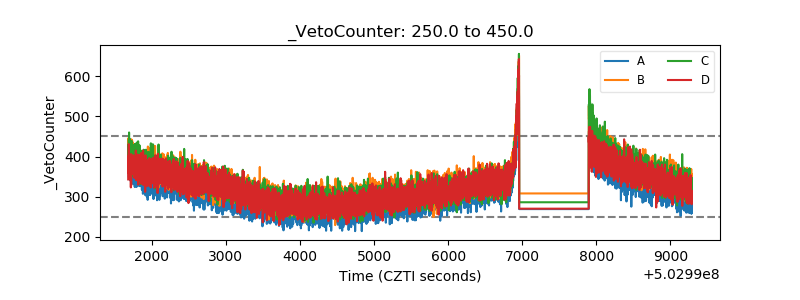 |