| Param | Original file | Final file |
|---|---|---|
| Filename | modeM0/AS1A14_022T16_9000006532_55182cztM0_level2.fits | modeM0/AS1A14_022T16_9000006532_55182cztM0_level2_quad_clean.evt |
| Size (bytes) | 431,838,720 | 95,307,840 |
| Size | 411.8 MB | 90.9 MB |
| Events in quadrant A | 3,791,917 | 629,810 |
| Events in quadrant B | 3,072,028 | 675,079 |
| Events in quadrant C | 3,742,373 | 585,336 |
| Events in quadrant D | 4,865,214 | 535,615 |
| Mode SS | |||
|---|---|---|---|
| Quadrant | BADHDUFLAG | Total packets | Discarded packets |
| A | 0 | 134 | 0 |
| B | 0 | 134 | 0 |
| C | 0 | 134 | 0 |
| D | 0 | 134 | 0 |
| Mode M0 | |||
|---|---|---|---|
| Quadrant | BADHDUFLAG | Total packets | Discarded packets |
| A | 0 | 15862 | 2 |
| B | 0 | 14118 | 2 |
| C | 0 | 15805 | 2 |
| D | 0 | 19292 | 2 |
| Mode M9 | |||
|---|---|---|---|
| Quadrant | BADHDUFLAG | Total packets | Discarded packets |
| A | 0 | 20 | 0 |
| B | 0 | 20 | 0 |
| C | 0 | 20 | 0 |
| D | 0 | 20 | 0 |
| Quadrant | Total seconds | Saturated seconds | Saturation percentage |
|---|---|---|---|
| A | 6603 | 122 | 1.847645% |
| B | 6603 | 82 | 1.241860% |
| C | 6604 | 225 | 3.407026% |
| D | 6604 | 539 | 8.161720% |
Noise dominated data is calculated using 1-second bins in cleaned event files. If a bin has >2000 counts, and if more than 50% of those come from <1% of pixels, then it is considered to be noise-dominated and hence unusable.
| Quadrant | # 1 sec bins | Bins with >0 counts | Bins with >2000 counts | High rate bins dominated by noise | Noise dominated (total time) | Noise dominated (detector-on time) | Marked lightcurve |
|---|---|---|---|---|---|---|---|
| A | 8573 | 6605 | 65 | 65 | 0.76% | 0.98% | 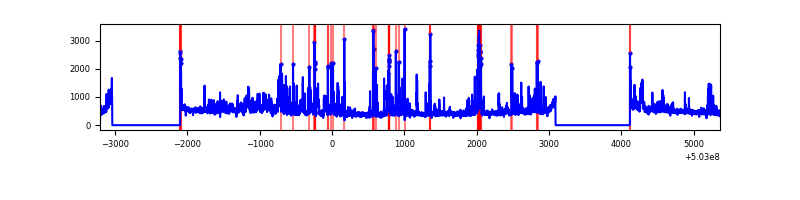 |
| B | 8573 | 6605 | 10 | 10 | 0.12% | 0.15% | 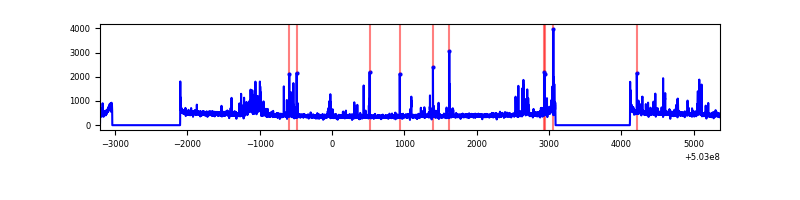 |
| C | 8574 | 6606 | 147 | 147 | 1.71% | 2.23% | 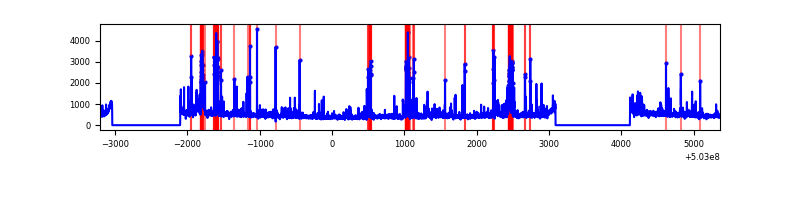 |
| D | 8574 | 6606 | 390 | 390 | 4.55% | 5.90% | 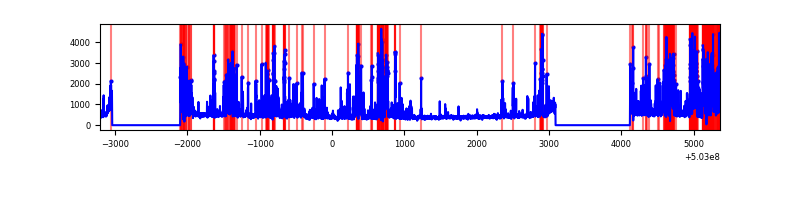 |
Top three noisy pixels from each quadrant. If the there are fewer than three noisy pixels in the level2.evt file, extra rows are filled as -1
| Pixel properties | Quadrant properties | ||||||
|---|---|---|---|---|---|---|---|
| Quadrant | DetID | PixID | Counts | Sigma | Mean | Median | Sigma |
| A | 3 | 78 | 494676 | 2804.7 | 711 | 691 | 176.1 |
| A | 12 | 115 | 156879 | 886.79 | 711 | 691 | 176.1 |
| A | 4 | 249 | 141159 | 797.53 | 711 | 691 | 176.1 |
| B | 10 | 247 | 114896 | 752.57 | 705 | 679 | 151.8 |
| B | 2 | 249 | 112935 | 739.64 | 705 | 679 | 151.8 |
| B | 5 | 185 | 34749 | 224.48 | 705 | 679 | 151.8 |
| C | 10 | 22 | 541359 | 2875.22 | 689 | 685 | 188.0 |
| C | 1 | 16 | 191798 | 1016.31 | 689 | 685 | 188.0 |
| C | 12 | 249 | 88878 | 469.0 | 689 | 685 | 188.0 |
| D | 2 | 249 | 1808814 | 9483.95 | 674 | 645 | 190.7 |
| D | 6 | 239 | 104261 | 543.47 | 674 | 645 | 190.7 |
| D | 3 | 12 | 98276 | 512.08 | 674 | 645 | 190.7 |
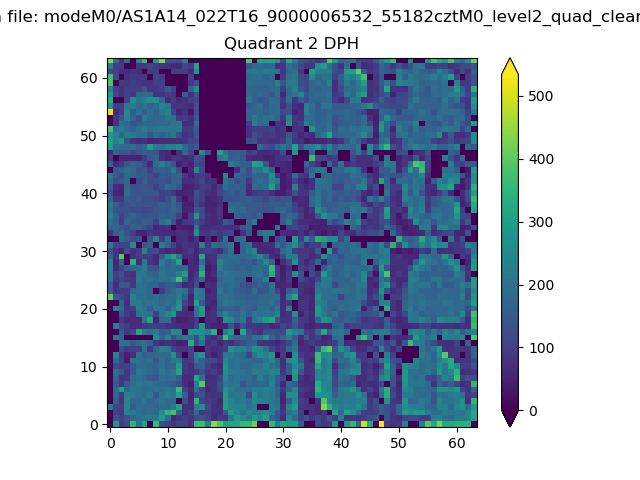
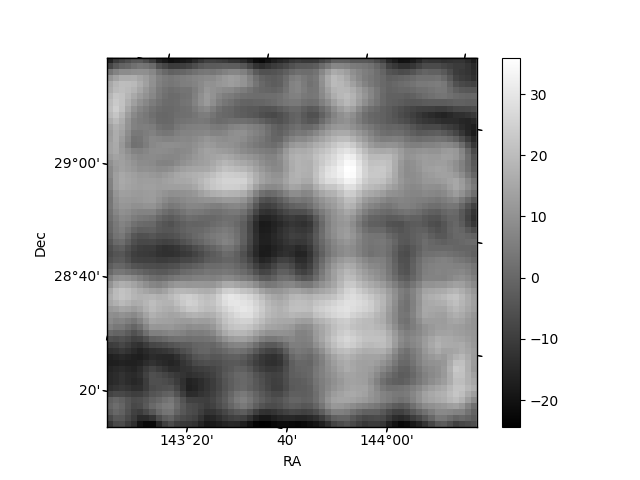
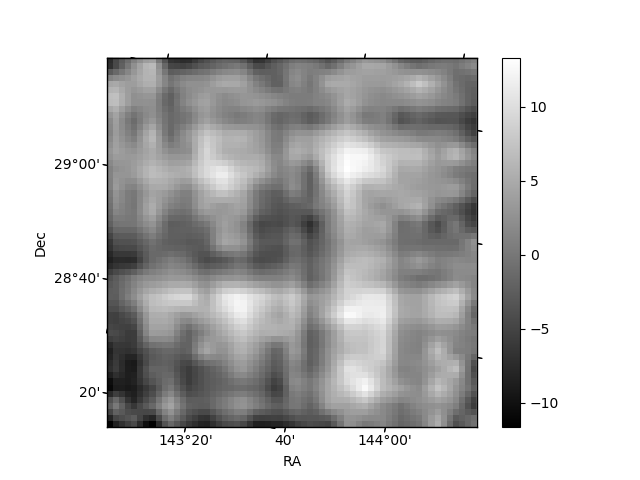
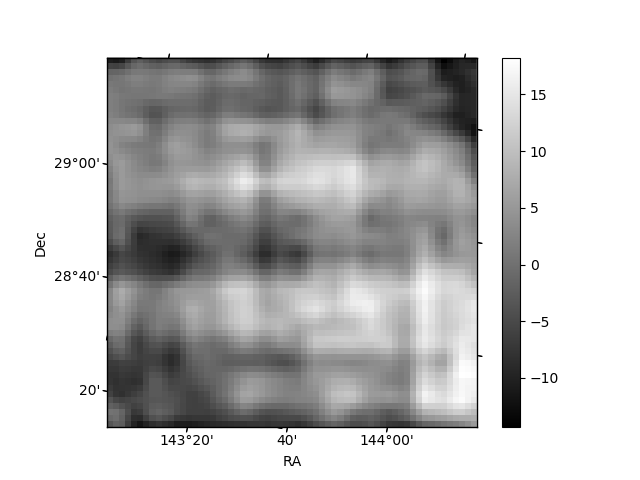
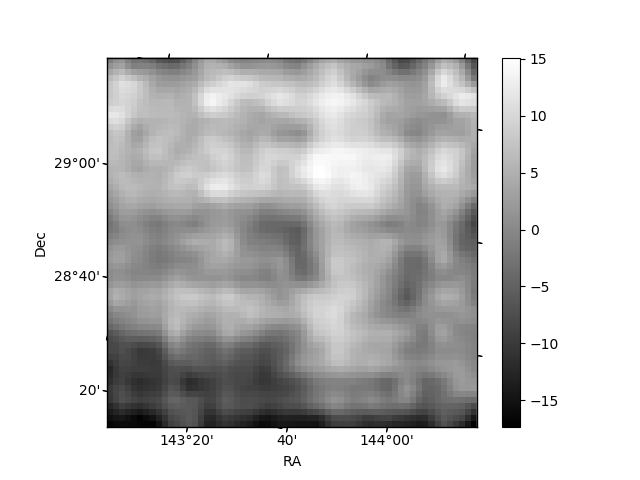
Histogram calculated using DETX and DETY for each event in the final _common_clean file
| Quadrant A | 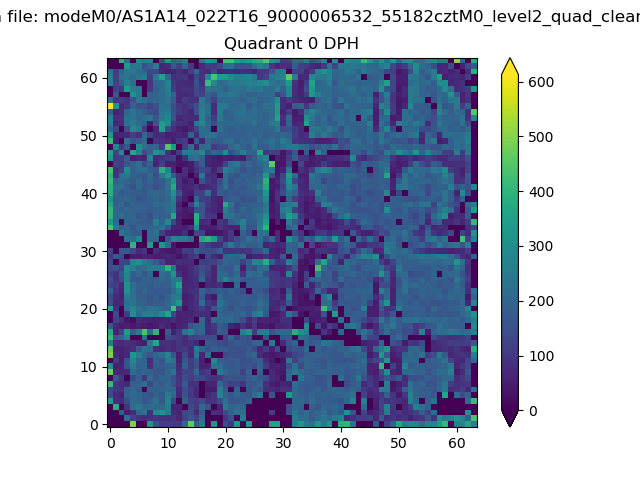 |
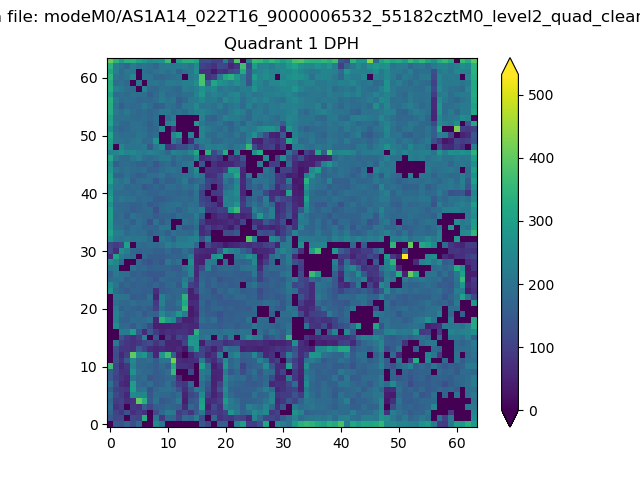 |
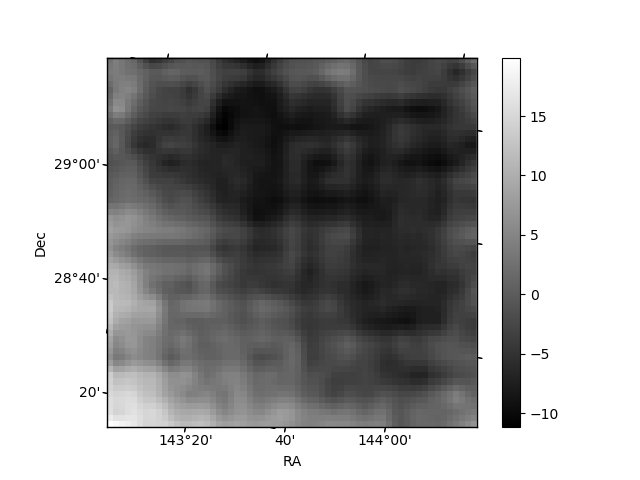
Quadrant B |
|---|---|---|---|
| Quadrant D | 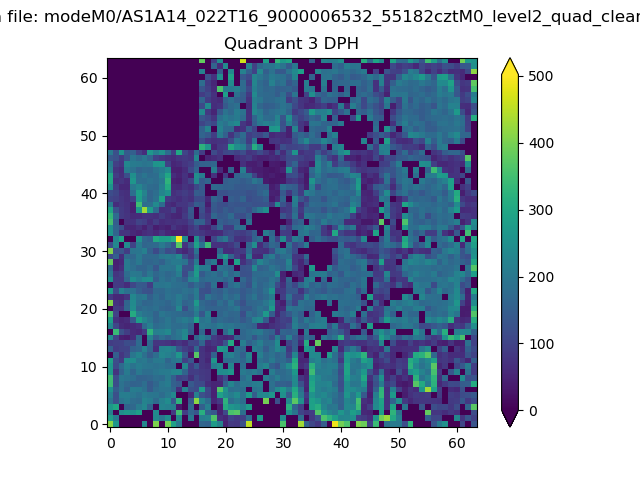 |
 |
Quadrant C |
| Plot type | Count rate plots | Images |
|---|---|---|
| Comparison with Poisson distribution Blue bars denote a histogram of data divided into 1 sec bins. Red curve is a Poisson curve with rate = median count rate of data. |
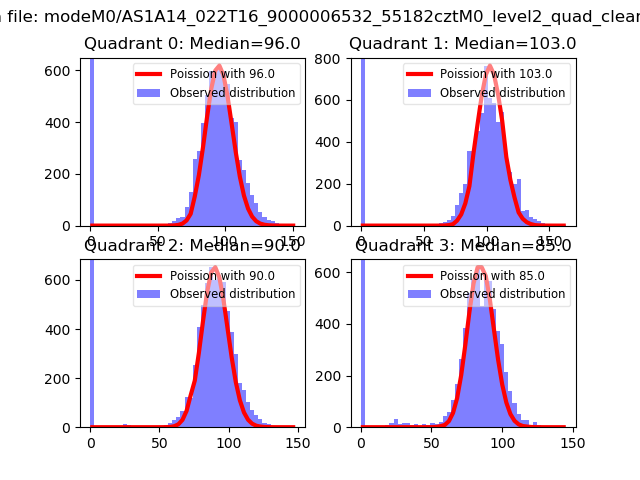 |
 |
| Quadrant-wise count rates Data is divided into 100 sec bins |
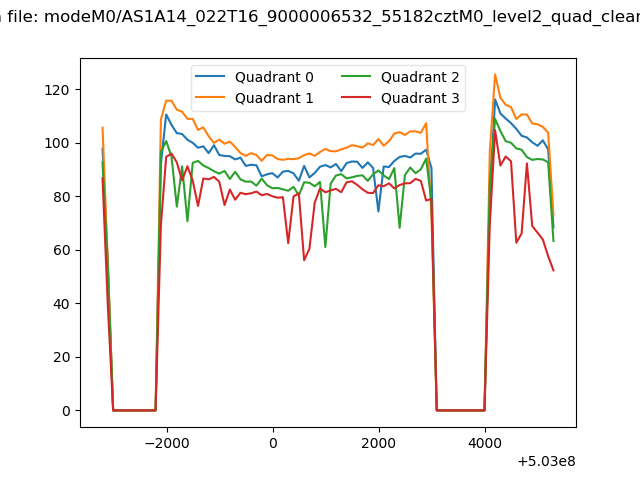 |
|
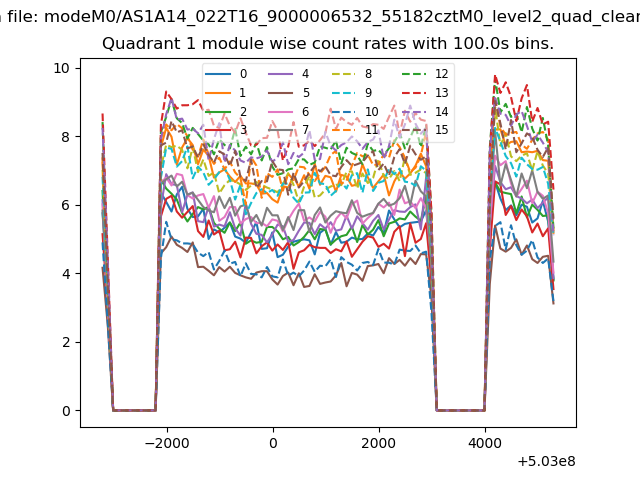
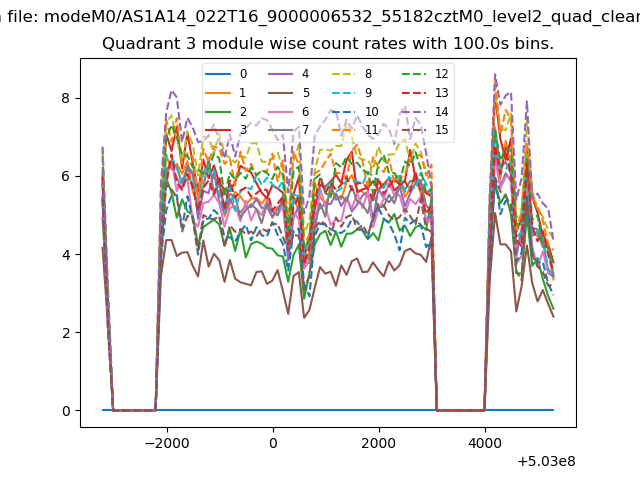
| Module-wise count rates for Quadrant A Data is divided into 100 sec bins |
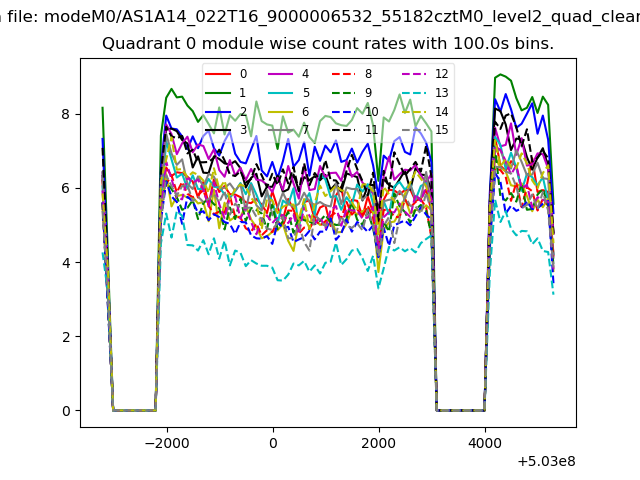 |
 |
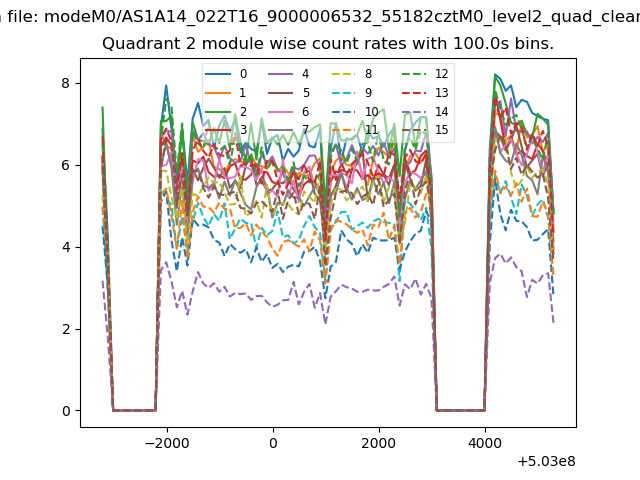
| Module-wise count rates for Quadrant B Data is divided into 100 sec bins |
 |
 |
| Module-wise count rates for Quadrant C Data is divided into 100 sec bins |
 |
 |
| Module-wise count rates for Quadrant D Data is divided into 100 sec bins |
 |
 |
| Parameter | Plot |
|---|---|
| CZT HV Monitor | 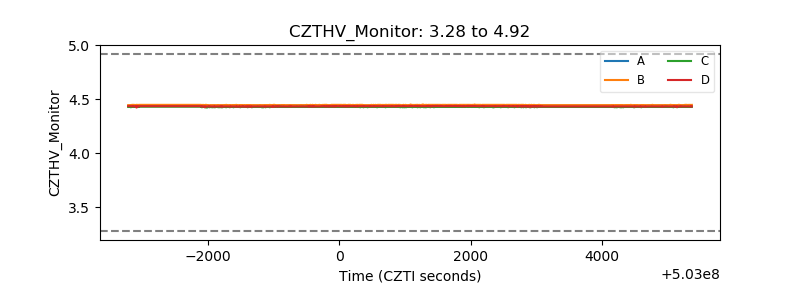 |
| D_VDD | 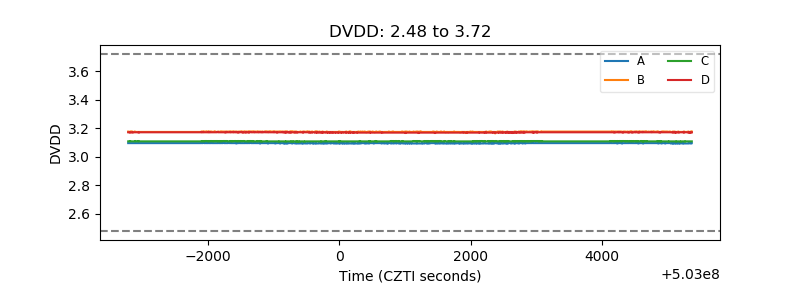 |
| Temperature 1 | 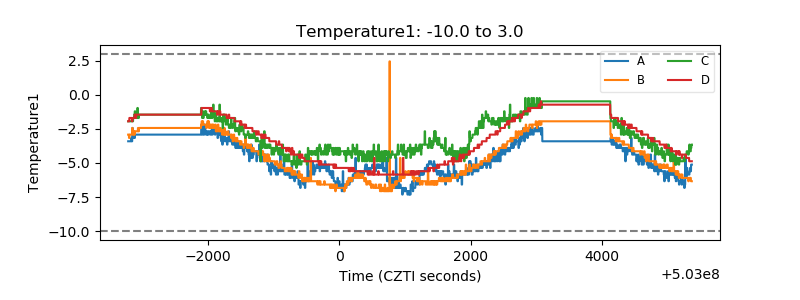 |
| Veto HV Monitor |  |
| Veto LLD | 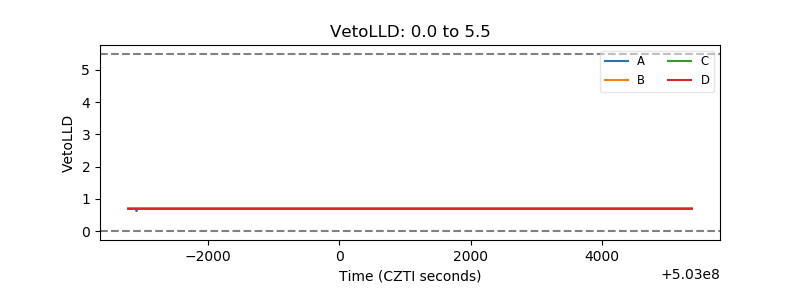 |
| Alpha Counter | 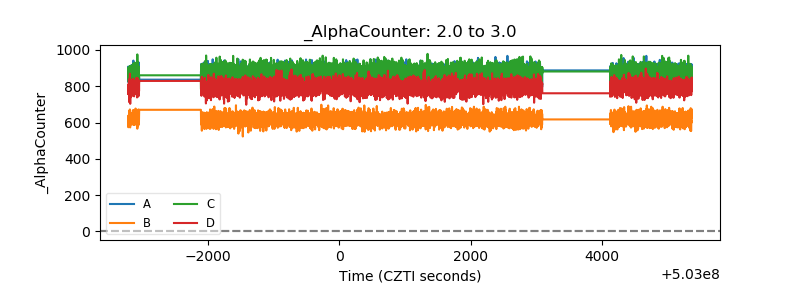 |
| _CPM_Rate | 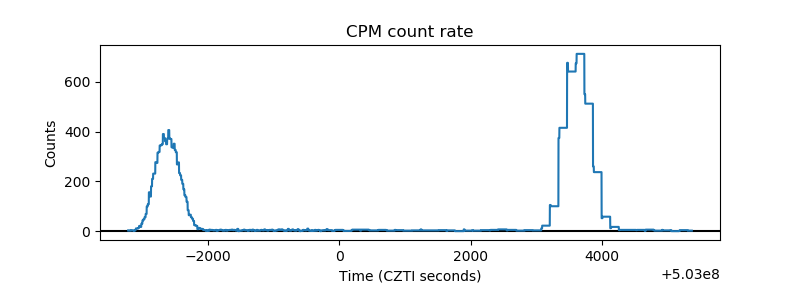 |
| CZT Counter | 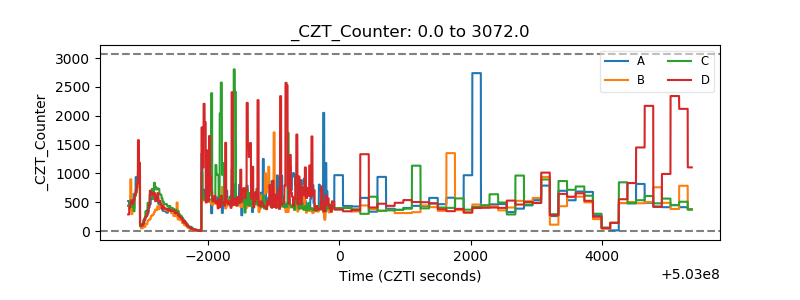 |
| +2.5 Volts monitor |  |
| +5 Volts monitor |  |
| _ROLL_ROT | 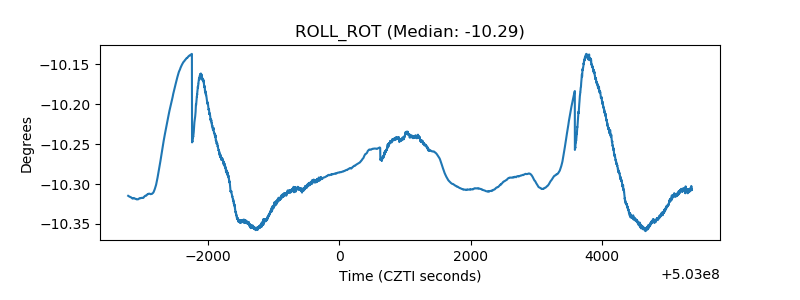 |
| _Roll_DEC | 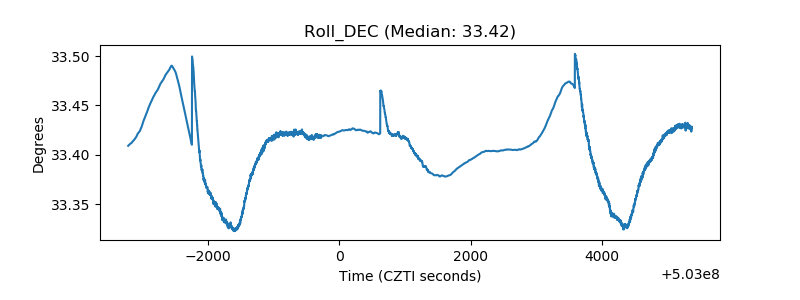 |
| _Roll_RA | 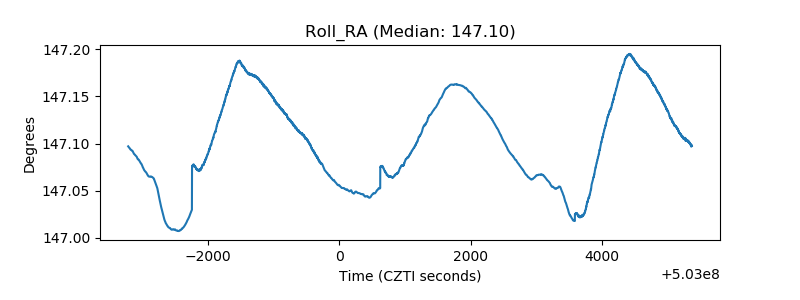 |
| Veto Counter | 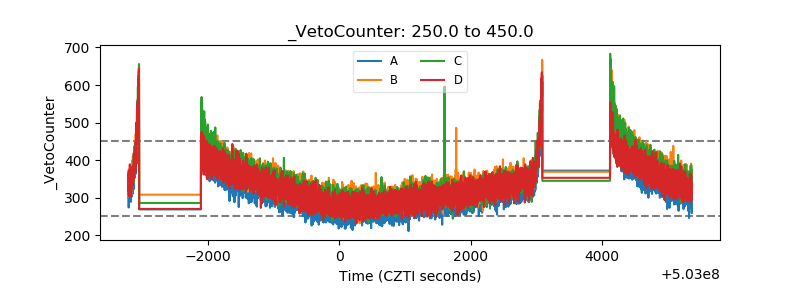 |