| Param | Original file | Final file |
|---|---|---|
| Filename | modeM0/AS1A14_022T16_9000006532_55183cztM0_level2.fits | modeM0/AS1A14_022T16_9000006532_55183cztM0_level2_quad_clean.evt |
| Size (bytes) | 447,168,960 | 101,154,240 |
| Size | 426.5 MB | 96.5 MB |
| Events in quadrant A | 3,890,176 | 662,333 |
| Events in quadrant B | 3,228,327 | 721,061 |
| Events in quadrant C | 3,582,319 | 635,362 |
| Events in quadrant D | 5,315,937 | 563,790 |
| Mode SS | |||
|---|---|---|---|
| Quadrant | BADHDUFLAG | Total packets | Discarded packets |
| A | 0 | 142 | 0 |
| B | 0 | 142 | 0 |
| C | 0 | 142 | 0 |
| D | 0 | 142 | 0 |
| Mode M0 | |||
|---|---|---|---|
| Quadrant | BADHDUFLAG | Total packets | Discarded packets |
| A | 0 | 16531 | 2 |
| B | 0 | 14796 | 2 |
| C | 0 | 15577 | 2 |
| D | 0 | 20897 | 2 |
| Mode M9 | |||
|---|---|---|---|
| Quadrant | BADHDUFLAG | Total packets | Discarded packets |
| A | 0 | 21 | 0 |
| B | 0 | 21 | 0 |
| C | 0 | 21 | 0 |
| D | 0 | 21 | 0 |
| Quadrant | Total seconds | Saturated seconds | Saturation percentage |
|---|---|---|---|
| A | 6891 | 169 | 2.452474% |
| B | 6891 | 86 | 1.248005% |
| C | 6892 | 105 | 1.523506% |
| D | 6892 | 600 | 8.705746% |
Noise dominated data is calculated using 1-second bins in cleaned event files. If a bin has >2000 counts, and if more than 50% of those come from <1% of pixels, then it is considered to be noise-dominated and hence unusable.
| Quadrant | # 1 sec bins | Bins with >0 counts | Bins with >2000 counts | High rate bins dominated by noise | Noise dominated (total time) | Noise dominated (detector-on time) | Marked lightcurve |
|---|---|---|---|---|---|---|---|
| A | 9046 | 6893 | 131 | 131 | 1.45% | 1.90% | 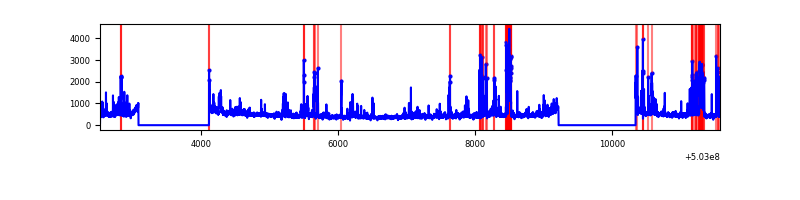 |
| B | 9046 | 6893 | 18 | 18 | 0.20% | 0.26% | 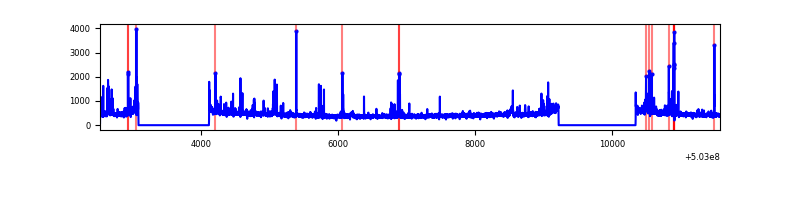 |
| C | 9047 | 6894 | 67 | 67 | 0.74% | 0.97% | 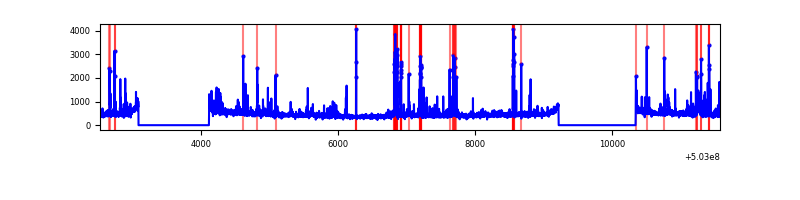 |
| D | 9047 | 6894 | 459 | 459 | 5.07% | 6.66% | 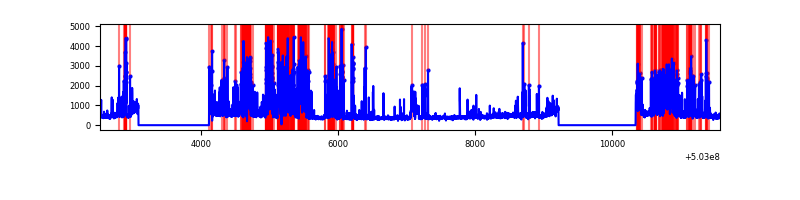 |
Top three noisy pixels from each quadrant. If the there are fewer than three noisy pixels in the level2.evt file, extra rows are filled as -1
| Pixel properties | Quadrant properties | ||||||
|---|---|---|---|---|---|---|---|
| Quadrant | DetID | PixID | Counts | Sigma | Mean | Median | Sigma |
| A | 3 | 78 | 403823 | 2187.48 | 742 | 723 | 184.3 |
| A | 0 | 8 | 296217 | 1603.54 | 742 | 723 | 184.3 |
| A | 4 | 249 | 195801 | 1058.62 | 742 | 723 | 184.3 |
| B | 2 | 249 | 95876 | 590.94 | 742 | 714 | 161.0 |
| B | 10 | 247 | 87694 | 540.13 | 742 | 714 | 161.0 |
| B | 5 | 185 | 42954 | 262.3 | 742 | 714 | 161.0 |
| C | 12 | 250 | 210703 | 1049.09 | 729 | 723 | 200.2 |
| C | 10 | 22 | 158230 | 786.93 | 729 | 723 | 200.2 |
| C | 1 | 16 | 126907 | 630.43 | 729 | 723 | 200.2 |
| D | 2 | 249 | 2148365 | 10874.95 | 703 | 672 | 197.5 |
| D | 6 | 239 | 122618 | 617.48 | 703 | 672 | 197.5 |
| D | 3 | 12 | 72779 | 365.12 | 703 | 672 | 197.5 |
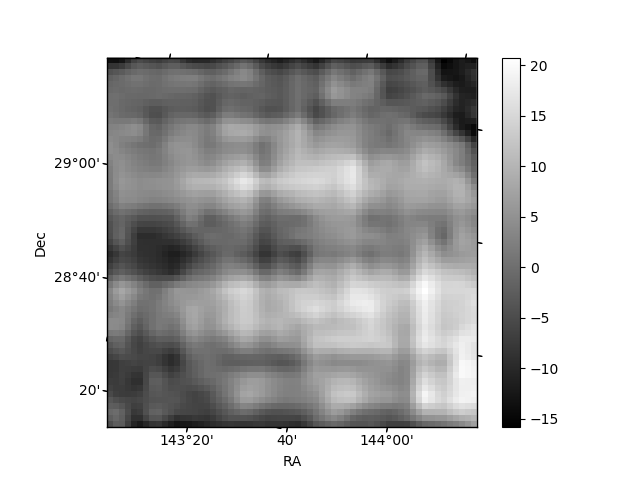
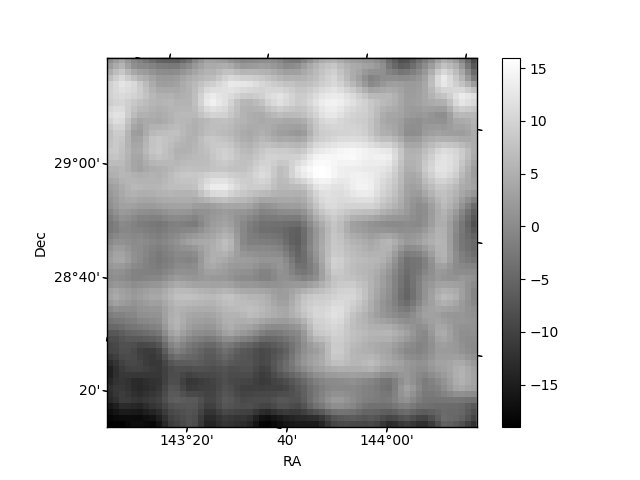
Histogram calculated using DETX and DETY for each event in the final _common_clean file
| Quadrant A | 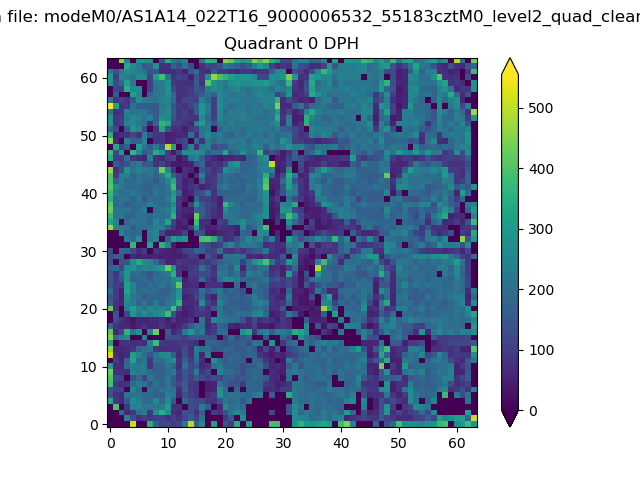 |
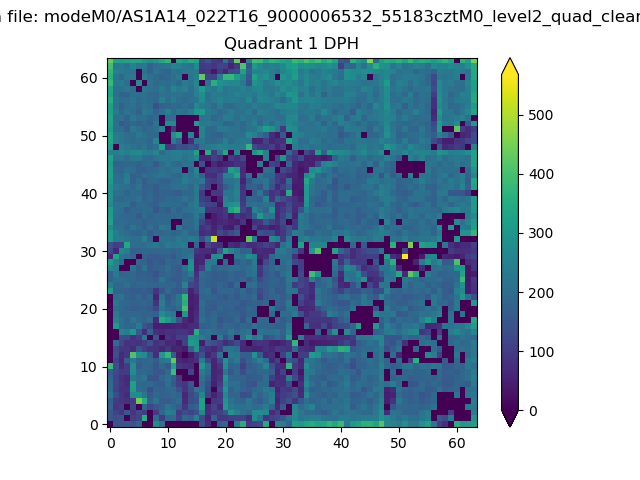 |
Quadrant B |
|---|---|---|---|
| Quadrant D | 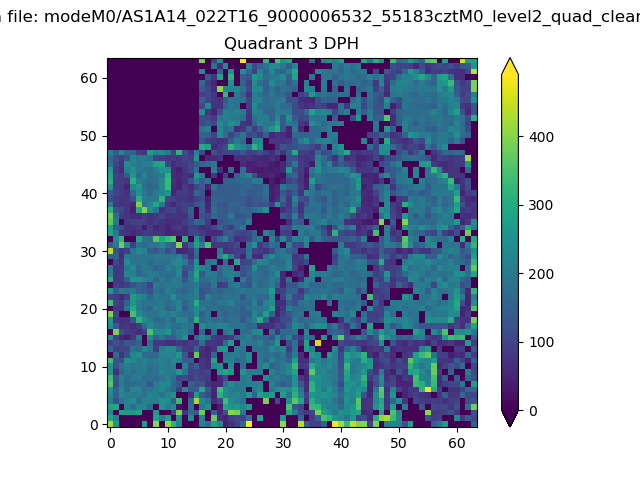 |
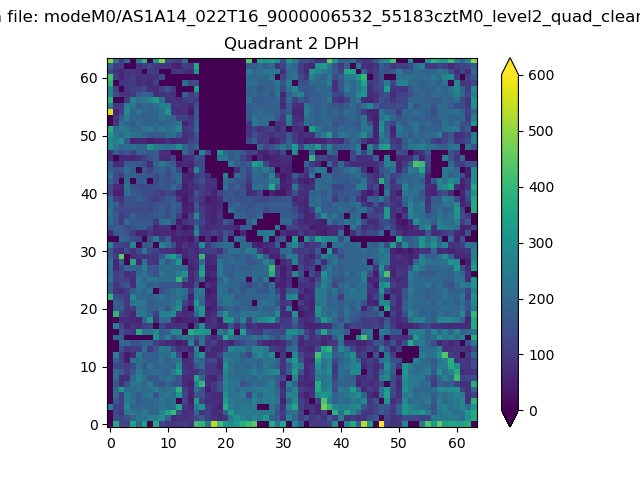 |
Quadrant C |
| Plot type | Count rate plots | Images |
|---|---|---|
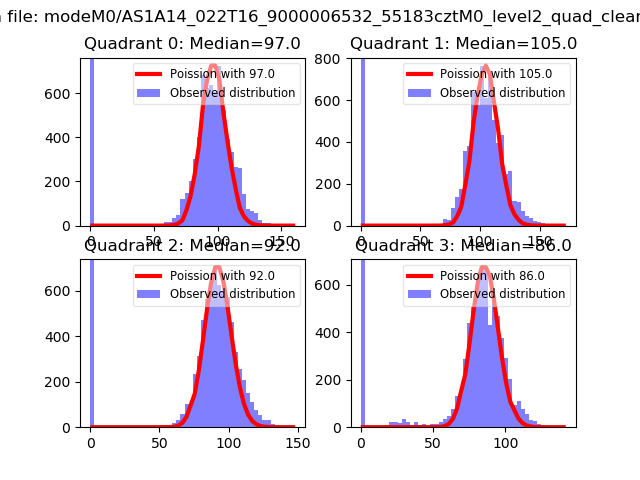
| Comparison with Poisson distribution Blue bars denote a histogram of data divided into 1 sec bins. Red curve is a Poisson curve with rate = median count rate of data. |
 |
 |
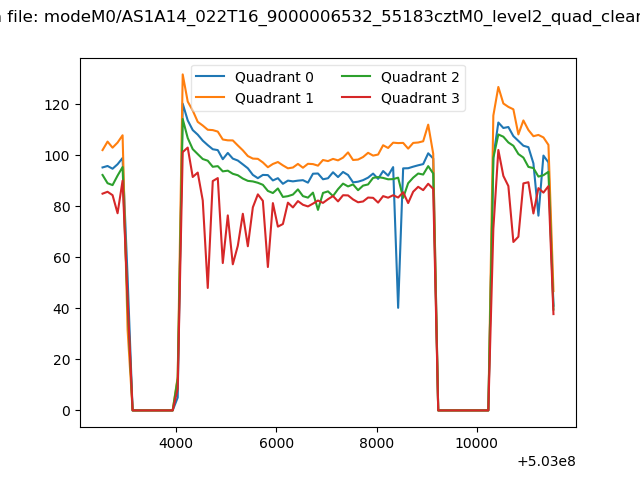
| Quadrant-wise count rates Data is divided into 100 sec bins |
 |
|
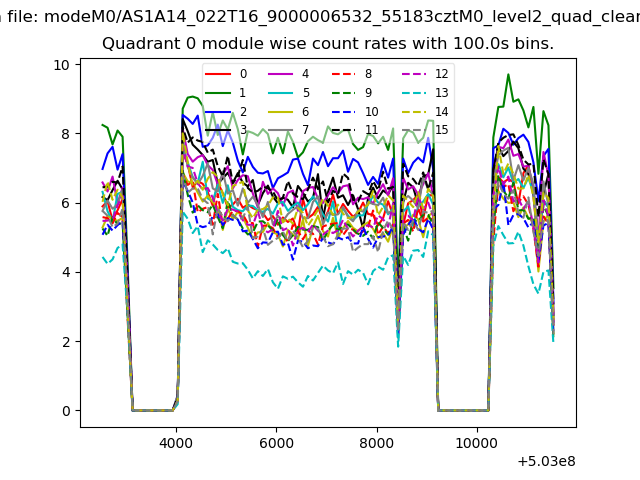
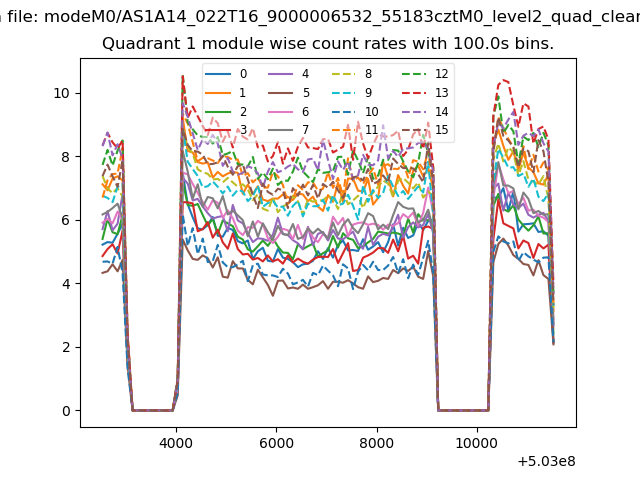
| Module-wise count rates for Quadrant A Data is divided into 100 sec bins |
 |
 |
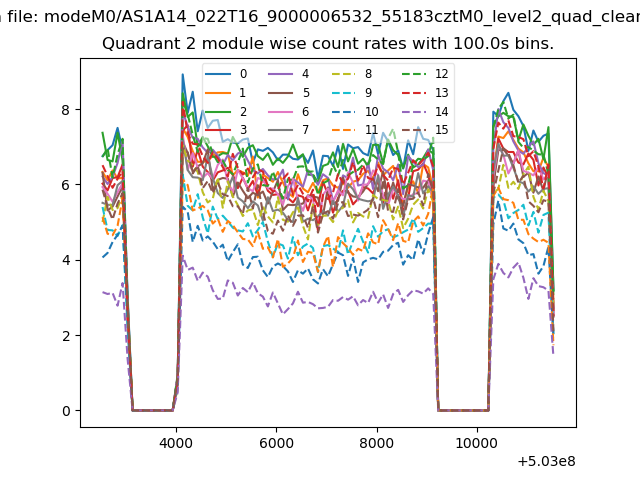
| Module-wise count rates for Quadrant B Data is divided into 100 sec bins |
 |
 |
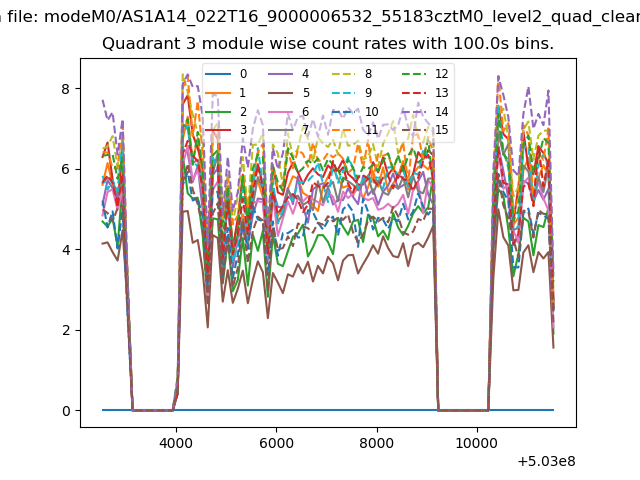
| Module-wise count rates for Quadrant C Data is divided into 100 sec bins |
 |
 |
| Module-wise count rates for Quadrant D Data is divided into 100 sec bins |
 |
 |
| Parameter | Plot |
|---|---|
| CZT HV Monitor | 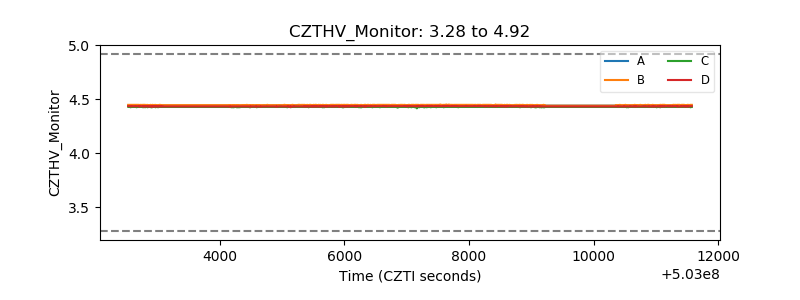 |
| D_VDD | 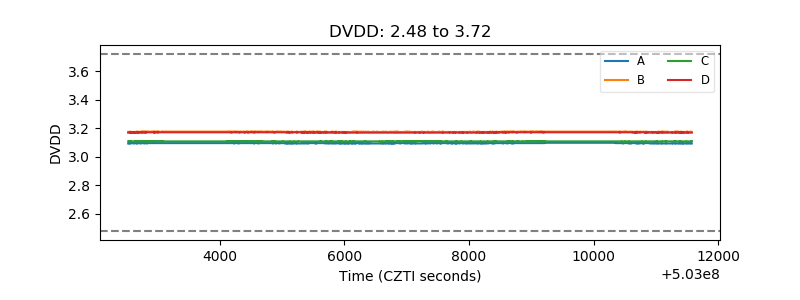 |
| Temperature 1 | 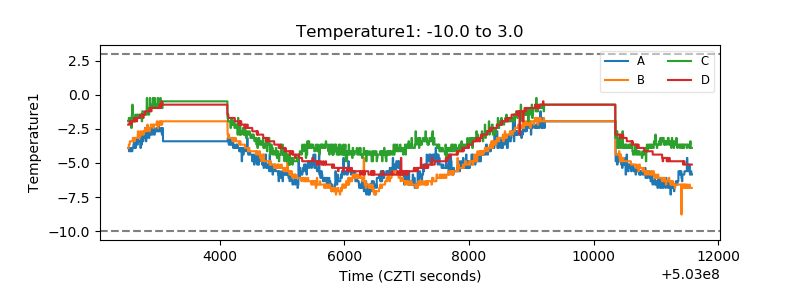 |
| Veto HV Monitor | 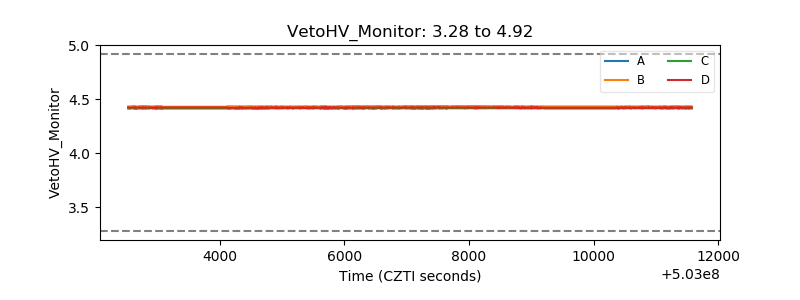 |
| Veto LLD | 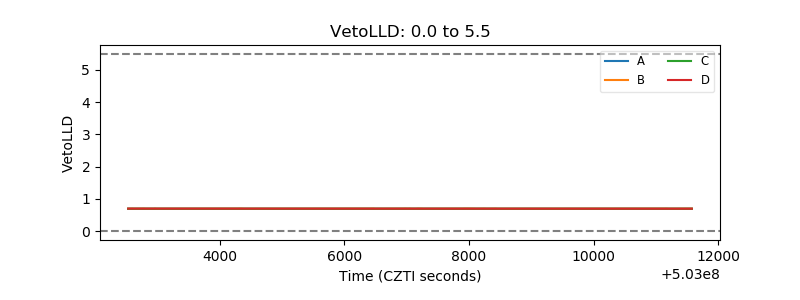 |
| Alpha Counter | 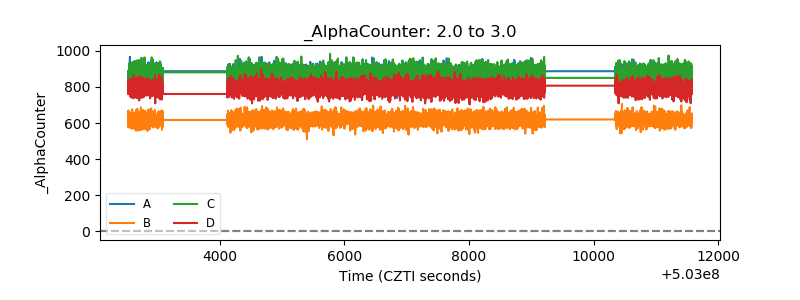 |
| _CPM_Rate | 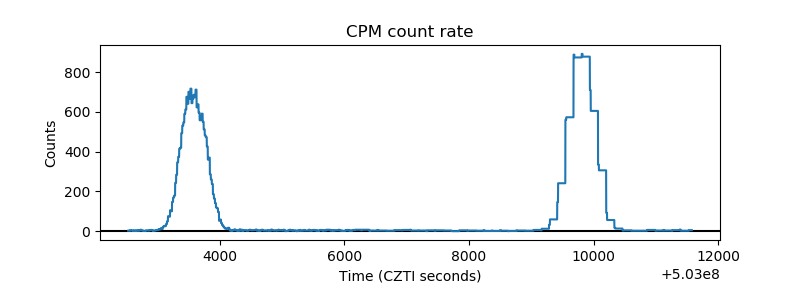 |
| CZT Counter | 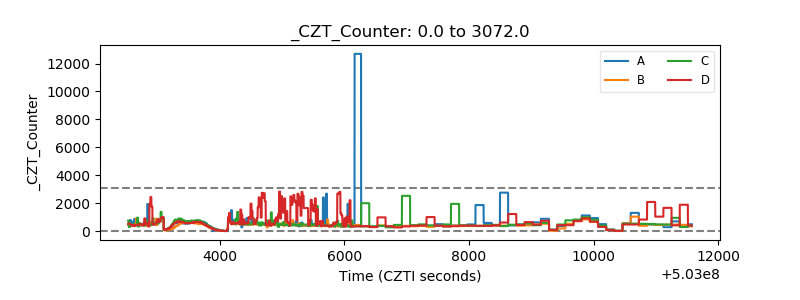 |
| +2.5 Volts monitor |  |
| +5 Volts monitor | 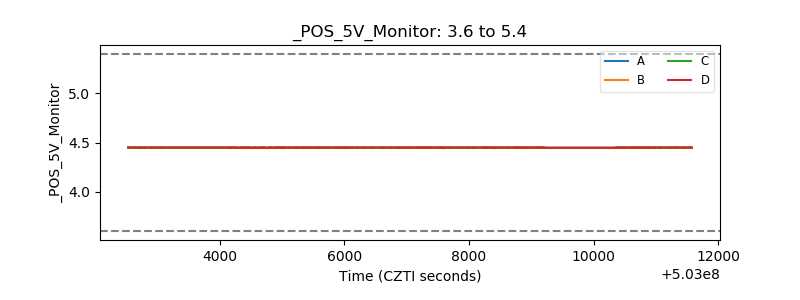 |
| _ROLL_ROT | 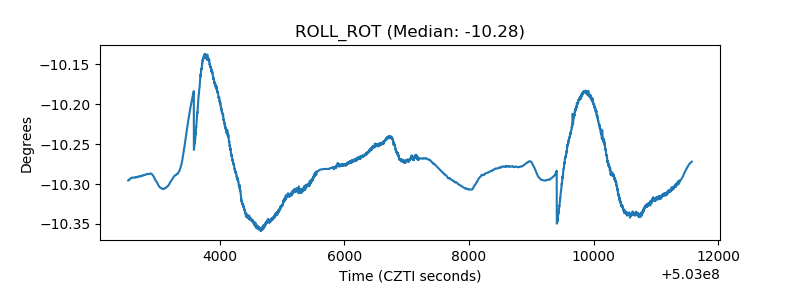 |
| _Roll_DEC | 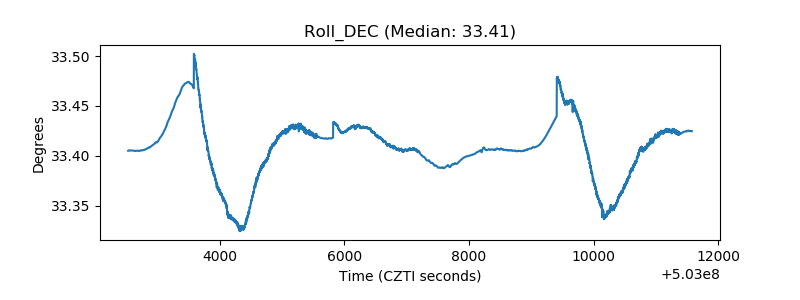 |
| _Roll_RA | 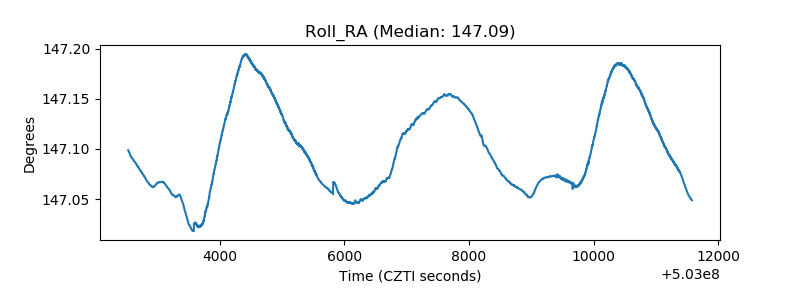 |
| Veto Counter | 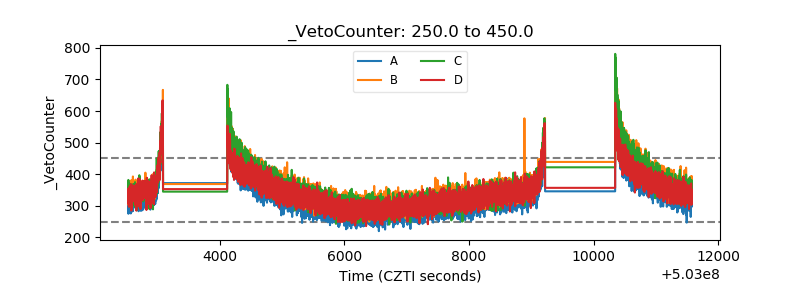 |