| Param | Original file | Final file |
|---|---|---|
| Filename | modeM0/AS1A14_022T16_9000006532_55184cztM0_level2.fits | modeM0/AS1A14_022T16_9000006532_55184cztM0_level2_quad_clean.evt |
| Size (bytes) | 437,088,960 | 108,564,480 |
| Size | 416.8 MB | 103.5 MB |
| Events in quadrant A | 4,269,657 | 704,635 |
| Events in quadrant B | 3,362,973 | 774,739 |
| Events in quadrant C | 3,652,478 | 680,210 |
| Events in quadrant D | 4,328,218 | 620,791 |
| Mode SS | |||
|---|---|---|---|
| Quadrant | BADHDUFLAG | Total packets | Discarded packets |
| A | 0 | 150 | 0 |
| B | 0 | 150 | 0 |
| C | 0 | 150 | 0 |
| D | 0 | 150 | 0 |
| Mode M0 | |||
|---|---|---|---|
| Quadrant | BADHDUFLAG | Total packets | Discarded packets |
| A | 0 | 17796 | 2 |
| B | 0 | 15478 | 2 |
| C | 0 | 16085 | 2 |
| D | 0 | 18261 | 2 |
| Mode M9 | |||
|---|---|---|---|
| Quadrant | BADHDUFLAG | Total packets | Discarded packets |
| A | 0 | 23 | 0 |
| B | 0 | 23 | 0 |
| C | 0 | 23 | 0 |
| D | 0 | 23 | 0 |
| Quadrant | Total seconds | Saturated seconds | Saturation percentage |
|---|---|---|---|
| A | 7280 | 182 | 2.500000% |
| B | 7280 | 63 | 0.865385% |
| C | 7281 | 77 | 1.057547% |
| D | 7281 | 273 | 3.749485% |
Noise dominated data is calculated using 1-second bins in cleaned event files. If a bin has >2000 counts, and if more than 50% of those come from <1% of pixels, then it is considered to be noise-dominated and hence unusable.
| Quadrant | # 1 sec bins | Bins with >0 counts | Bins with >2000 counts | High rate bins dominated by noise | Noise dominated (total time) | Noise dominated (detector-on time) | Marked lightcurve |
|---|---|---|---|---|---|---|---|
| A | 9595 | 7282 | 155 | 155 | 1.62% | 2.13% | 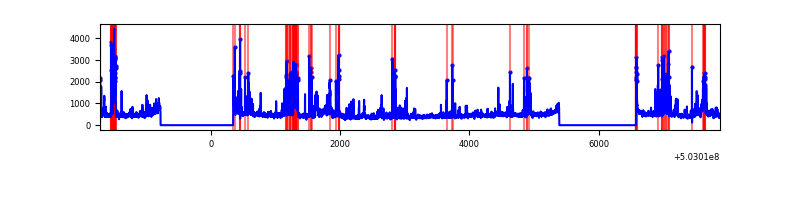 |
| B | 9595 | 7282 | 16 | 16 | 0.17% | 0.22% | 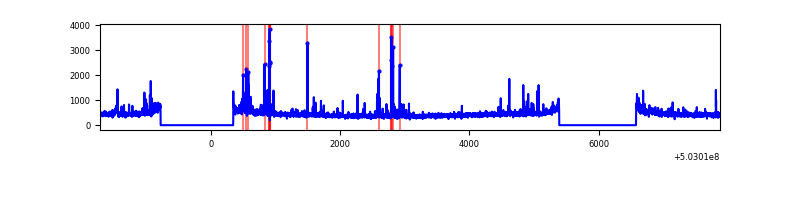 |
| C | 9596 | 7283 | 41 | 41 | 0.43% | 0.56% | 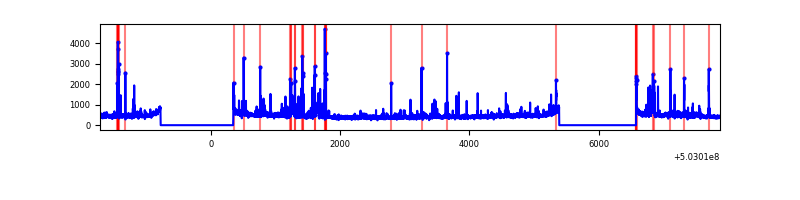 |
| D | 9596 | 7283 | 185 | 185 | 1.93% | 2.54% | 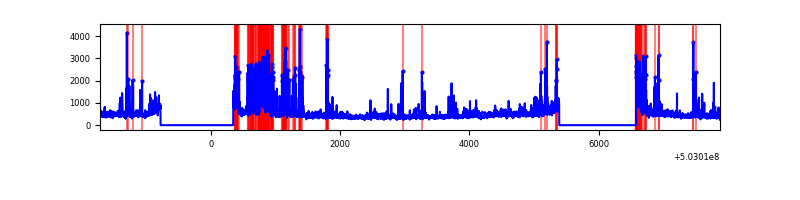 |
Top three noisy pixels from each quadrant. If the there are fewer than three noisy pixels in the level2.evt file, extra rows are filled as -1
| Pixel properties | Quadrant properties | ||||||
|---|---|---|---|---|---|---|---|
| Quadrant | DetID | PixID | Counts | Sigma | Mean | Median | Sigma |
| A | 3 | 78 | 636837 | 3297.76 | 780 | 761 | 192.9 |
| A | 0 | 8 | 264654 | 1368.16 | 780 | 761 | 192.9 |
| A | 4 | 249 | 188436 | 973.01 | 780 | 761 | 192.9 |
| B | 10 | 247 | 113542 | 666.86 | 784 | 757 | 169.1 |
| B | 2 | 249 | 68505 | 400.57 | 784 | 757 | 169.1 |
| B | 5 | 185 | 32284 | 186.41 | 784 | 757 | 169.1 |
| C | 12 | 250 | 159116 | 755.87 | 768 | 762 | 209.5 |
| C | 1 | 16 | 152427 | 723.94 | 768 | 762 | 209.5 |
| C | 10 | 22 | 102015 | 483.31 | 768 | 762 | 209.5 |
| D | 2 | 249 | 942207 | 4401.29 | 754 | 721 | 213.9 |
| D | 11 | 129 | 160625 | 747.52 | 754 | 721 | 213.9 |
| D | 5 | 173 | 57813 | 266.9 | 754 | 721 | 213.9 |
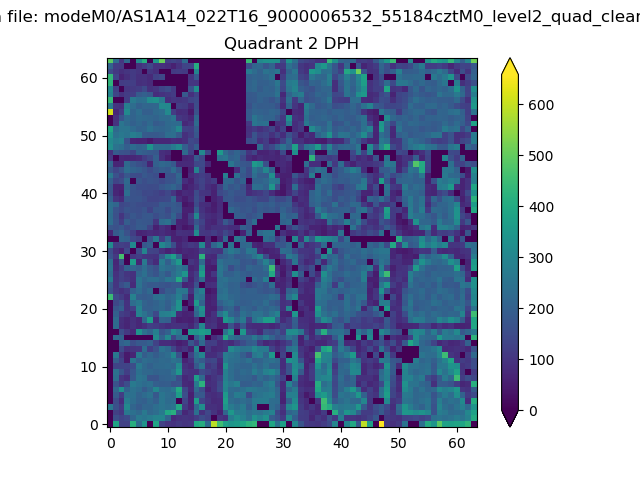
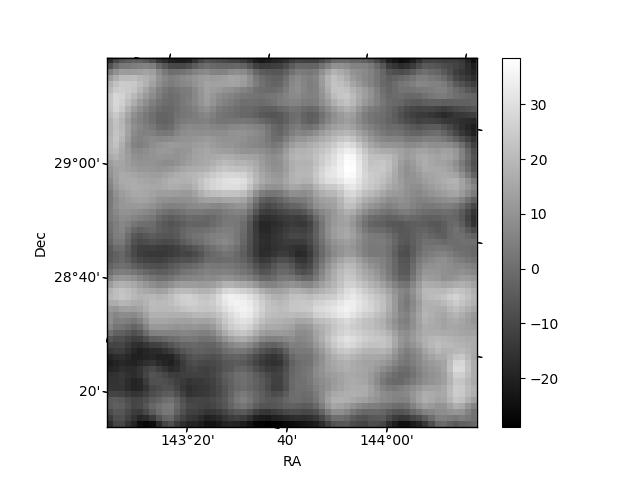
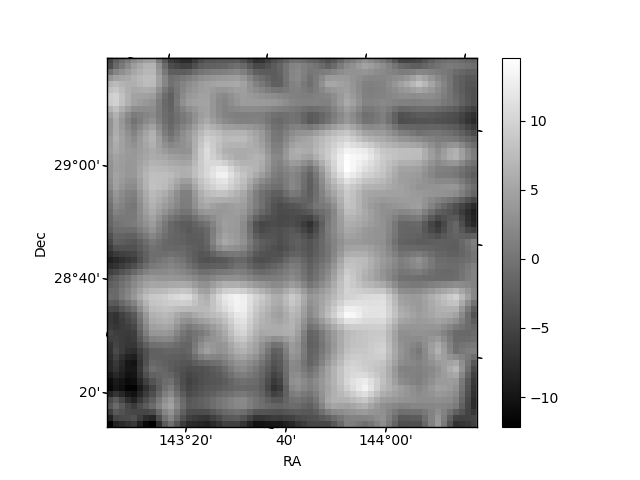
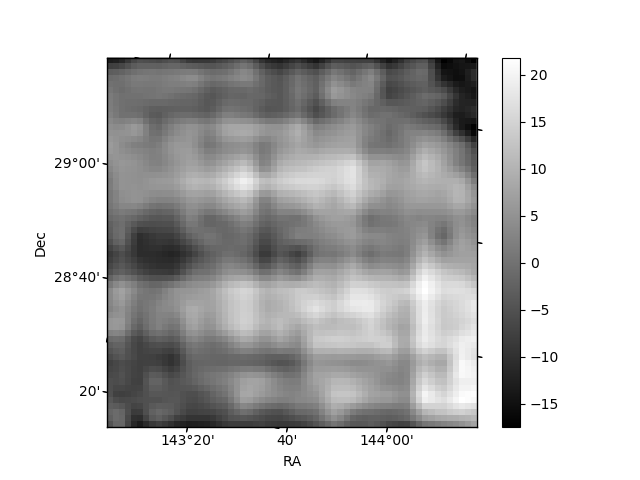
Histogram calculated using DETX and DETY for each event in the final _common_clean file
| Quadrant A | 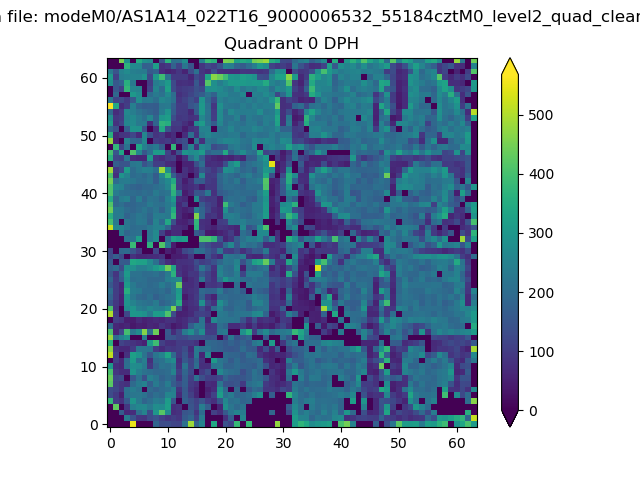 |
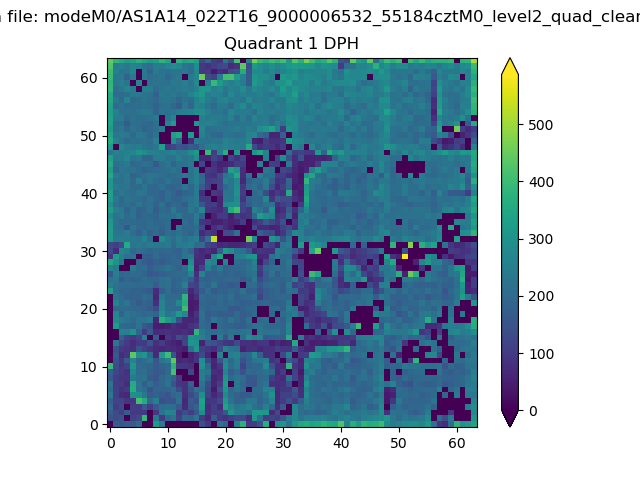 |
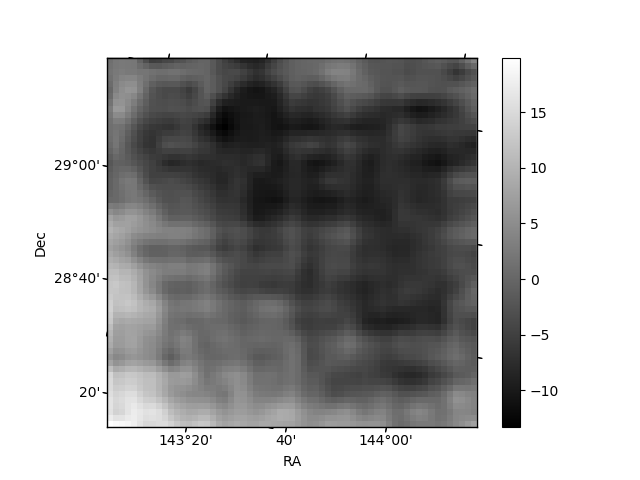
Quadrant B |
|---|---|---|---|
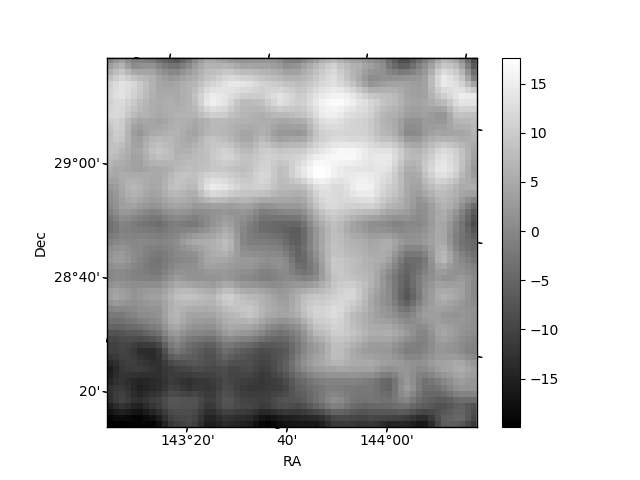
| Quadrant D | 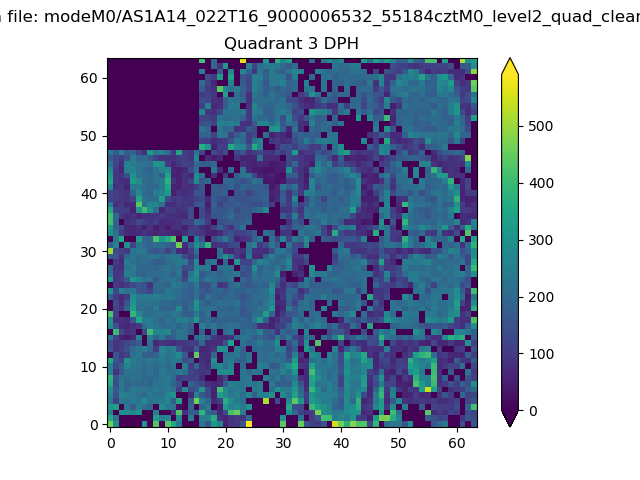 |
 |
Quadrant C |
| Plot type | Count rate plots | Images |
|---|---|---|
| Comparison with Poisson distribution Blue bars denote a histogram of data divided into 1 sec bins. Red curve is a Poisson curve with rate = median count rate of data. |
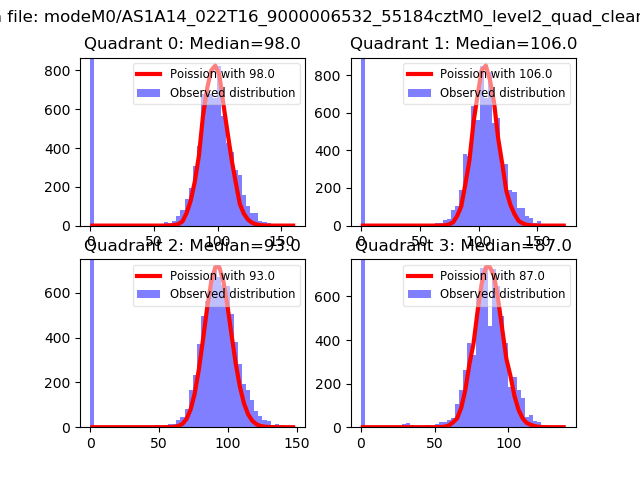 |
 |
| Quadrant-wise count rates Data is divided into 100 sec bins |
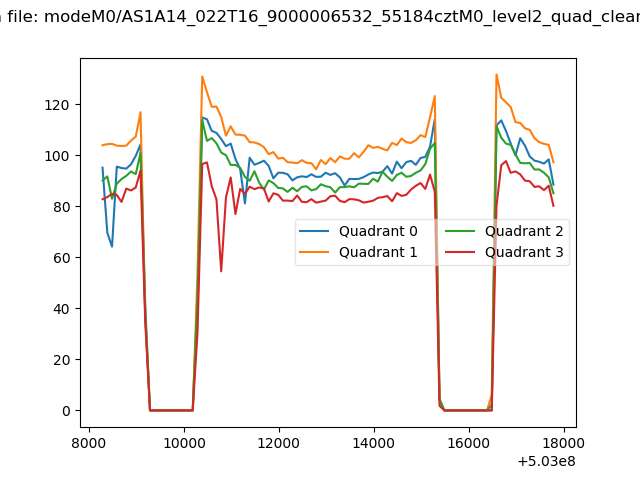 |
|
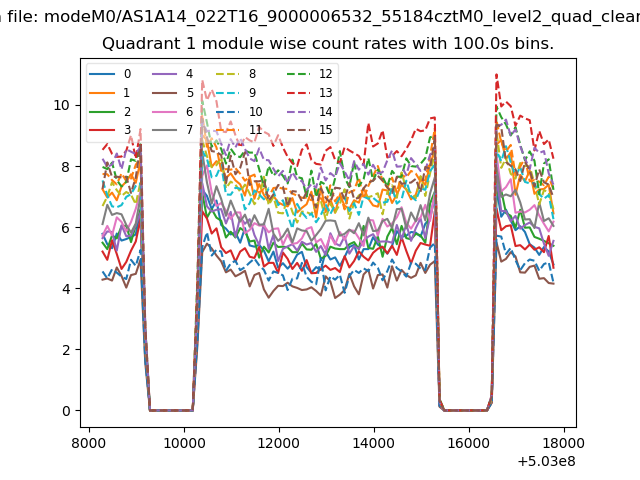
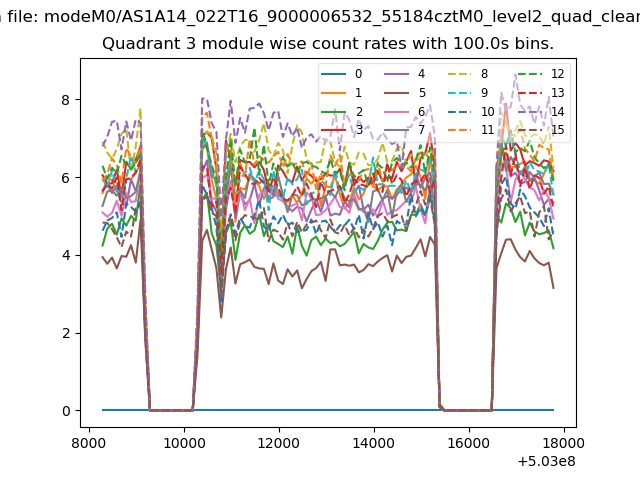
| Module-wise count rates for Quadrant A Data is divided into 100 sec bins |
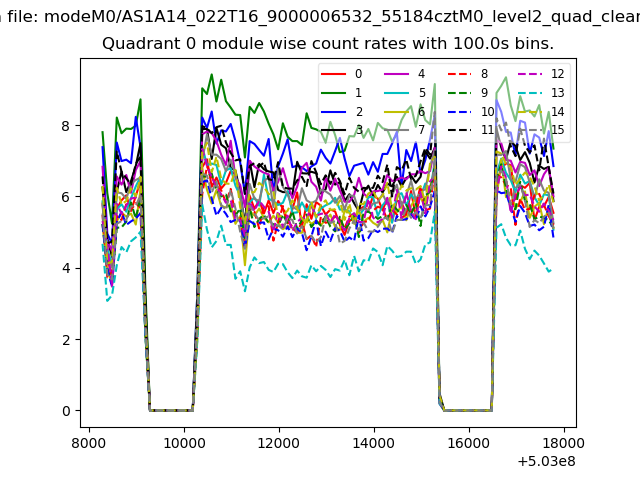 |
 |
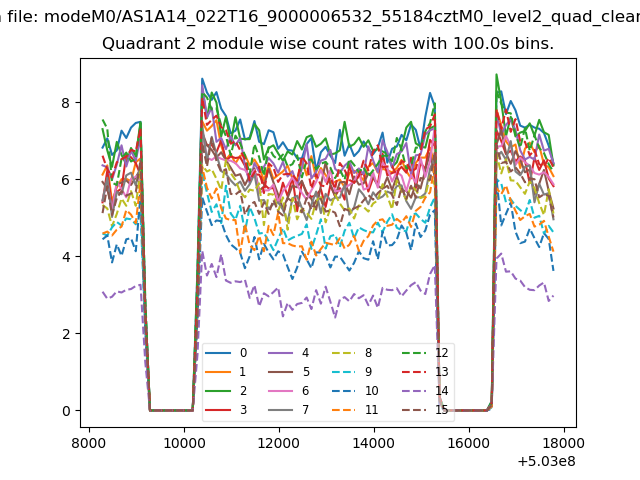
| Module-wise count rates for Quadrant B Data is divided into 100 sec bins |
 |
 |
| Module-wise count rates for Quadrant C Data is divided into 100 sec bins |
 |
 |
| Module-wise count rates for Quadrant D Data is divided into 100 sec bins |
 |
 |
| Parameter | Plot |
|---|---|
| CZT HV Monitor | 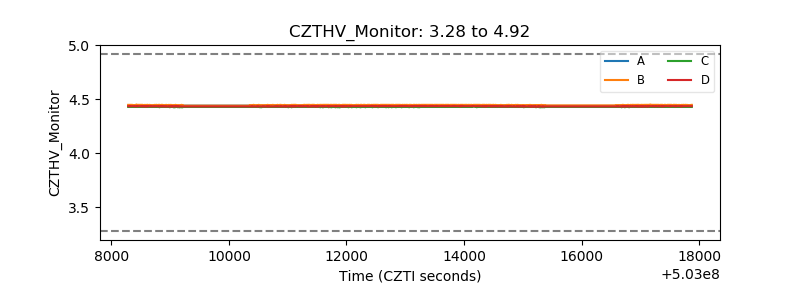 |
| D_VDD | 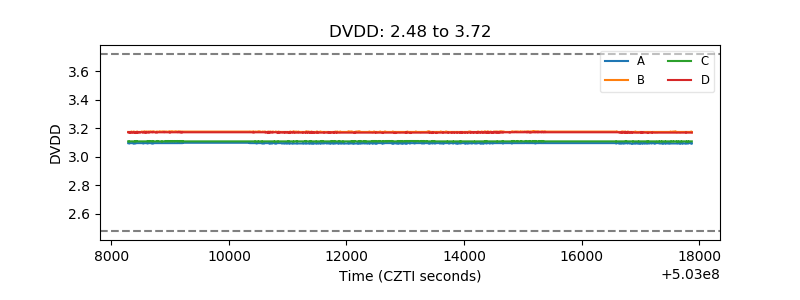 |
| Temperature 1 | 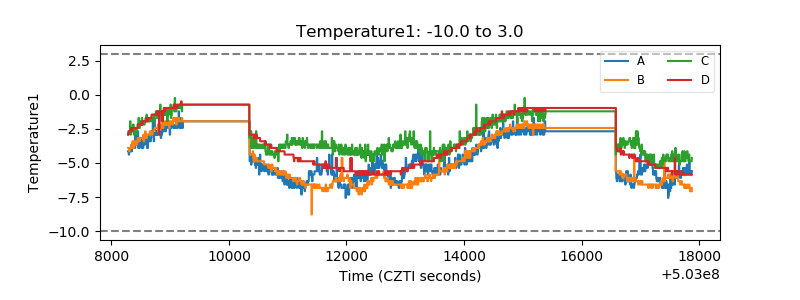 |
| Veto HV Monitor | 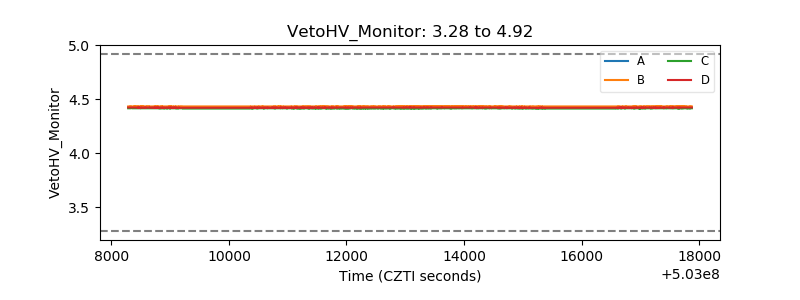 |
| Veto LLD | 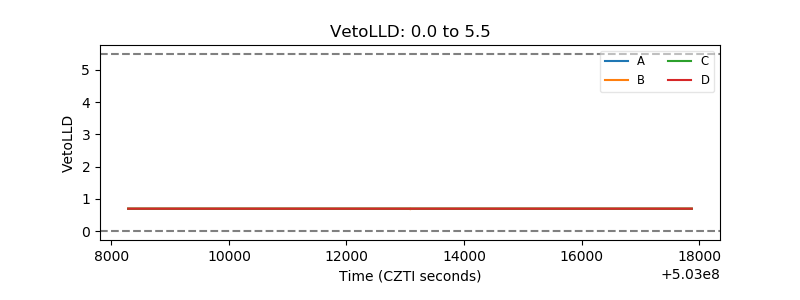 |
| Alpha Counter | 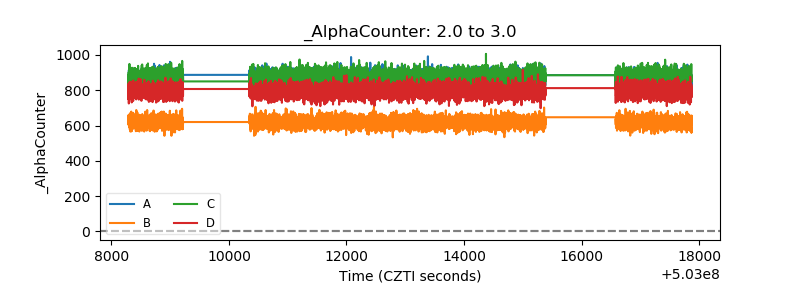 |
| _CPM_Rate | 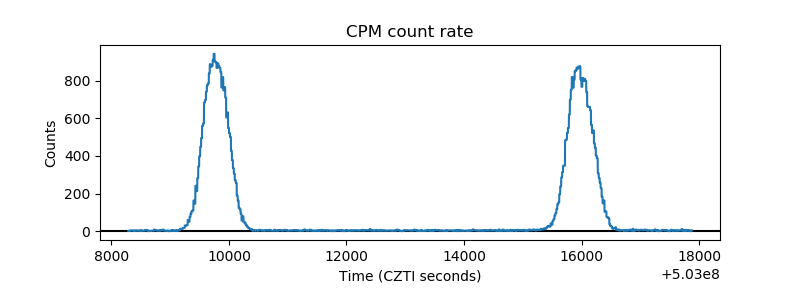 |
| CZT Counter | 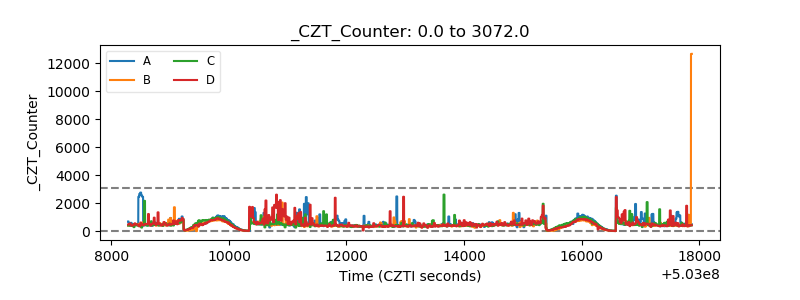 |
| +2.5 Volts monitor |  |
| +5 Volts monitor |  |
| _ROLL_ROT | 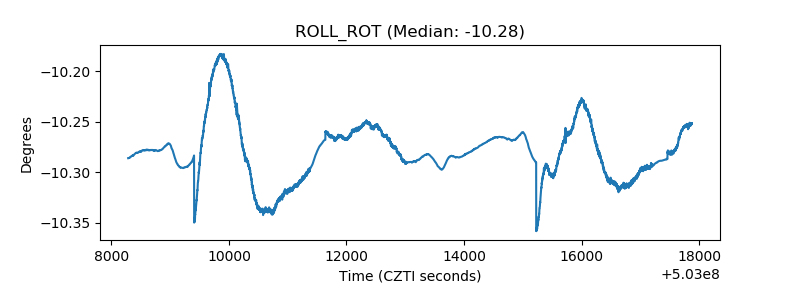 |
| _Roll_DEC | 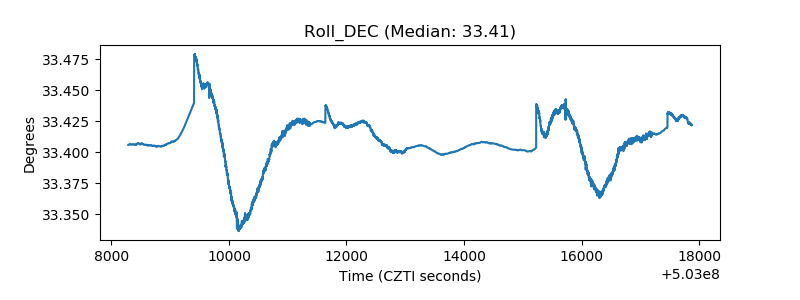 |
| _Roll_RA | 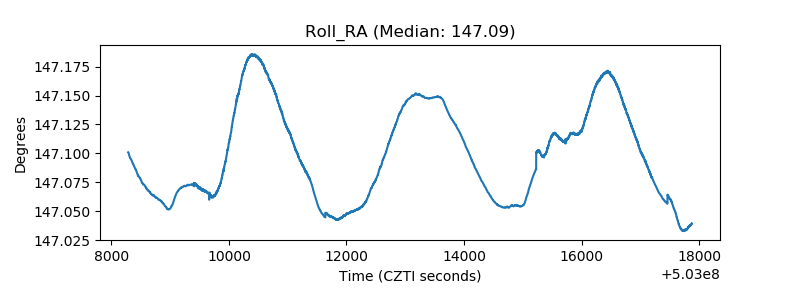 |
| Veto Counter | 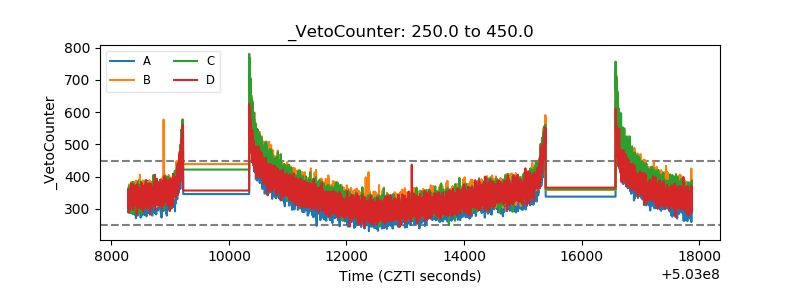 |