| Param | Original file | Final file |
|---|---|---|
| Filename | modeM0/AS1A14_022T16_9000006532_55188cztM0_level2.fits | modeM0/AS1A14_022T16_9000006532_55188cztM0_level2_quad_clean.evt |
| Size (bytes) | 450,656,640 | 102,977,280 |
| Size | 429.8 MB | 98.2 MB |
| Events in quadrant A | 5,120,105 | 643,381 |
| Events in quadrant B | 3,364,537 | 712,243 |
| Events in quadrant C | 3,923,696 | 643,234 |
| Events in quadrant D | 3,702,001 | 607,787 |
| Mode SS | |||
|---|---|---|---|
| Quadrant | BADHDUFLAG | Total packets | Discarded packets |
| A | 0 | 148 | 0 |
| B | 0 | 148 | 0 |
| C | 0 | 148 | 0 |
| D | 0 | 148 | 0 |
| Mode M0 | |||
|---|---|---|---|
| Quadrant | BADHDUFLAG | Total packets | Discarded packets |
| A | 0 | 20513 | 0 |
| B | 0 | 15832 | 0 |
| C | 0 | 17001 | 0 |
| D | 0 | 16626 | 0 |
| Quadrant | Total seconds | Saturated seconds | Saturation percentage |
|---|---|---|---|
| A | 7342 | 554 | 7.545628% |
| B | 7342 | 296 | 4.031599% |
| C | 7342 | 185 | 2.519749% |
| D | 7342 | 164 | 2.233724% |
Noise dominated data is calculated using 1-second bins in cleaned event files. If a bin has >2000 counts, and if more than 50% of those come from <1% of pixels, then it is considered to be noise-dominated and hence unusable.
| Quadrant | # 1 sec bins | Bins with >0 counts | Bins with >2000 counts | High rate bins dominated by noise | Noise dominated (total time) | Noise dominated (detector-on time) | Marked lightcurve |
|---|---|---|---|---|---|---|---|
| A | 7342 | 7342 | 304 | 304 | 4.14% | 4.14% | 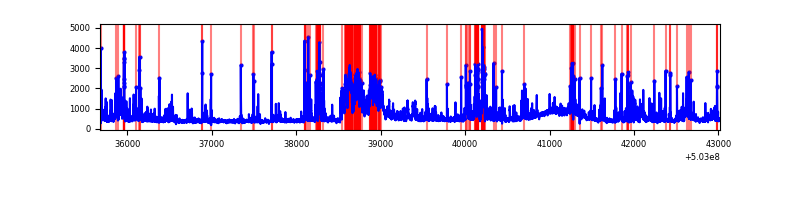 |
| B | 7342 | 7342 | 24 | 24 | 0.33% | 0.33% | 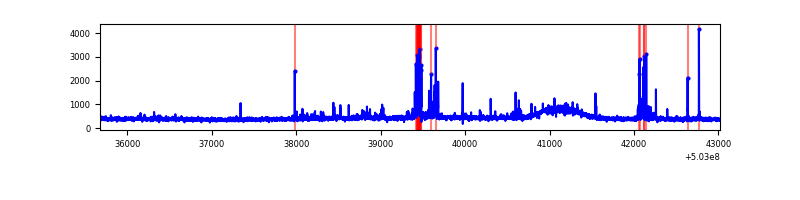 |
| C | 7342 | 7342 | 89 | 89 | 1.21% | 1.21% | 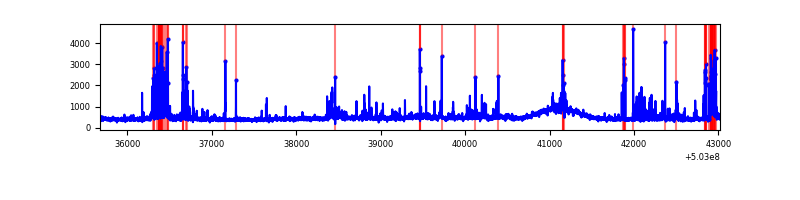 |
| D | 7342 | 7342 | 70 | 70 | 0.95% | 0.95% | 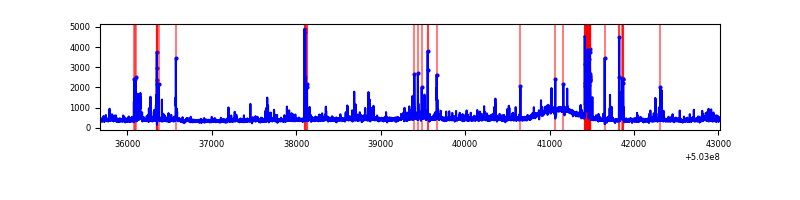 |
Top three noisy pixels from each quadrant. If the there are fewer than three noisy pixels in the level2.evt file, extra rows are filled as -1
| Pixel properties | Quadrant properties | ||||||
|---|---|---|---|---|---|---|---|
| Quadrant | DetID | PixID | Counts | Sigma | Mean | Median | Sigma |
| A | 12 | 115 | 712558 | 3693.68 | 783 | 763 | 192.7 |
| A | 3 | 78 | 555315 | 2877.71 | 783 | 763 | 192.7 |
| A | 4 | 249 | 419583 | 2173.36 | 783 | 763 | 192.7 |
| B | 2 | 249 | 120679 | 705.72 | 780 | 750 | 169.9 |
| B | 10 | 247 | 77061 | 449.05 | 780 | 750 | 169.9 |
| B | 5 | 185 | 39527 | 228.18 | 780 | 750 | 169.9 |
| C | 1 | 16 | 225806 | 1069.42 | 766 | 759 | 210.4 |
| C | 10 | 22 | 196299 | 929.2 | 766 | 759 | 210.4 |
| C | 13 | 3 | 123442 | 582.99 | 766 | 759 | 210.4 |
| D | 11 | 129 | 289965 | 1344.66 | 767 | 732 | 215.1 |
| D | 11 | 176 | 209298 | 969.64 | 767 | 732 | 215.1 |
| D | 3 | 12 | 60846 | 279.47 | 767 | 732 | 215.1 |
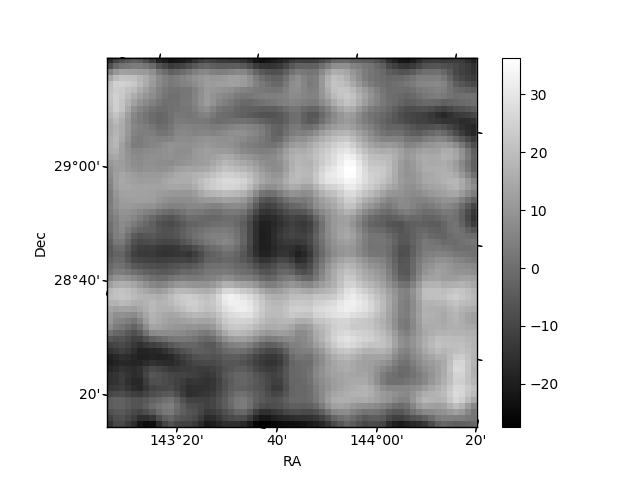
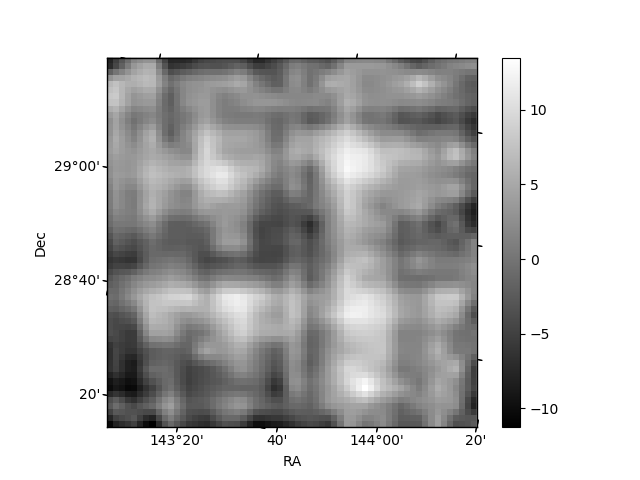
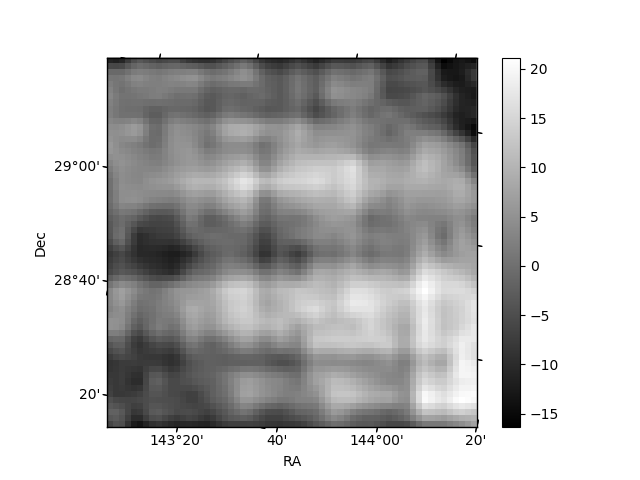
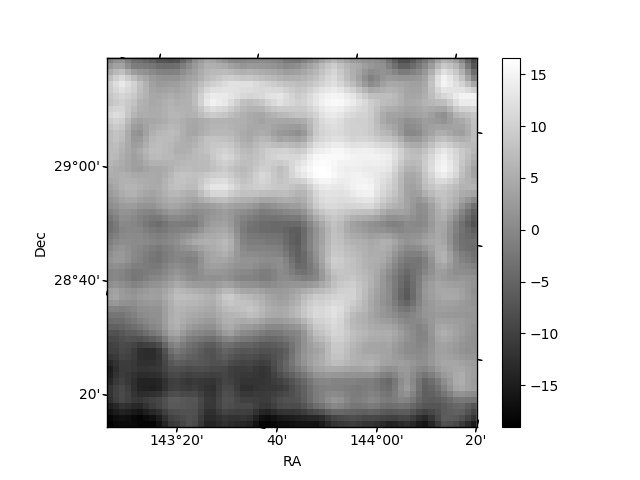
Histogram calculated using DETX and DETY for each event in the final _common_clean file
| Quadrant A | 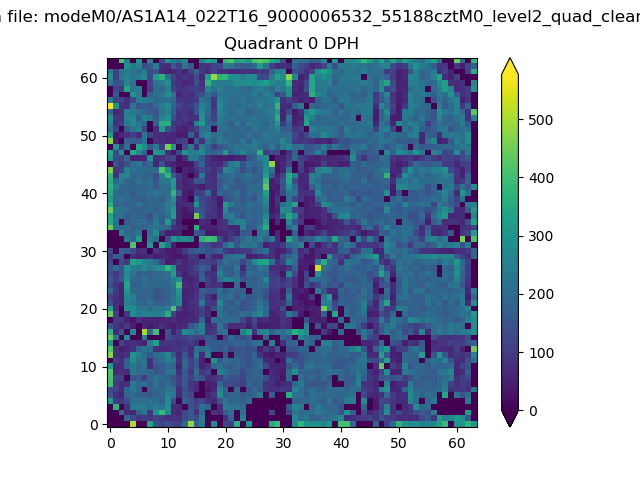 |
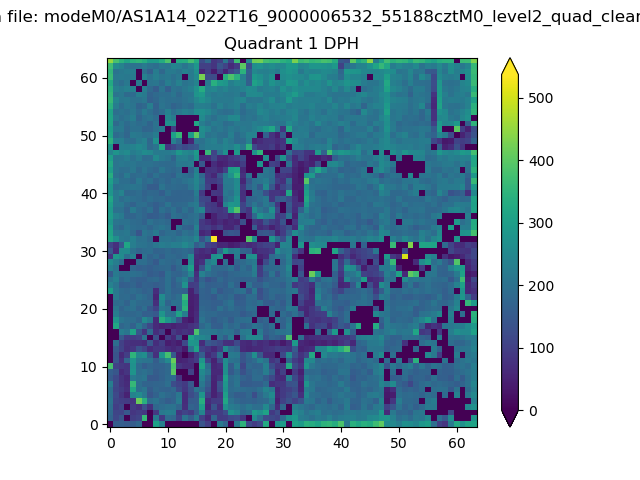 |
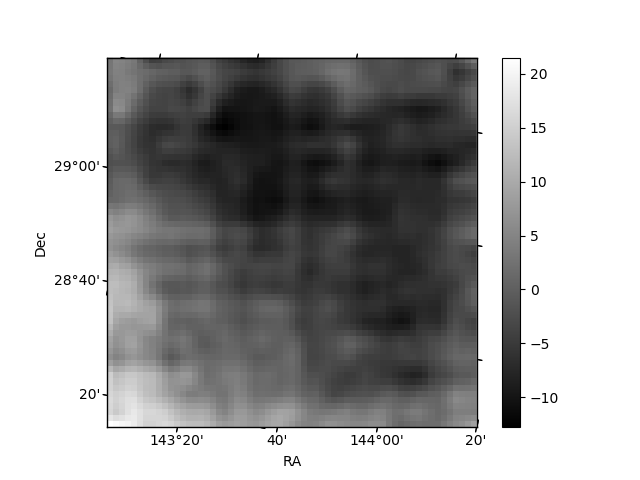
Quadrant B |
|---|---|---|---|
| Quadrant D | 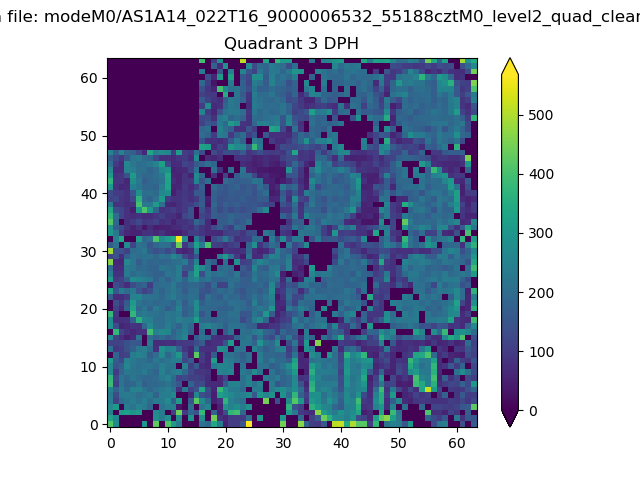 |
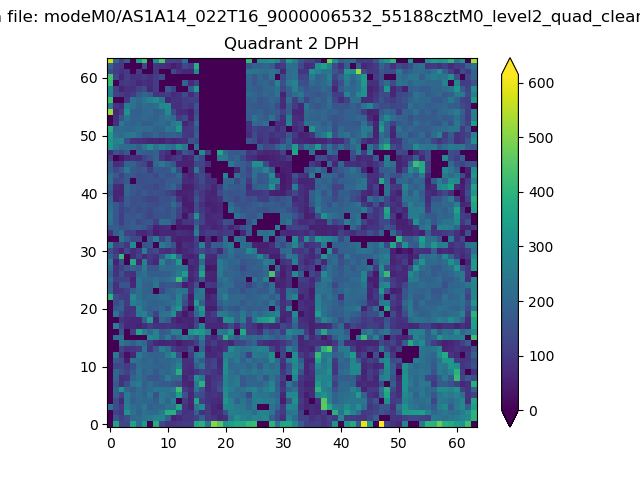 |
Quadrant C |
| Plot type | Count rate plots | Images |
|---|---|---|
| Comparison with Poisson distribution Blue bars denote a histogram of data divided into 1 sec bins. Red curve is a Poisson curve with rate = median count rate of data. |
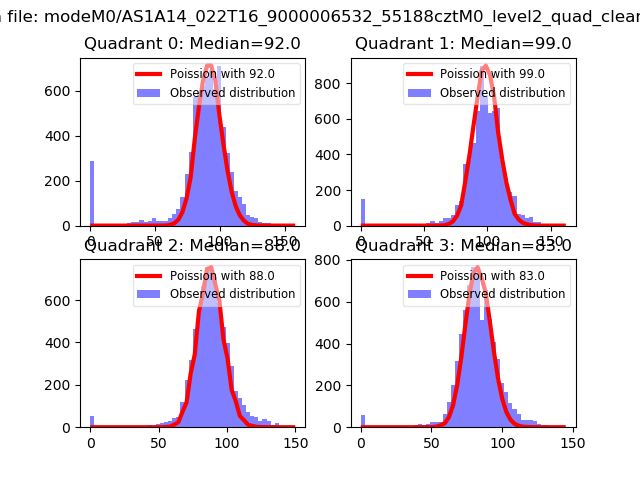 |
 |
| Quadrant-wise count rates Data is divided into 100 sec bins |
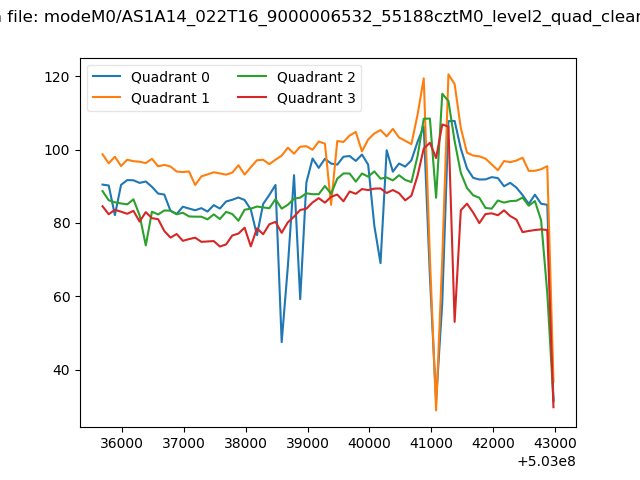 |
|
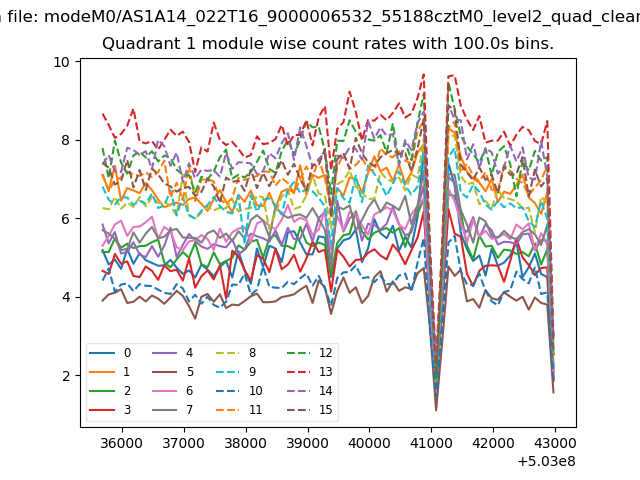
| Module-wise count rates for Quadrant A Data is divided into 100 sec bins |
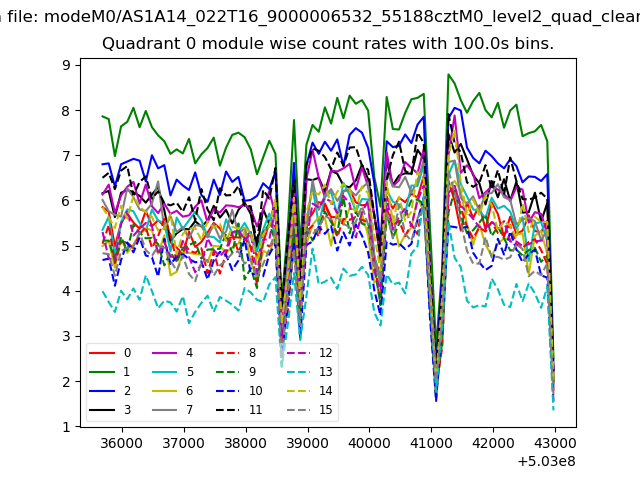 |
 |
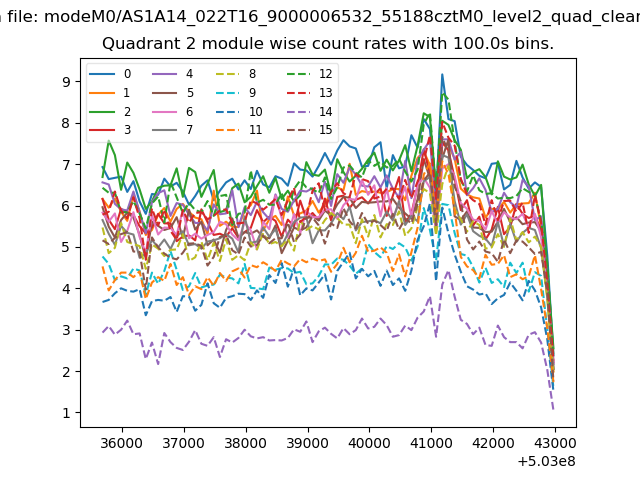
| Module-wise count rates for Quadrant B Data is divided into 100 sec bins |
 |
 |
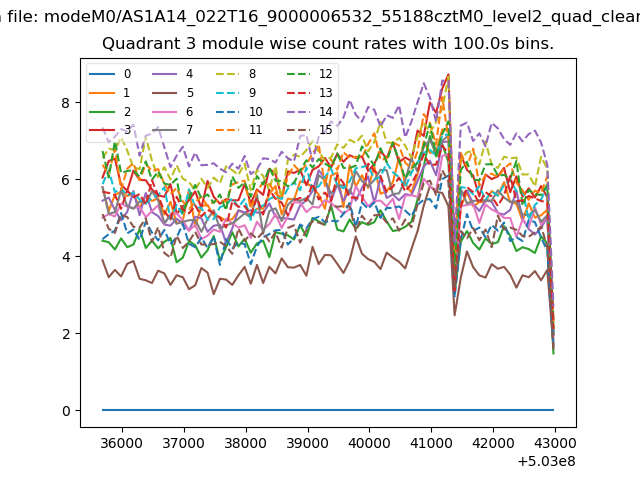
| Module-wise count rates for Quadrant C Data is divided into 100 sec bins |
 |
 |
| Module-wise count rates for Quadrant D Data is divided into 100 sec bins |
 |
 |
| Parameter | Plot |
|---|---|
| CZT HV Monitor | 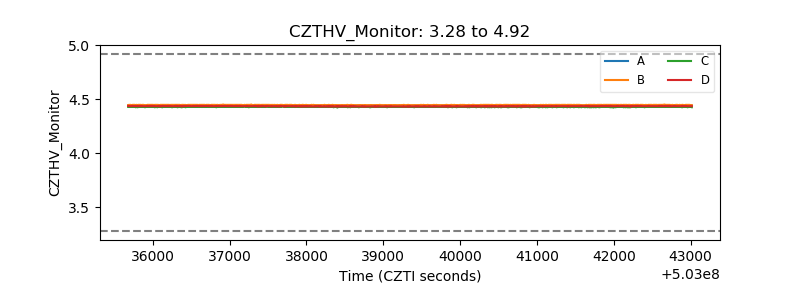 |
| D_VDD | 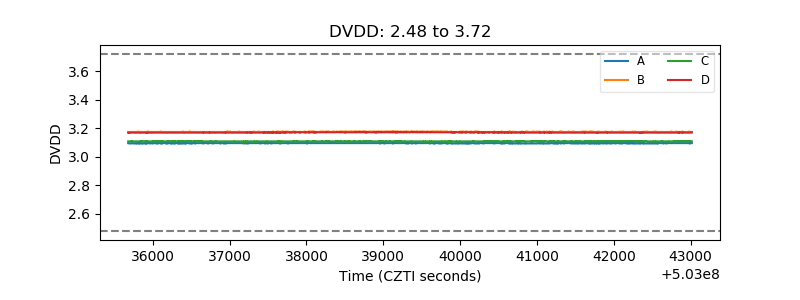 |
| Temperature 1 | 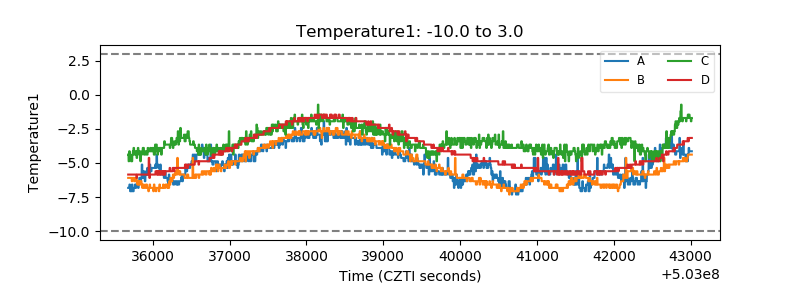 |
| Veto HV Monitor | 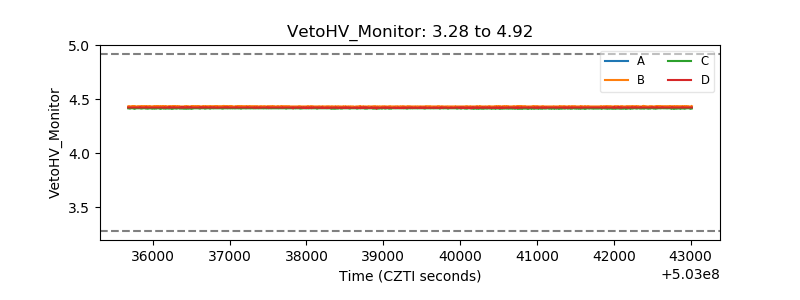 |
| Veto LLD | 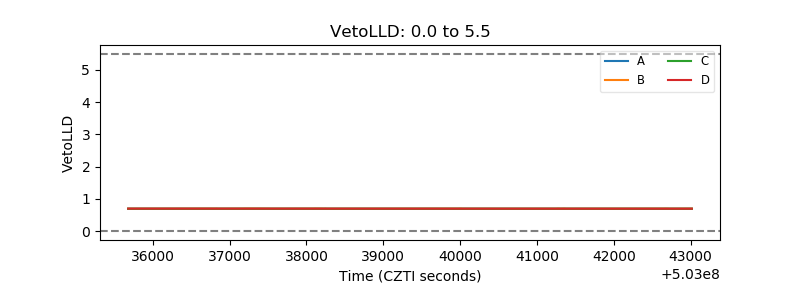 |
| Alpha Counter | 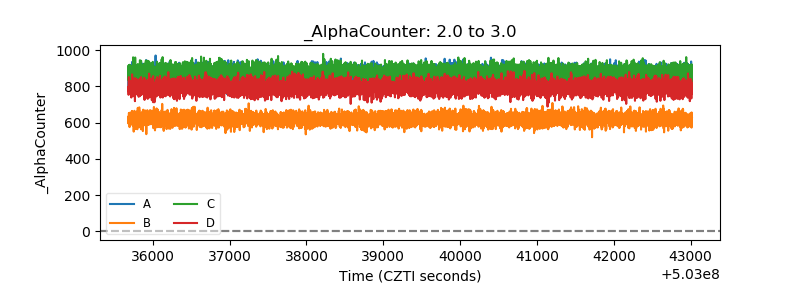 |
| _CPM_Rate | 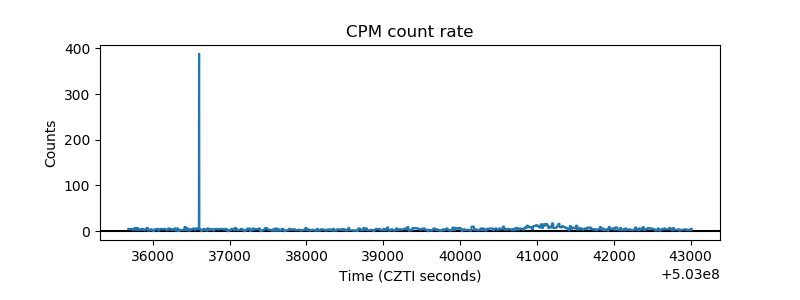 |
| CZT Counter | 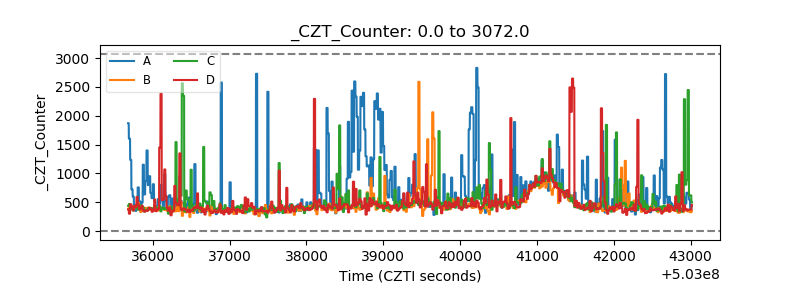 |
| +2.5 Volts monitor |  |
| +5 Volts monitor | 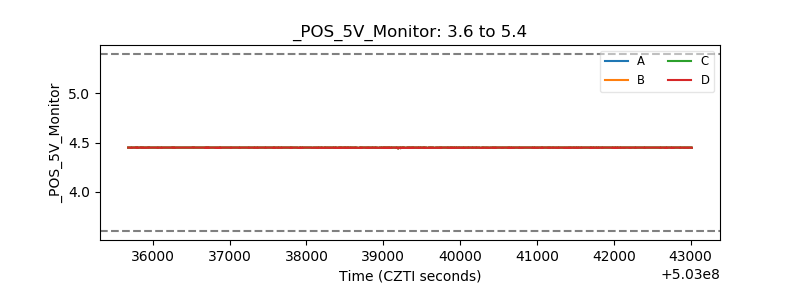 |
| _ROLL_ROT | 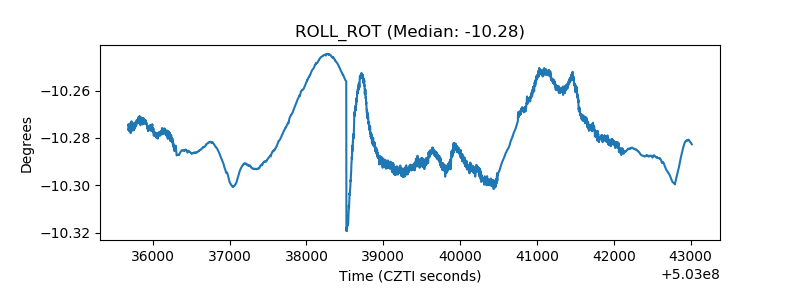 |
| _Roll_DEC | 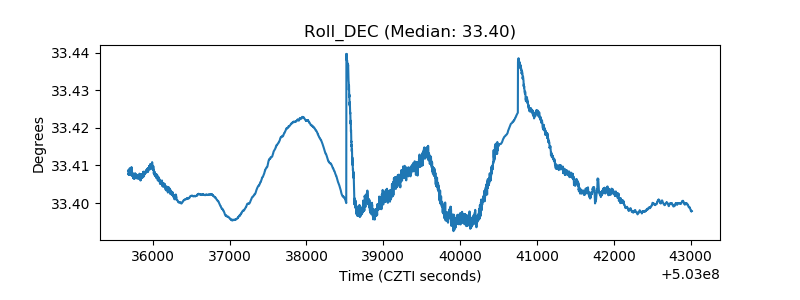 |
| _Roll_RA | 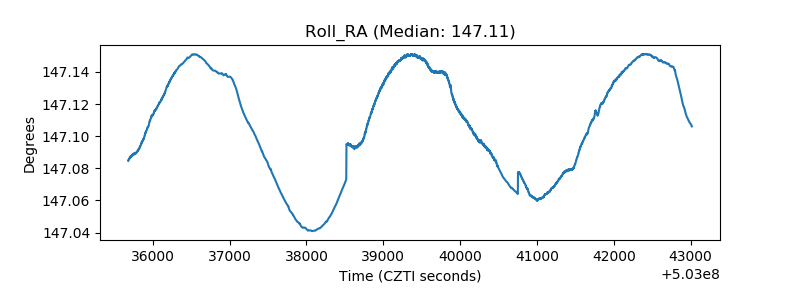 |
| Veto Counter | 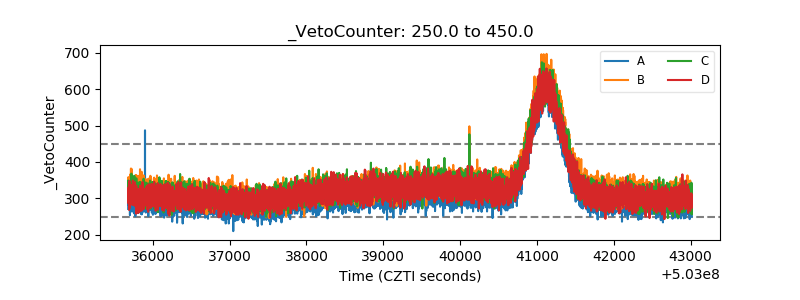 |