| Param | Original file | Final file |
|---|---|---|
| Filename | modeM0/AS1A14_022T16_9000006532_55189cztM0_level2.fits | modeM0/AS1A14_022T16_9000006532_55189cztM0_level2_quad_clean.evt |
| Size (bytes) | 572,241,600 | 115,871,040 |
| Size | 545.7 MB | 110.5 MB |
| Events in quadrant A | 5,839,590 | 735,789 |
| Events in quadrant B | 5,249,432 | 764,496 |
| Events in quadrant C | 4,267,774 | 735,398 |
| Events in quadrant D | 5,171,239 | 687,926 |
| Mode SS | |||
|---|---|---|---|
| Quadrant | BADHDUFLAG | Total packets | Discarded packets |
| A | 0 | 168 | 0 |
| B | 0 | 168 | 0 |
| C | 0 | 168 | 0 |
| D | 0 | 168 | 0 |
| Mode M0 | |||
|---|---|---|---|
| Quadrant | BADHDUFLAG | Total packets | Discarded packets |
| A | 0 | 23260 | 0 |
| B | 0 | 22047 | 0 |
| C | 0 | 18944 | 0 |
| D | 0 | 21592 | 0 |
| Quadrant | Total seconds | Saturated seconds | Saturation percentage |
|---|---|---|---|
| A | 8420 | 638 | 7.577197% |
| B | 8420 | 872 | 10.356295% |
| C | 8420 | 184 | 2.185273% |
| D | 8419 | 292 | 3.468345% |
Noise dominated data is calculated using 1-second bins in cleaned event files. If a bin has >2000 counts, and if more than 50% of those come from <1% of pixels, then it is considered to be noise-dominated and hence unusable.
| Quadrant | # 1 sec bins | Bins with >0 counts | Bins with >2000 counts | High rate bins dominated by noise | Noise dominated (total time) | Noise dominated (detector-on time) | Marked lightcurve |
|---|---|---|---|---|---|---|---|
| A | 8420 | 8420 | 331 | 331 | 3.93% | 3.93% | 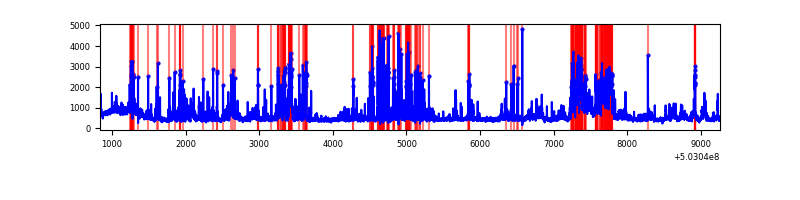 |
| B | 8420 | 8420 | 465 | 465 | 5.52% | 5.52% | 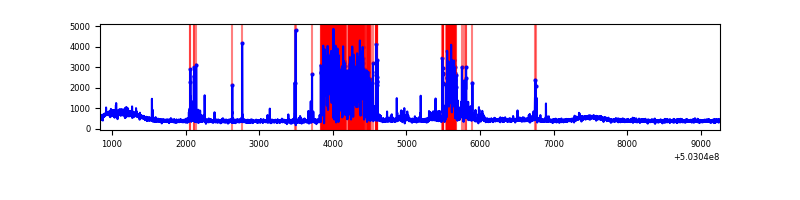 |
| C | 8420 | 8420 | 82 | 82 | 0.97% | 0.97% | 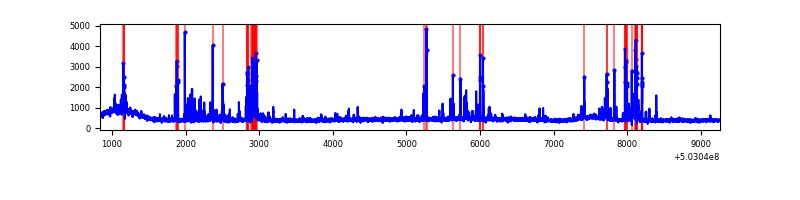 |
| D | 8419 | 8419 | 182 | 182 | 2.16% | 2.16% | 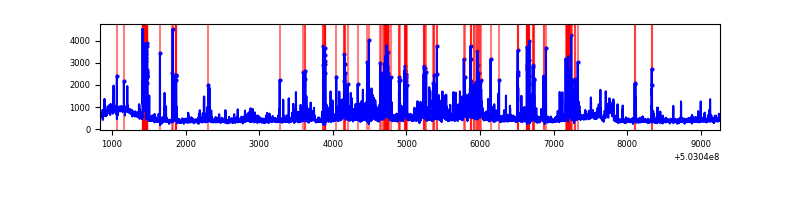 |
Top three noisy pixels from each quadrant. If the there are fewer than three noisy pixels in the level2.evt file, extra rows are filled as -1
| Pixel properties | Quadrant properties | ||||||
|---|---|---|---|---|---|---|---|
| Quadrant | DetID | PixID | Counts | Sigma | Mean | Median | Sigma |
| A | 3 | 78 | 1307418 | 5881.29 | 898 | 875 | 222.2 |
| A | 0 | 8 | 503095 | 2260.7 | 898 | 875 | 222.2 |
| A | 4 | 249 | 364183 | 1635.4 | 898 | 875 | 222.2 |
| B | 5 | 185 | 1600221 | 8468.76 | 871 | 839 | 188.9 |
| B | 10 | 247 | 93204 | 489.07 | 871 | 839 | 188.9 |
| B | 2 | 249 | 67681 | 353.93 | 871 | 839 | 188.9 |
| C | 13 | 3 | 212382 | 877.25 | 880 | 873 | 241.1 |
| C | 1 | 16 | 196144 | 809.9 | 880 | 873 | 241.1 |
| C | 10 | 22 | 168988 | 697.27 | 880 | 873 | 241.1 |
| D | 11 | 129 | 885013 | 3584.44 | 880 | 843 | 246.7 |
| D | 2 | 249 | 457688 | 1852.06 | 880 | 843 | 246.7 |
| D | 11 | 176 | 94693 | 380.47 | 880 | 843 | 246.7 |
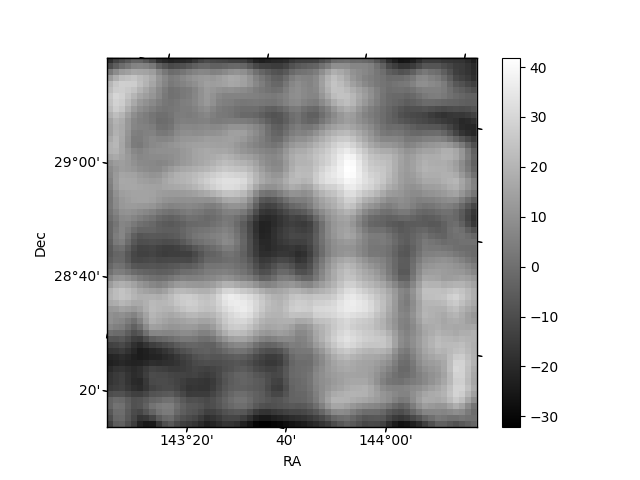
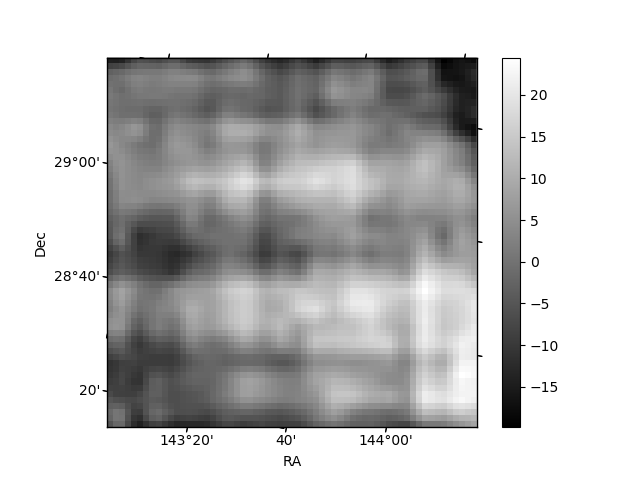
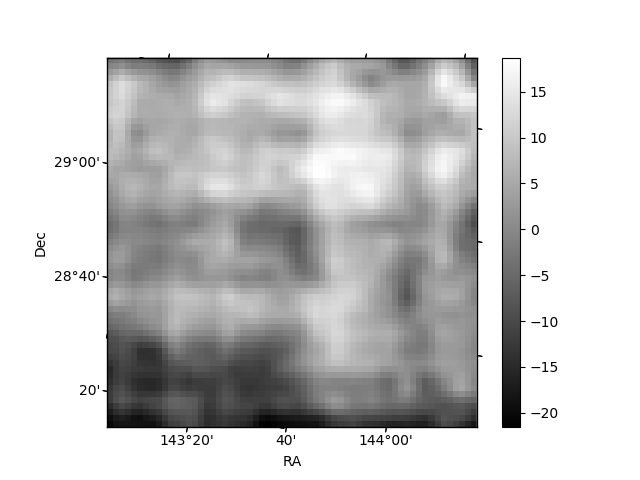
Histogram calculated using DETX and DETY for each event in the final _common_clean file
| Quadrant A | 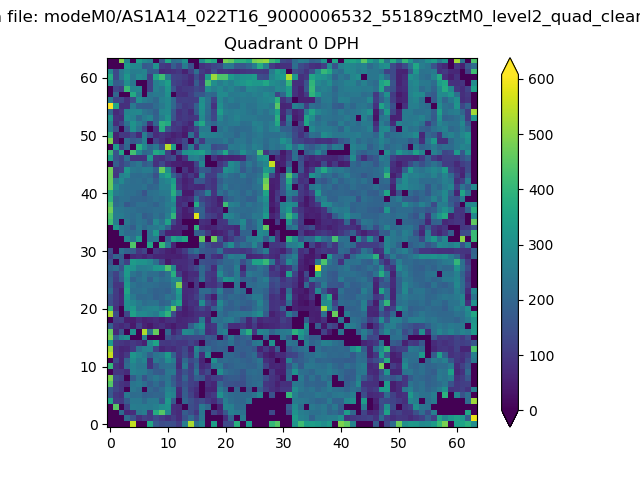 |
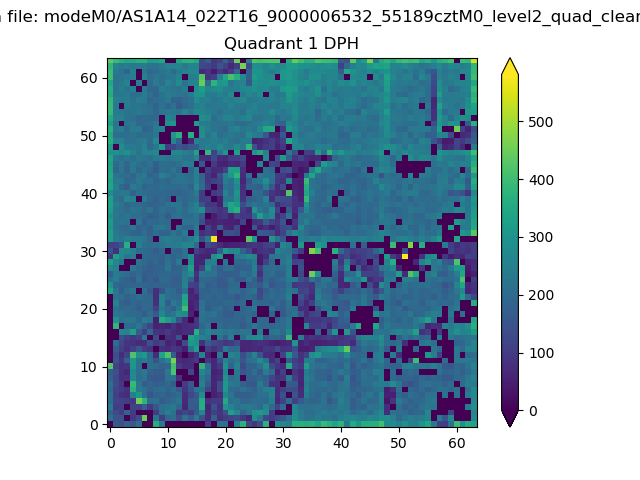 |
Quadrant B |
|---|---|---|---|
| Quadrant D | 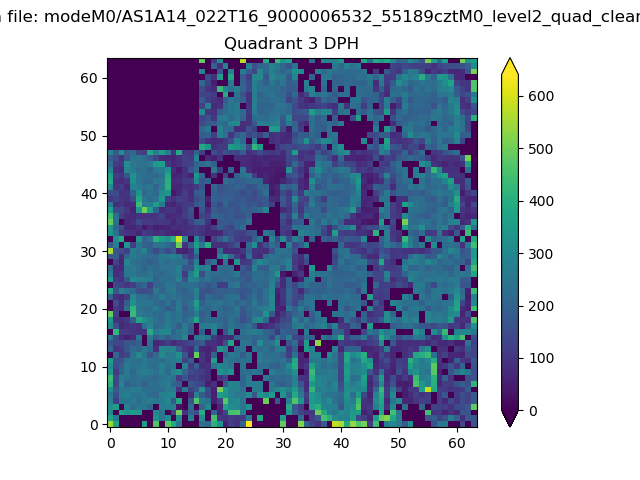 |
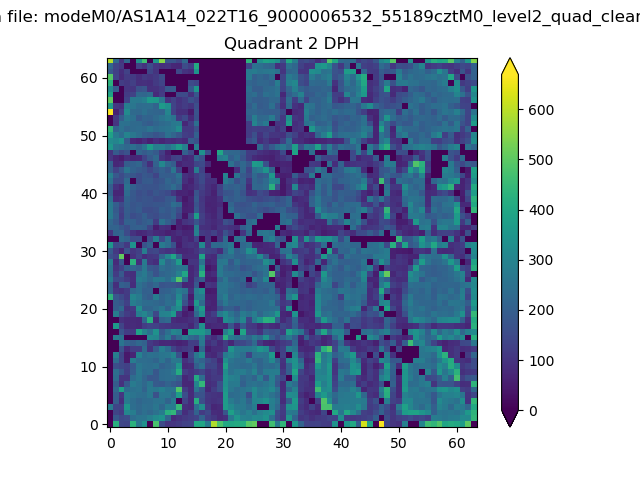 |
Quadrant C |
| Plot type | Count rate plots | Images |
|---|---|---|
| Comparison with Poisson distribution Blue bars denote a histogram of data divided into 1 sec bins. Red curve is a Poisson curve with rate = median count rate of data. |
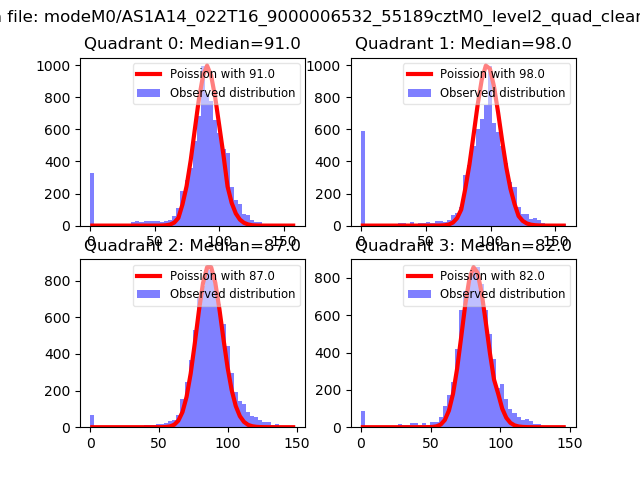 |
 |
| Quadrant-wise count rates Data is divided into 100 sec bins |
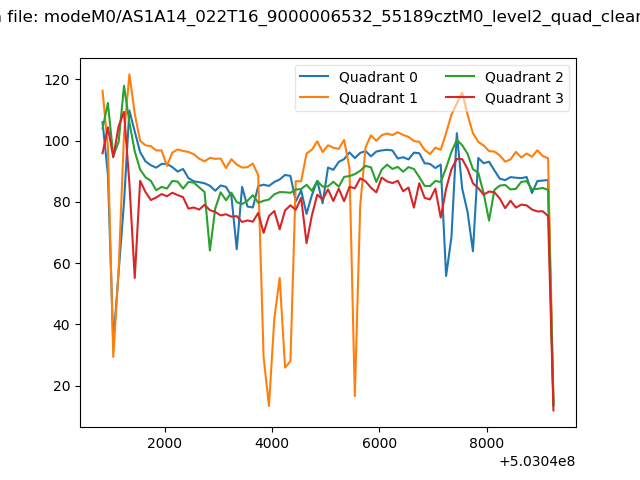 |
|
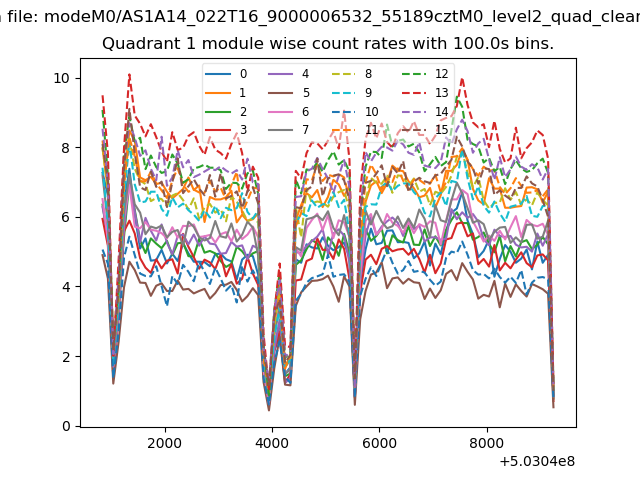
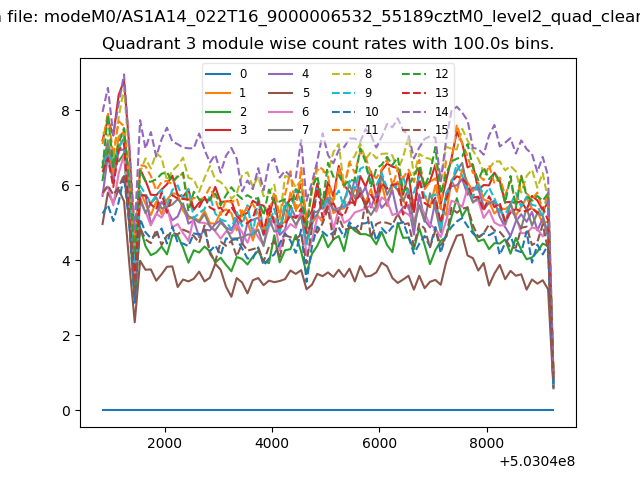
| Module-wise count rates for Quadrant A Data is divided into 100 sec bins |
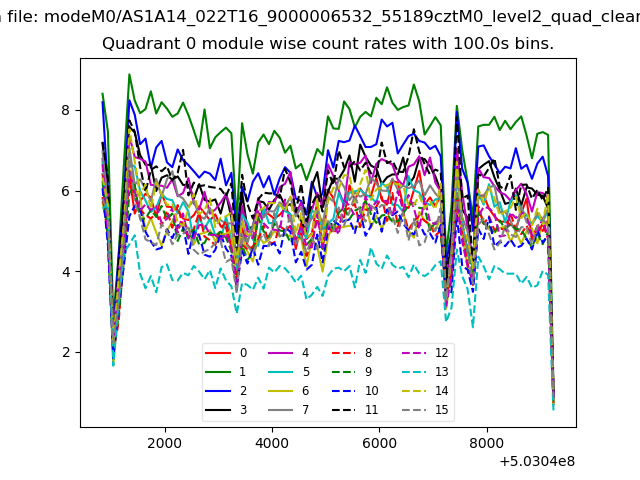 |
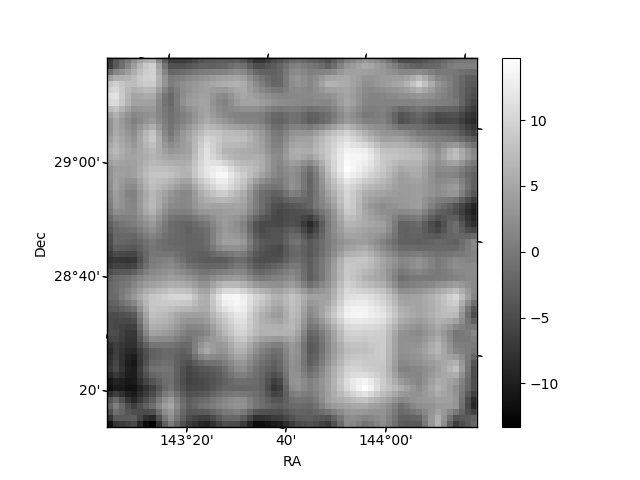 |
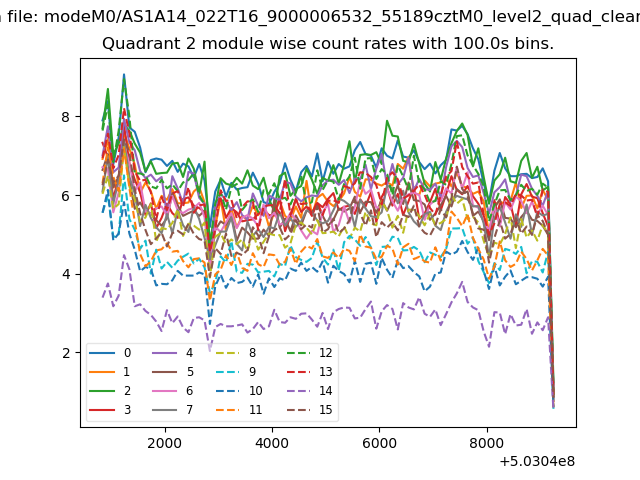
| Module-wise count rates for Quadrant B Data is divided into 100 sec bins |
 |
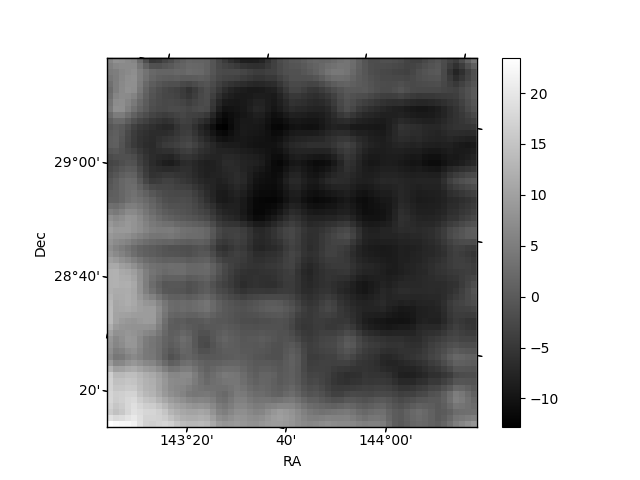 |
| Module-wise count rates for Quadrant C Data is divided into 100 sec bins |
 |
 |
| Module-wise count rates for Quadrant D Data is divided into 100 sec bins |
 |
 |
| Parameter | Plot |
|---|---|
| CZT HV Monitor | 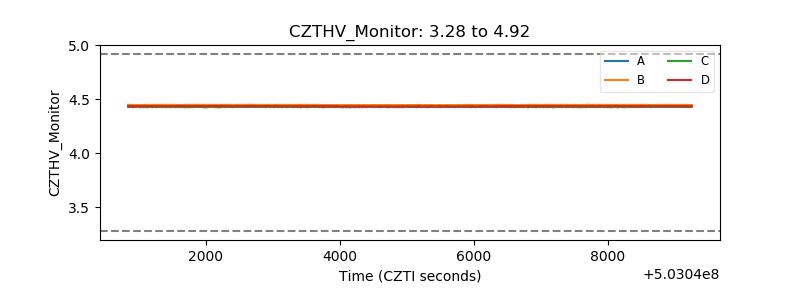 |
| D_VDD | 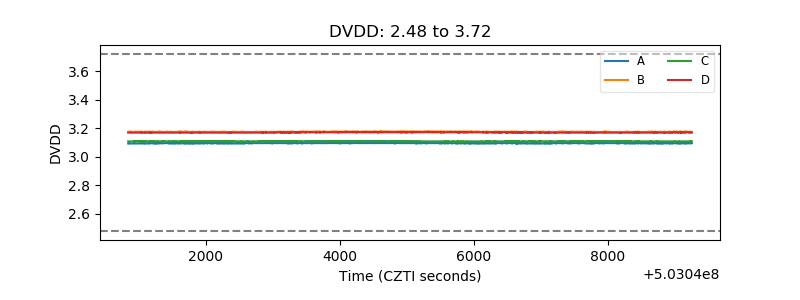 |
| Temperature 1 | 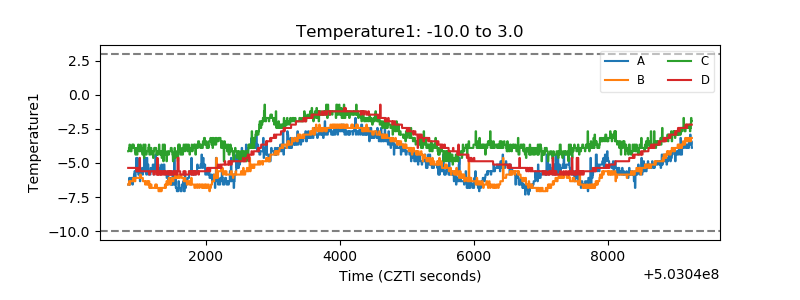 |
| Veto HV Monitor | 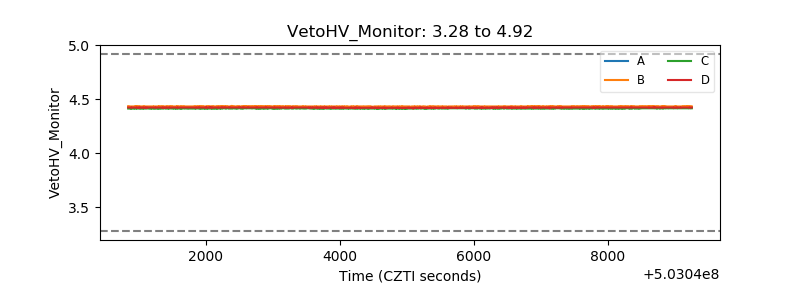 |
| Veto LLD | 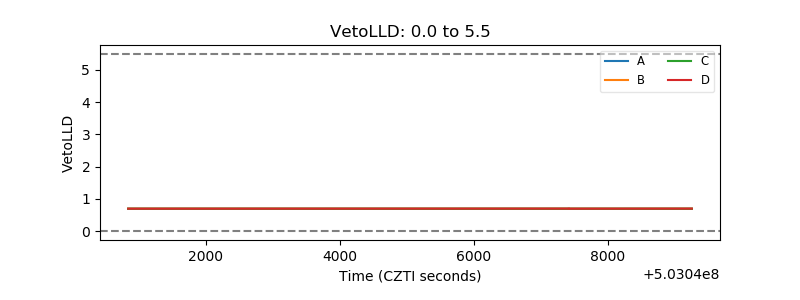 |
| Alpha Counter | 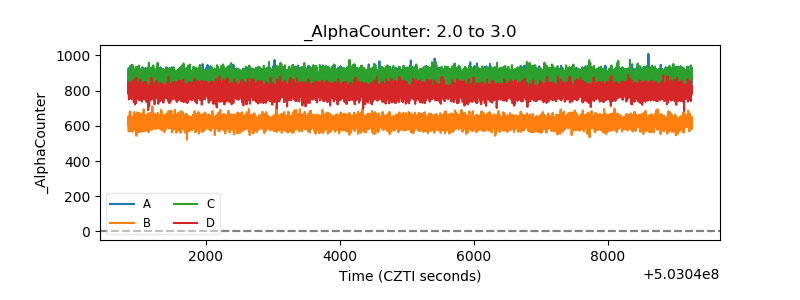 |
| _CPM_Rate | 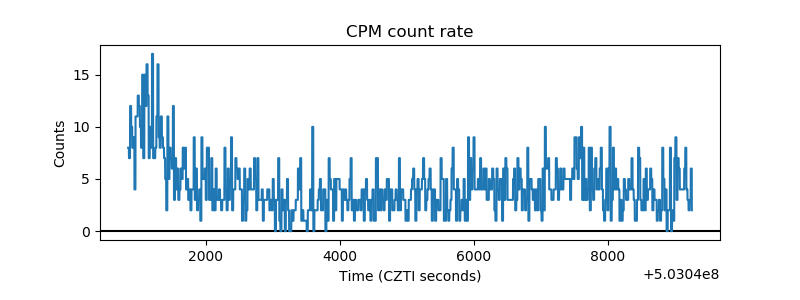 |
| CZT Counter | 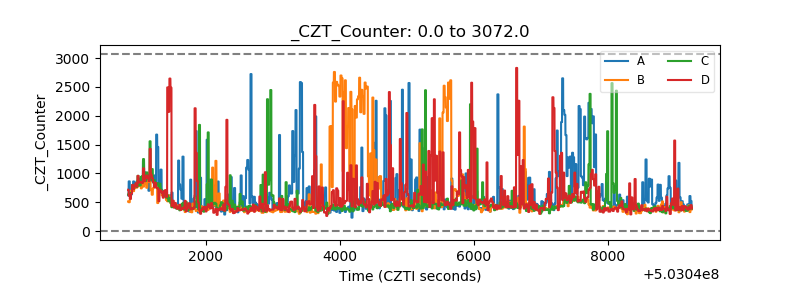 |
| +2.5 Volts monitor |  |
| +5 Volts monitor | 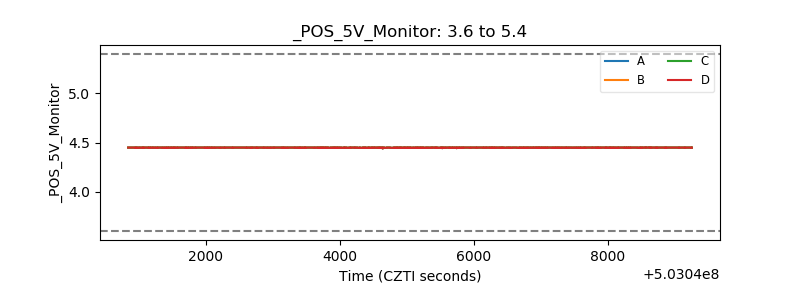 |
| _ROLL_ROT | 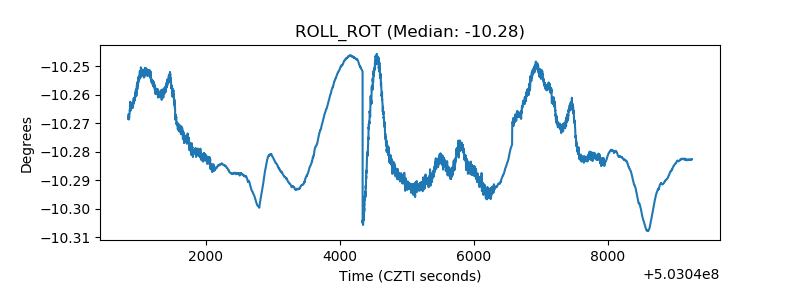 |
| _Roll_DEC | 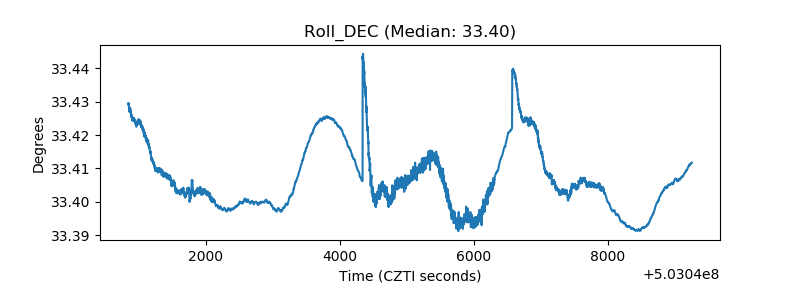 |
| _Roll_RA | 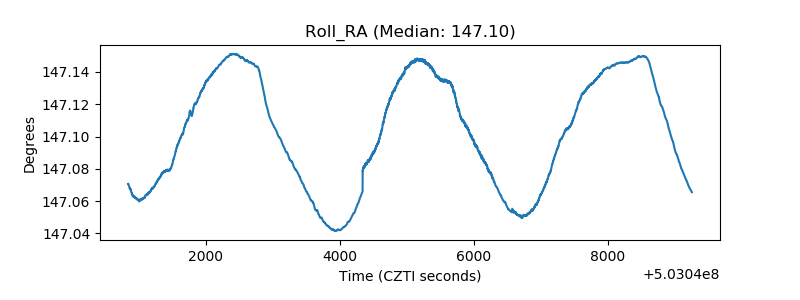 |
| Veto Counter | 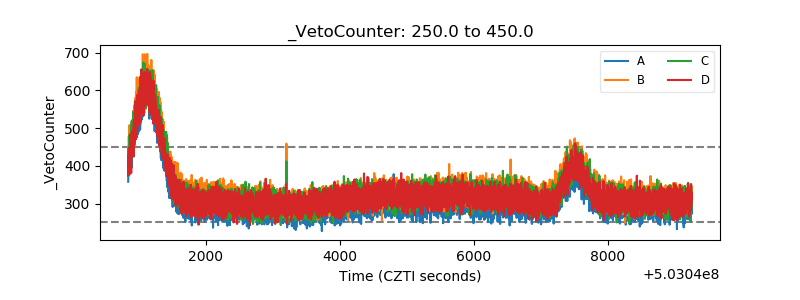 |