| Param | Original file | Final file |
|---|---|---|
| Filename | modeM0/AS1A14_022T16_9000006532_55190cztM0_level2.fits | modeM0/AS1A14_022T16_9000006532_55190cztM0_level2_quad_clean.evt |
| Size (bytes) | 476,758,080 | 113,875,200 |
| Size | 454.7 MB | 108.6 MB |
| Events in quadrant A | 4,855,220 | 727,474 |
| Events in quadrant B | 3,566,725 | 799,735 |
| Events in quadrant C | 3,939,111 | 698,860 |
| Events in quadrant D | 4,656,094 | 657,875 |
| Mode SS | |||
|---|---|---|---|
| Quadrant | BADHDUFLAG | Total packets | Discarded packets |
| A | 0 | 162 | 0 |
| B | 0 | 162 | 0 |
| C | 0 | 164 | 0 |
| D | 0 | 164 | 0 |
| Mode M0 | |||
|---|---|---|---|
| Quadrant | BADHDUFLAG | Total packets | Discarded packets |
| A | 0 | 20197 | 0 |
| B | 0 | 16888 | 0 |
| C | 0 | 17827 | 0 |
| D | 0 | 19768 | 0 |
| Quadrant | Total seconds | Saturated seconds | Saturation percentage |
|---|---|---|---|
| A | 8114 | 249 | 3.068770% |
| B | 8114 | 54 | 0.665516% |
| C | 8113 | 107 | 1.318871% |
| D | 8114 | 142 | 1.750062% |
Noise dominated data is calculated using 1-second bins in cleaned event files. If a bin has >2000 counts, and if more than 50% of those come from <1% of pixels, then it is considered to be noise-dominated and hence unusable.
| Quadrant | # 1 sec bins | Bins with >0 counts | Bins with >2000 counts | High rate bins dominated by noise | Noise dominated (total time) | Noise dominated (detector-on time) | Marked lightcurve |
|---|---|---|---|---|---|---|---|
| A | 8114 | 8114 | 177 | 177 | 2.18% | 2.18% | 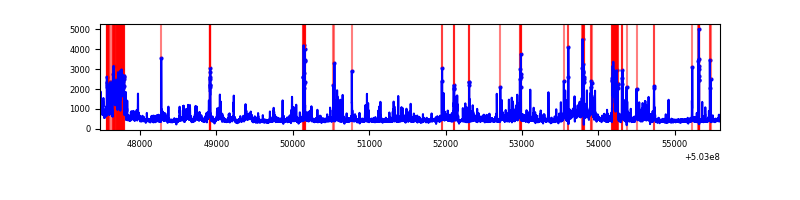 |
| B | 8114 | 8114 | 34 | 34 | 0.42% | 0.42% | 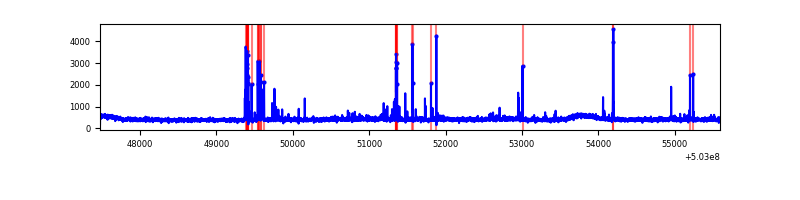 |
| C | 8113 | 8113 | 91 | 91 | 1.12% | 1.12% | 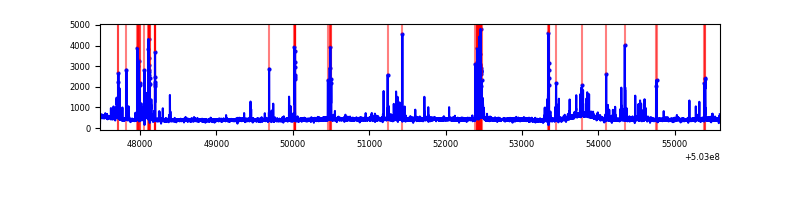 |
| D | 8114 | 8114 | 144 | 144 | 1.77% | 1.77% | 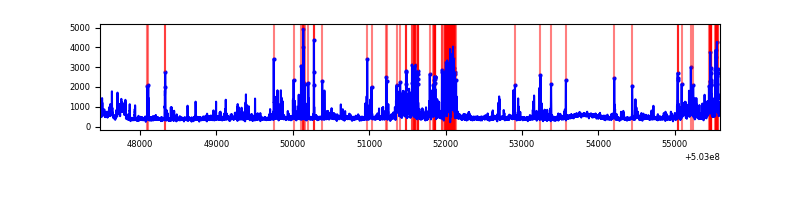 |
Top three noisy pixels from each quadrant. If the there are fewer than three noisy pixels in the level2.evt file, extra rows are filled as -1
| Pixel properties | Quadrant properties | ||||||
|---|---|---|---|---|---|---|---|
| Quadrant | DetID | PixID | Counts | Sigma | Mean | Median | Sigma |
| A | 3 | 78 | 1090265 | 5252.61 | 836 | 816 | 207.4 |
| A | 4 | 249 | 223111 | 1071.76 | 836 | 816 | 207.4 |
| A | 3 | 45 | 89909 | 429.55 | 836 | 816 | 207.4 |
| B | 2 | 249 | 92318 | 502.92 | 835 | 803 | 182.0 |
| B | 10 | 247 | 74092 | 402.76 | 835 | 803 | 182.0 |
| B | 4 | 81 | 50712 | 274.28 | 835 | 803 | 182.0 |
| C | 13 | 3 | 409638 | 1853.13 | 810 | 802 | 220.6 |
| C | 1 | 16 | 178080 | 803.55 | 810 | 802 | 220.6 |
| C | 14 | 254 | 53360 | 238.23 | 810 | 802 | 220.6 |
| D | 2 | 249 | 773707 | 3385.04 | 809 | 772 | 228.3 |
| D | 11 | 129 | 291422 | 1272.89 | 809 | 772 | 228.3 |
| D | 5 | 173 | 74997 | 325.07 | 809 | 772 | 228.3 |
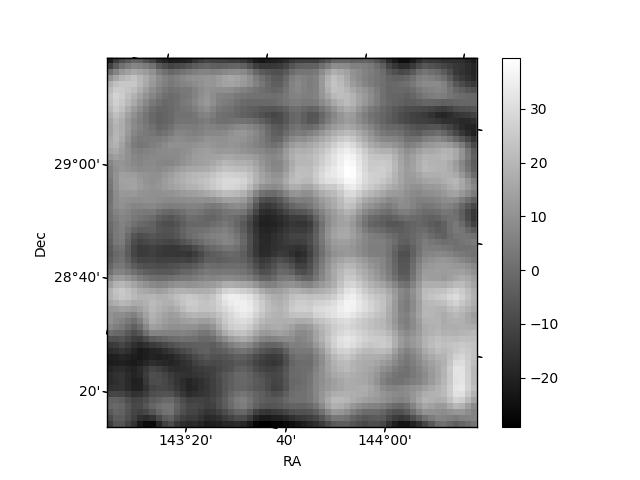
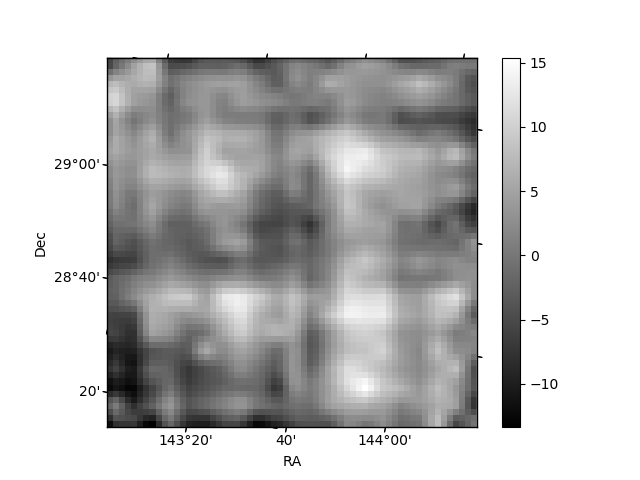
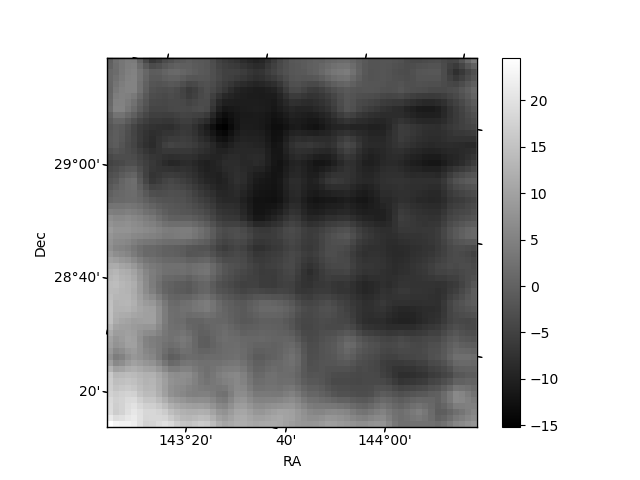
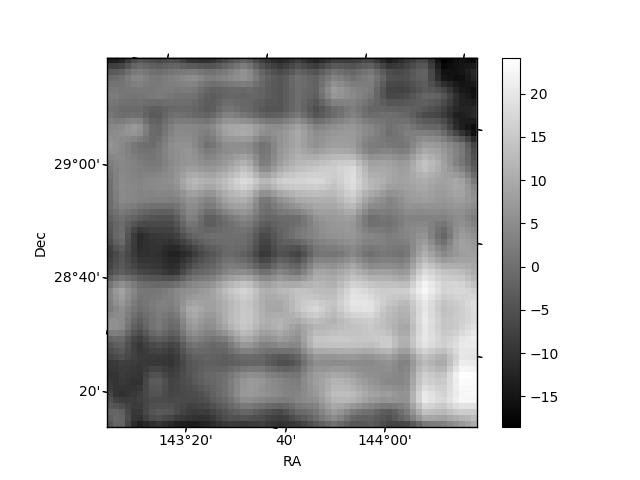
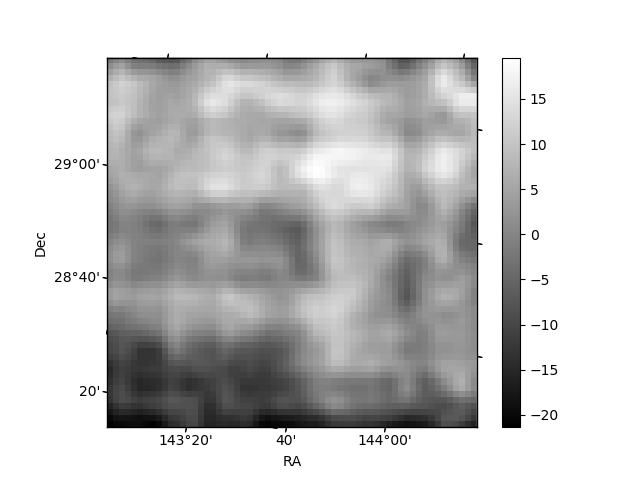
Histogram calculated using DETX and DETY for each event in the final _common_clean file
| Quadrant A | 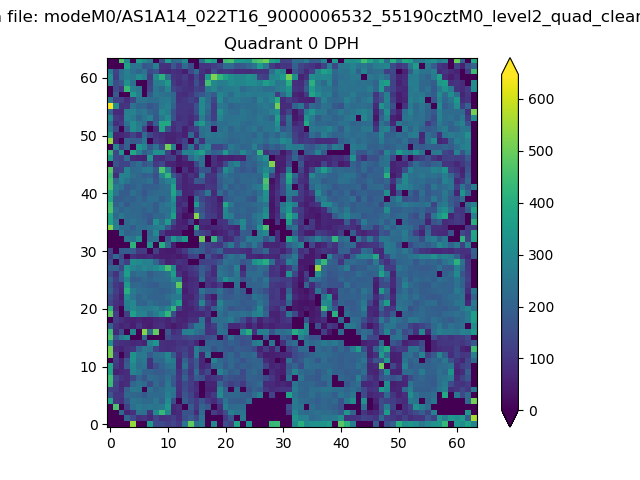 |
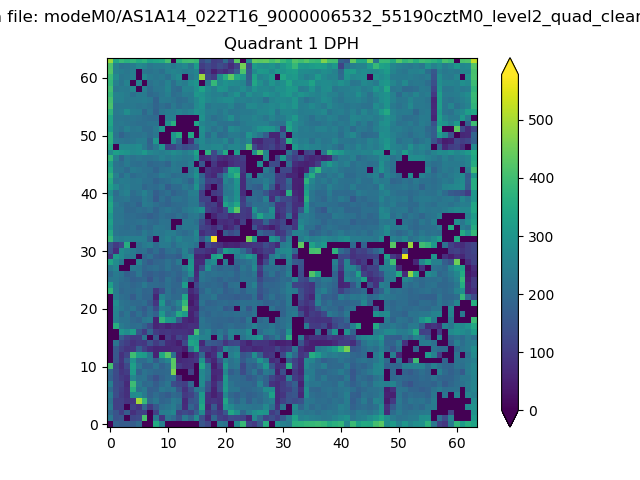 |
Quadrant B |
|---|---|---|---|
| Quadrant D | 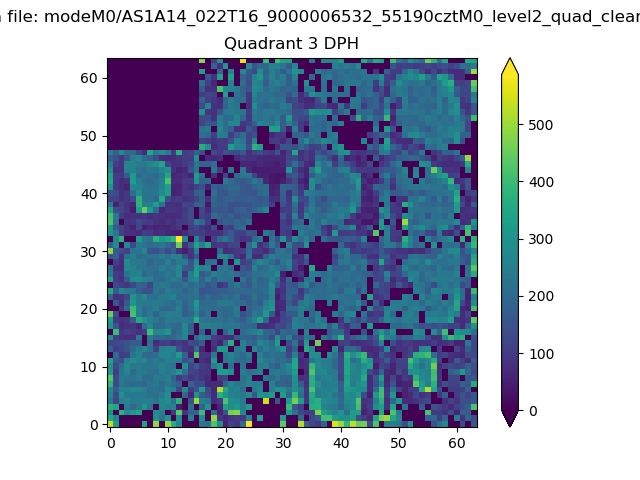 |
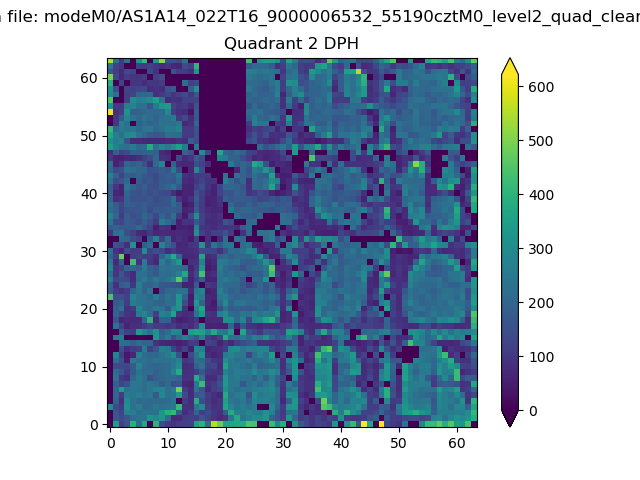 |
Quadrant C |
| Plot type | Count rate plots | Images |
|---|---|---|
| Comparison with Poisson distribution Blue bars denote a histogram of data divided into 1 sec bins. Red curve is a Poisson curve with rate = median count rate of data. |
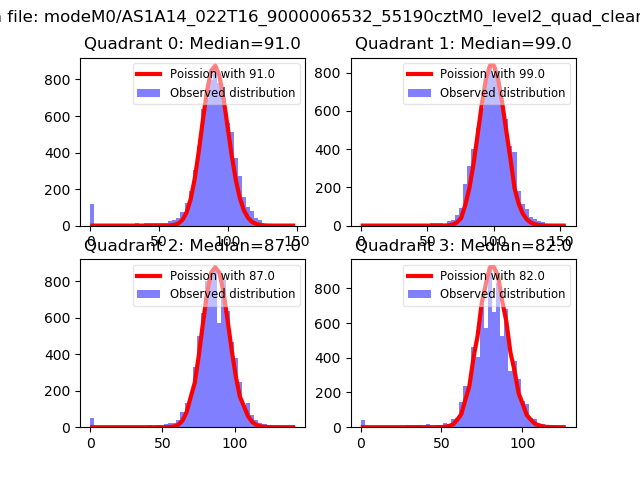 |
 |
| Quadrant-wise count rates Data is divided into 100 sec bins |
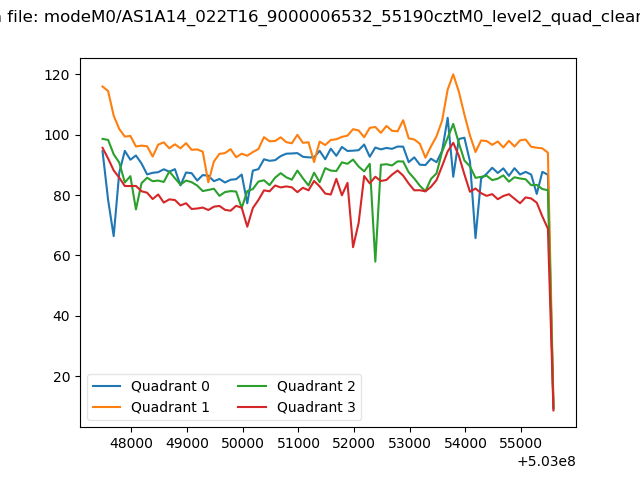 |
|
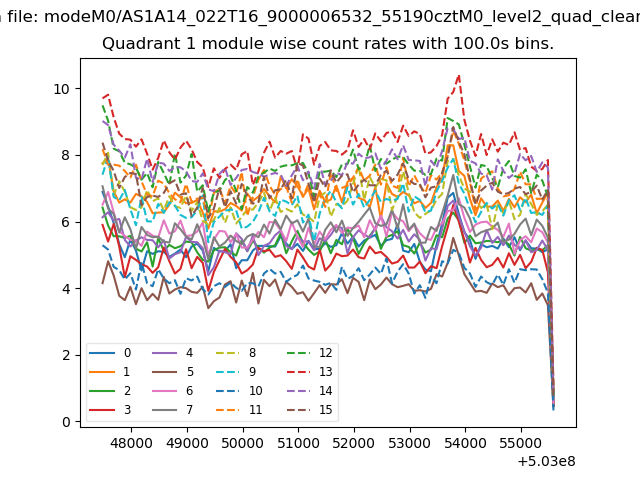
| Module-wise count rates for Quadrant A Data is divided into 100 sec bins |
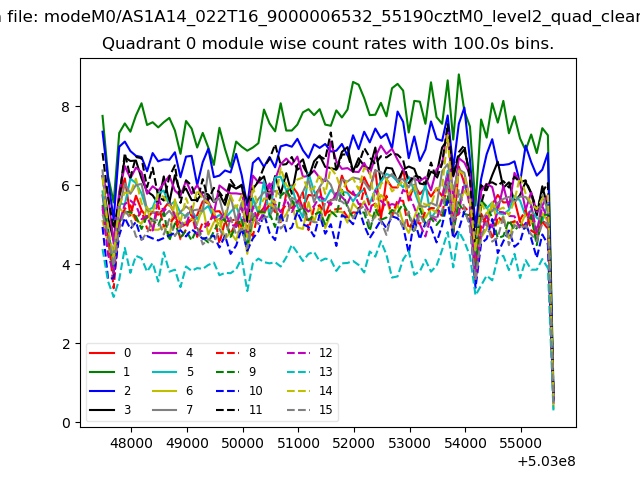 |
 |
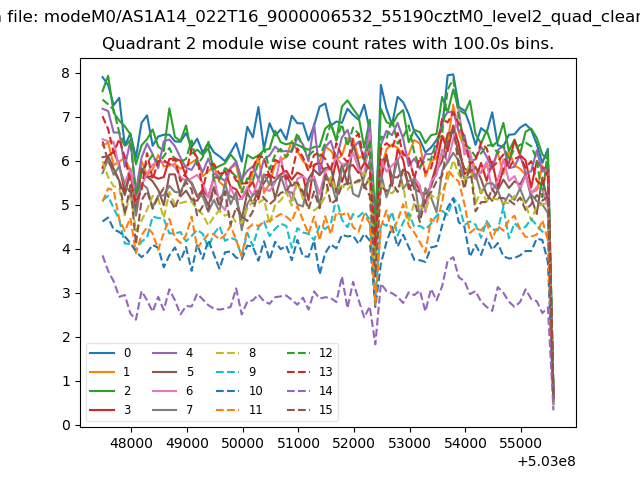
| Module-wise count rates for Quadrant B Data is divided into 100 sec bins |
 |
 |
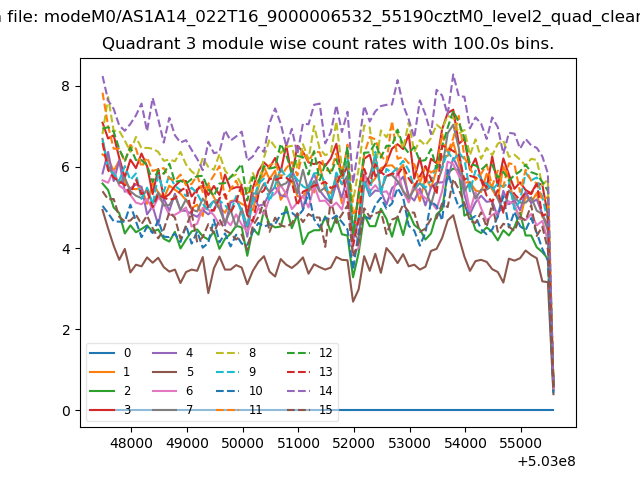
| Module-wise count rates for Quadrant C Data is divided into 100 sec bins |
 |
 |
| Module-wise count rates for Quadrant D Data is divided into 100 sec bins |
 |
 |
| Parameter | Plot |
|---|---|
| CZT HV Monitor | 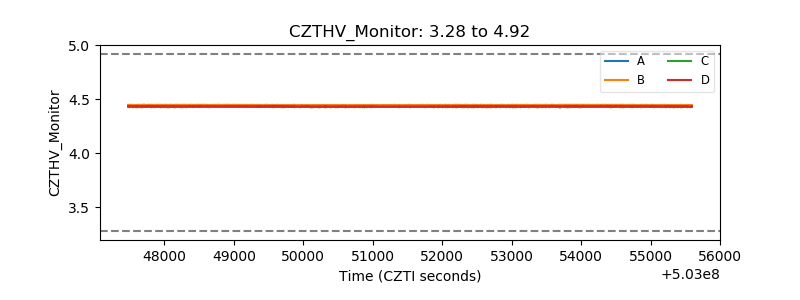 |
| D_VDD | 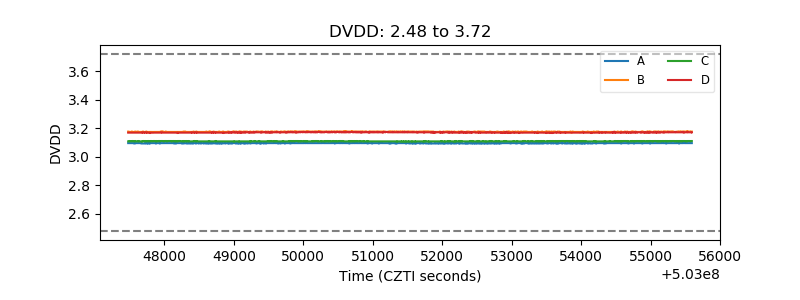 |
| Temperature 1 | 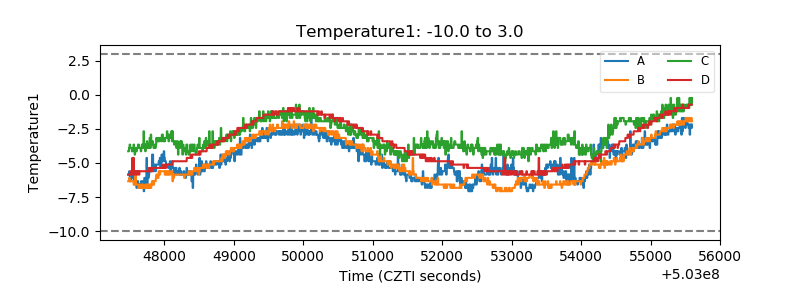 |
| Veto HV Monitor | 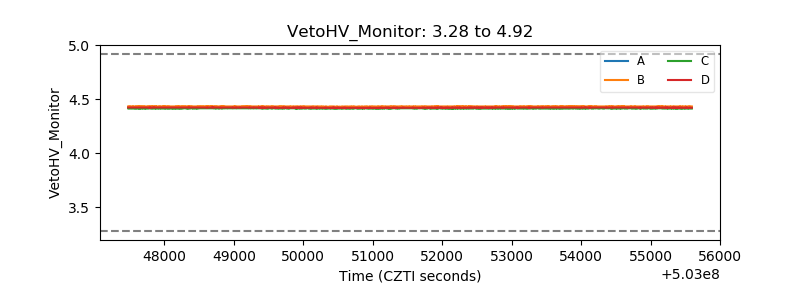 |
| Veto LLD | 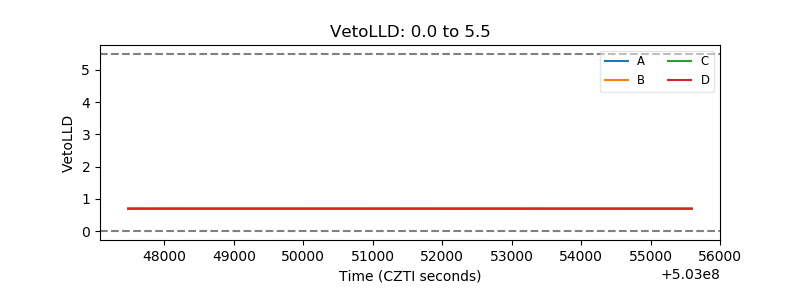 |
| Alpha Counter | 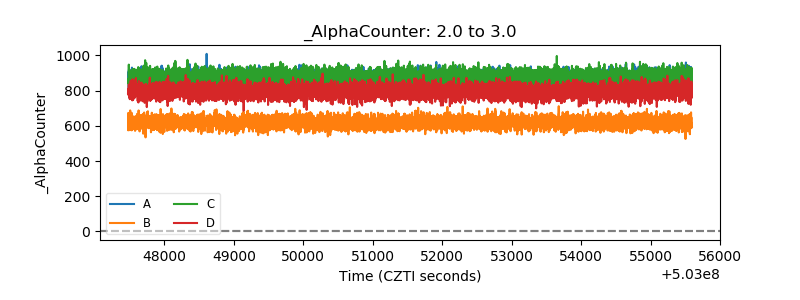 |
| _CPM_Rate | 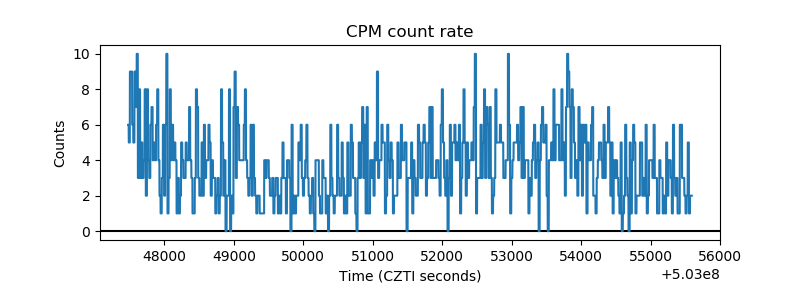 |
| CZT Counter | 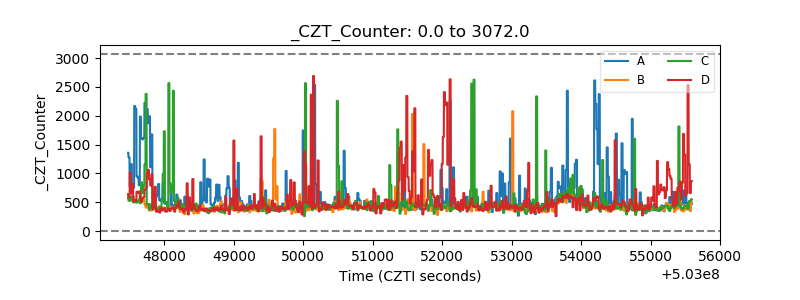 |
| +2.5 Volts monitor |  |
| +5 Volts monitor |  |
| _ROLL_ROT | 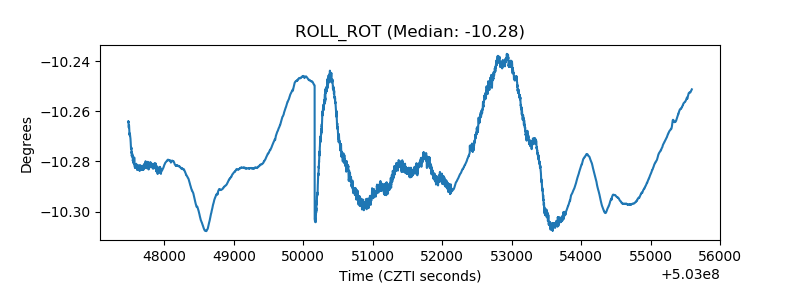 |
| _Roll_DEC | 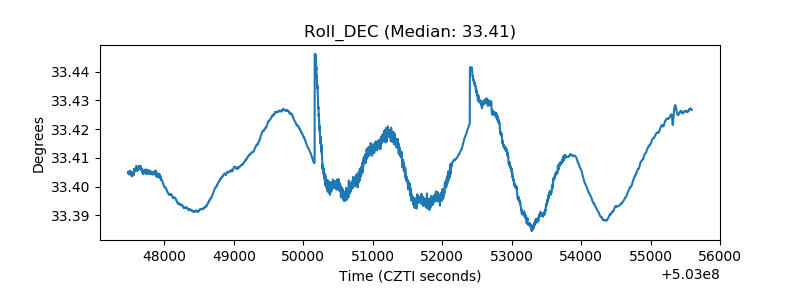 |
| _Roll_RA | 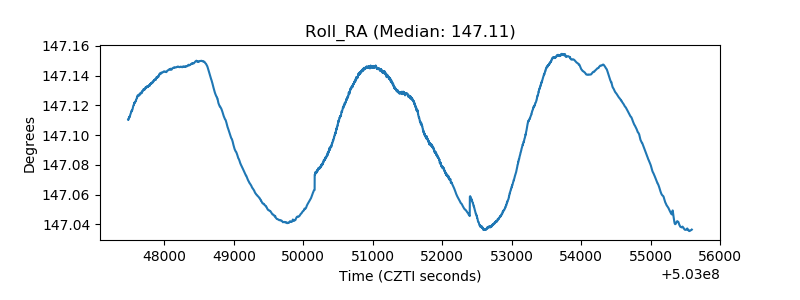 |
| Veto Counter | 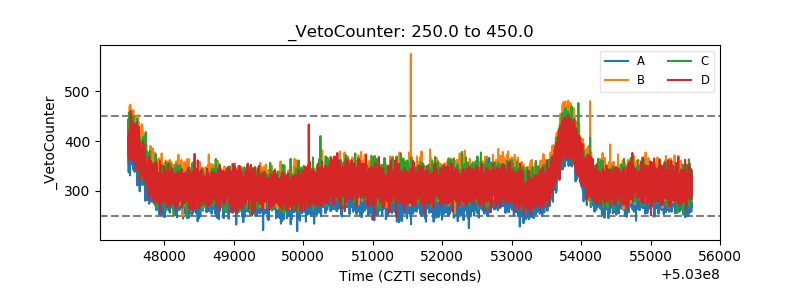 |