| Param | Original file | Final file |
|---|---|---|
| Filename | modeM0/AS1A14_022T16_9000006532_55193cztM0_level2.fits | modeM0/AS1A14_022T16_9000006532_55193cztM0_level2_quad_clean.evt |
| Size (bytes) | 1,233,319,680 | 265,541,760 |
| Size | 1.1 GB | 253.2 MB |
| Events in quadrant A | 11,268,870 | 1,716,712 |
| Events in quadrant B | 8,488,711 | 1,866,294 |
| Events in quadrant C | 9,937,489 | 1,640,553 |
| Events in quadrant D | 14,467,876 | 1,490,189 |
| Mode SS | |||
|---|---|---|---|
| Quadrant | BADHDUFLAG | Total packets | Discarded packets |
| A | 0 | 388 | 0 |
| B | 0 | 388 | 0 |
| C | 0 | 388 | 0 |
| D | 0 | 388 | 0 |
| Mode M0 | |||
|---|---|---|---|
| Quadrant | BADHDUFLAG | Total packets | Discarded packets |
| A | 0 | 47074 | 2 |
| B | 0 | 40082 | 2 |
| C | 0 | 43566 | 2 |
| D | 0 | 56726 | 2 |
| Mode M9 | |||
|---|---|---|---|
| Quadrant | BADHDUFLAG | Total packets | Discarded packets |
| A | 0 | 10 | 0 |
| B | 0 | 10 | 0 |
| C | 0 | 10 | 0 |
| D | 0 | 10 | 0 |
| Quadrant | Total seconds | Saturated seconds | Saturation percentage |
|---|---|---|---|
| A | 19245 | 732 | 3.803585% |
| B | 19245 | 343 | 1.782281% |
| C | 19246 | 453 | 2.353736% |
| D | 19246 | 1280 | 6.650733% |
Noise dominated data is calculated using 1-second bins in cleaned event files. If a bin has >2000 counts, and if more than 50% of those come from <1% of pixels, then it is considered to be noise-dominated and hence unusable.
| Quadrant | # 1 sec bins | Bins with >0 counts | Bins with >2000 counts | High rate bins dominated by noise | Noise dominated (total time) | Noise dominated (detector-on time) | Marked lightcurve |
|---|---|---|---|---|---|---|---|
| A | 20280 | 19247 | 392 | 392 | 1.93% | 2.04% | 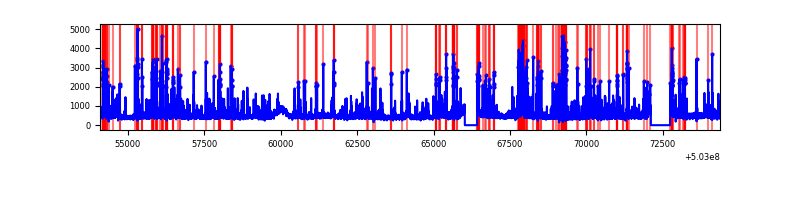 |
| B | 20280 | 19247 | 33 | 33 | 0.16% | 0.17% | 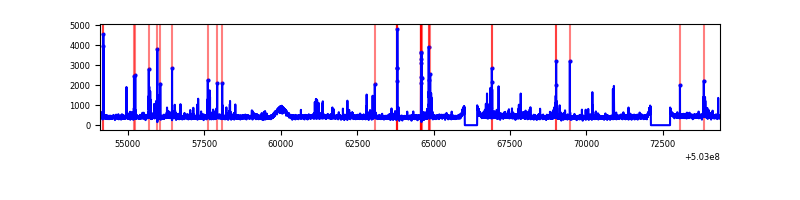 |
| C | 20281 | 19248 | 208 | 208 | 1.03% | 1.08% | 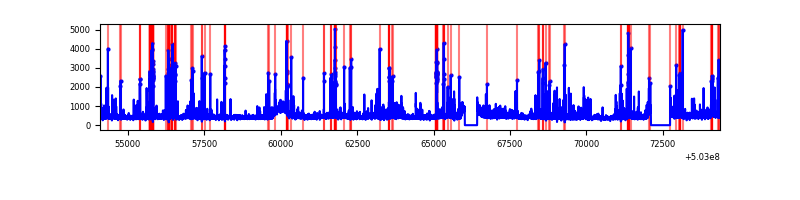 |
| D | 20281 | 19248 | 1015 | 1015 | 5.00% | 5.27% | 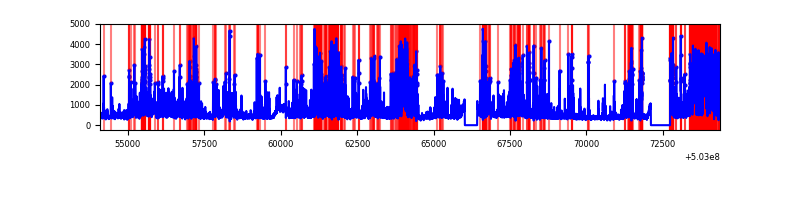 |
Top three noisy pixels from each quadrant. If the there are fewer than three noisy pixels in the level2.evt file, extra rows are filled as -1
| Pixel properties | Quadrant properties | ||||||
|---|---|---|---|---|---|---|---|
| Quadrant | DetID | PixID | Counts | Sigma | Mean | Median | Sigma |
| A | 3 | 45 | 853905 | 1708.45 | 2027 | 1976 | 498.7 |
| A | 3 | 78 | 832069 | 1664.66 | 2027 | 1976 | 498.7 |
| A | 0 | 8 | 602452 | 1204.19 | 2027 | 1976 | 498.7 |
| B | 0 | 182 | 125615 | 287.8 | 2015 | 1936 | 429.7 |
| B | 5 | 185 | 116928 | 267.59 | 2015 | 1936 | 429.7 |
| B | 10 | 247 | 67404 | 152.34 | 2015 | 1936 | 429.7 |
| C | 13 | 3 | 688965 | 1287.14 | 1976 | 1964 | 533.7 |
| C | 1 | 16 | 577586 | 1078.47 | 1976 | 1964 | 533.7 |
| C | 14 | 254 | 225174 | 418.2 | 1976 | 1964 | 533.7 |
| D | 11 | 129 | 2067497 | 3781.68 | 1940 | 1854 | 546.2 |
| D | 2 | 249 | 1310505 | 2395.82 | 1940 | 1854 | 546.2 |
| D | 11 | 176 | 1240184 | 2267.08 | 1940 | 1854 | 546.2 |
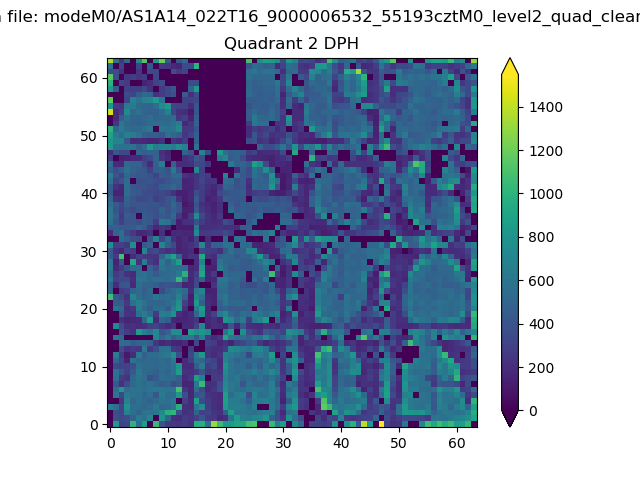
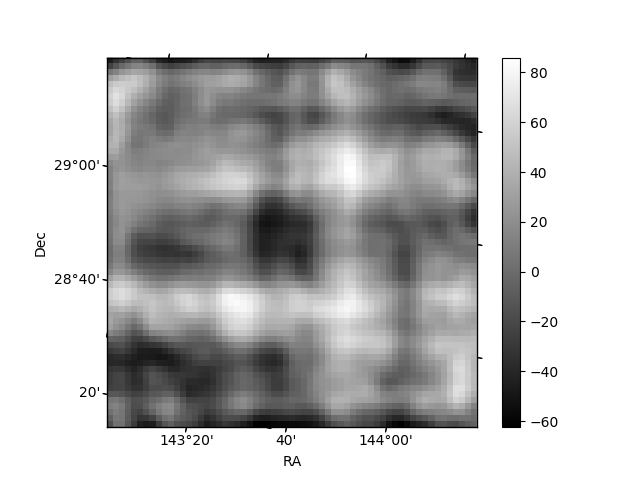
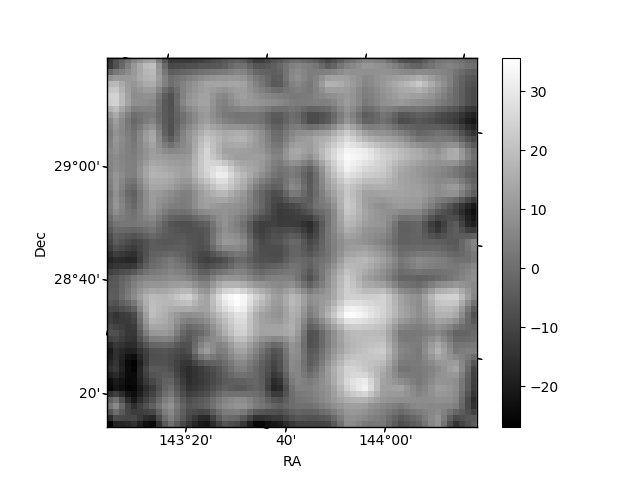
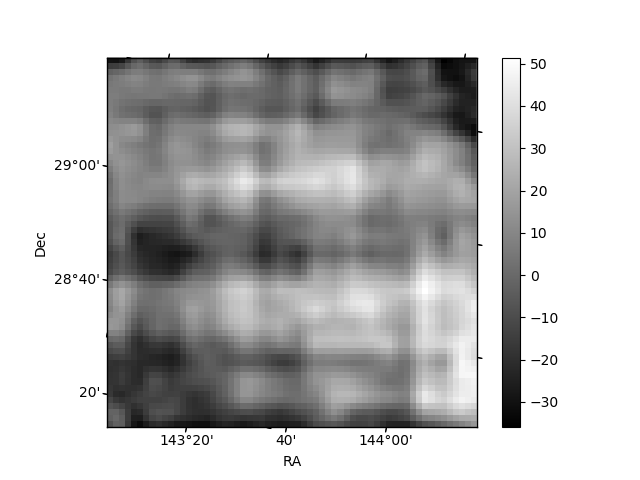
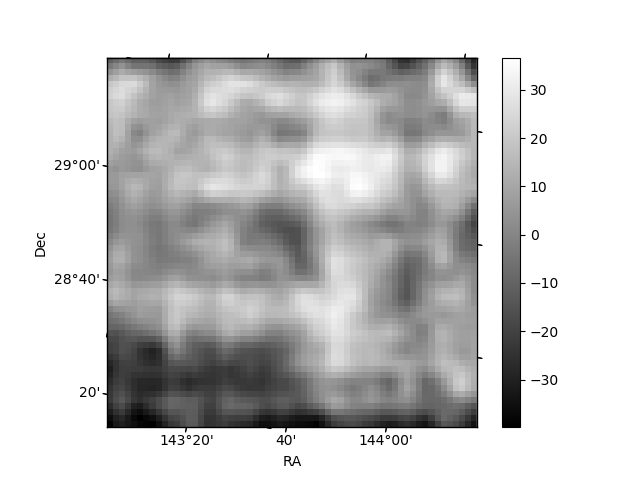
Histogram calculated using DETX and DETY for each event in the final _common_clean file
| Quadrant A | 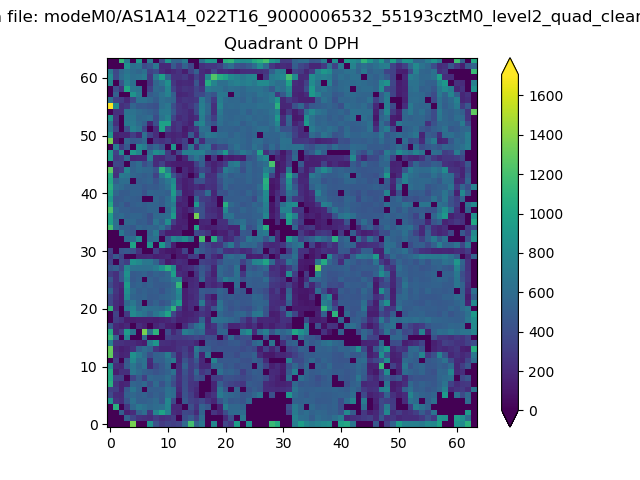 |
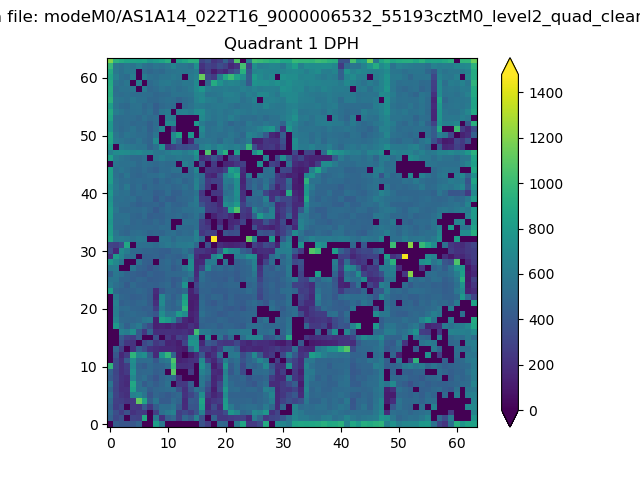 |
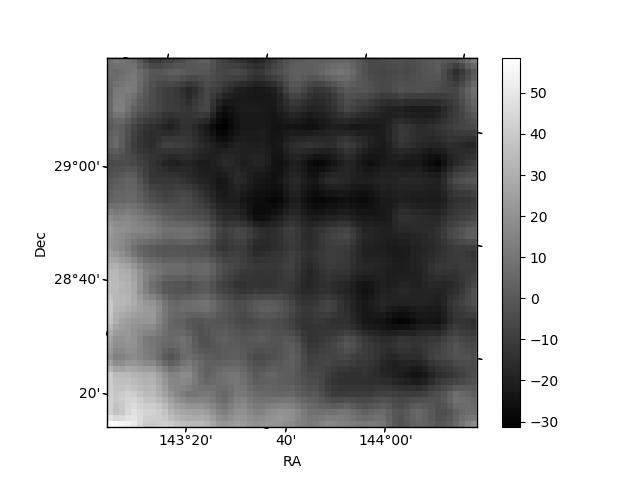
Quadrant B |
|---|---|---|---|
| Quadrant D | 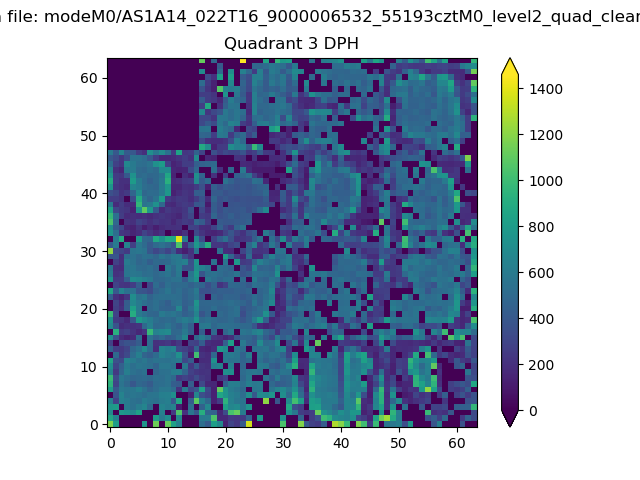 |
 |
Quadrant C |
| Plot type | Count rate plots | Images |
|---|---|---|
| Comparison with Poisson distribution Blue bars denote a histogram of data divided into 1 sec bins. Red curve is a Poisson curve with rate = median count rate of data. |
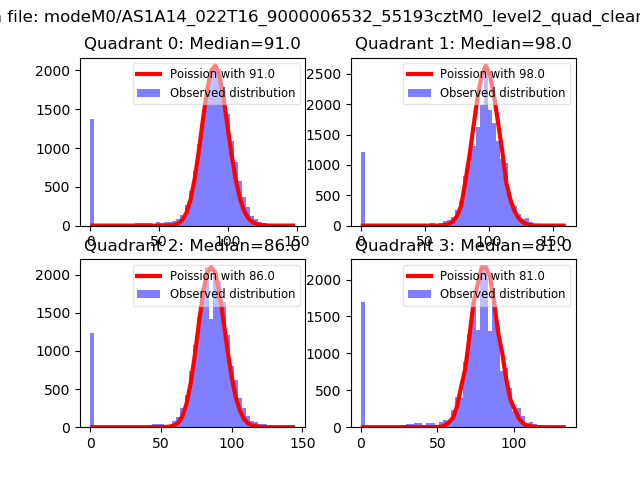 |
 |
| Quadrant-wise count rates Data is divided into 100 sec bins |
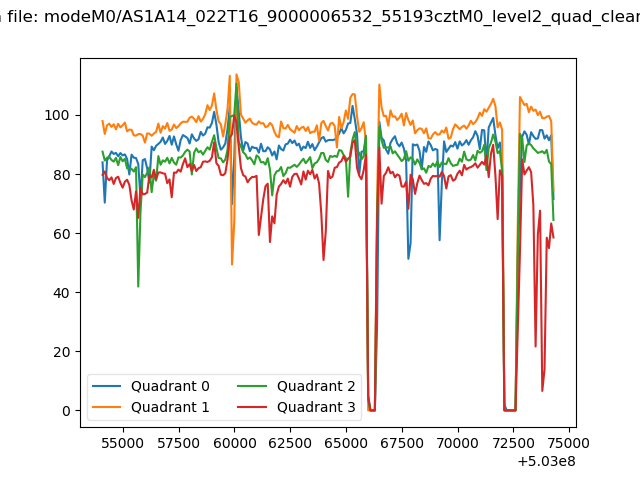 |
|
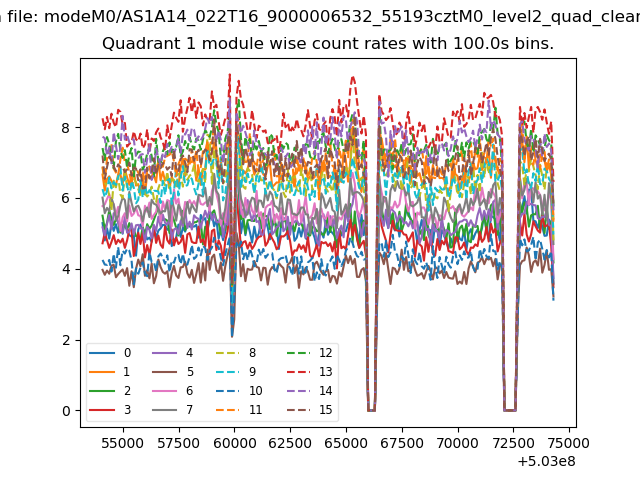
| Module-wise count rates for Quadrant A Data is divided into 100 sec bins |
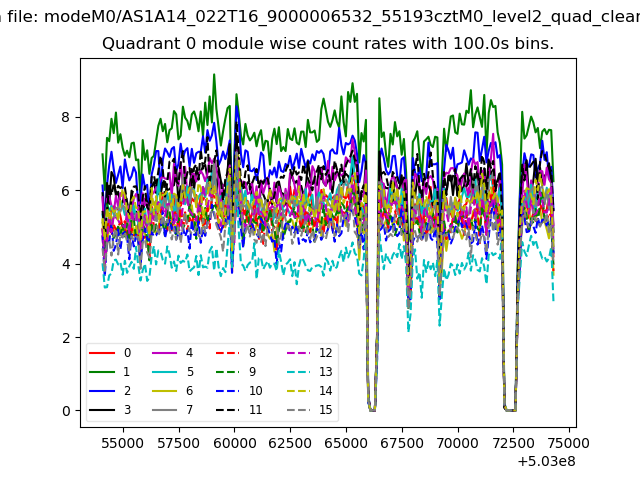 |
 |
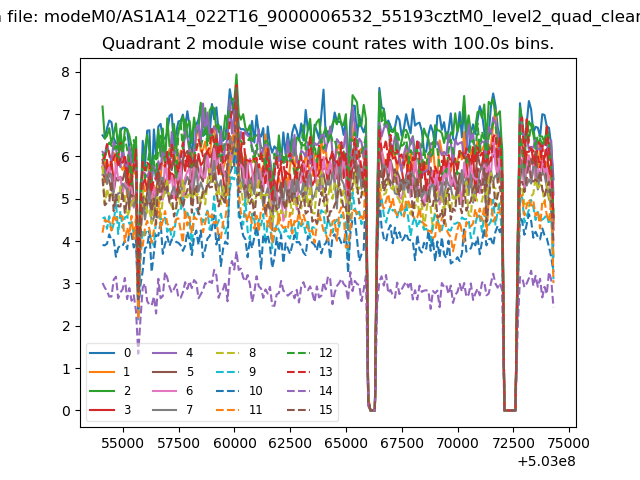
| Module-wise count rates for Quadrant B Data is divided into 100 sec bins |
 |
 |
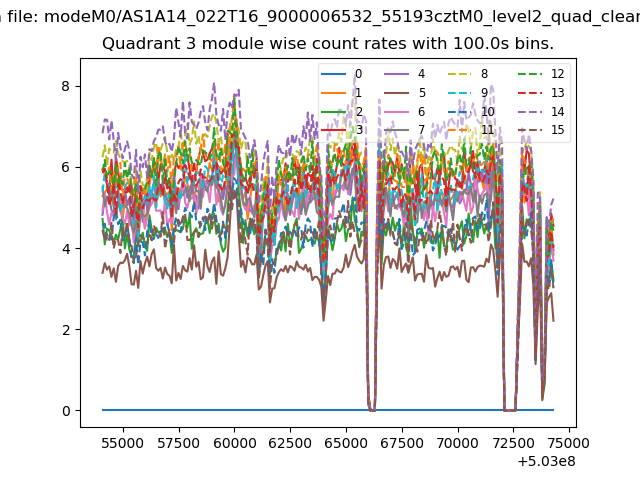
| Module-wise count rates for Quadrant C Data is divided into 100 sec bins |
 |
 |
| Module-wise count rates for Quadrant D Data is divided into 100 sec bins |
 |
 |
| Parameter | Plot |
|---|---|
| CZT HV Monitor | 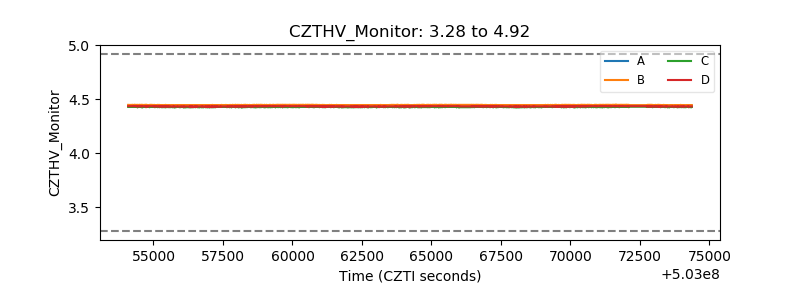 |
| D_VDD | 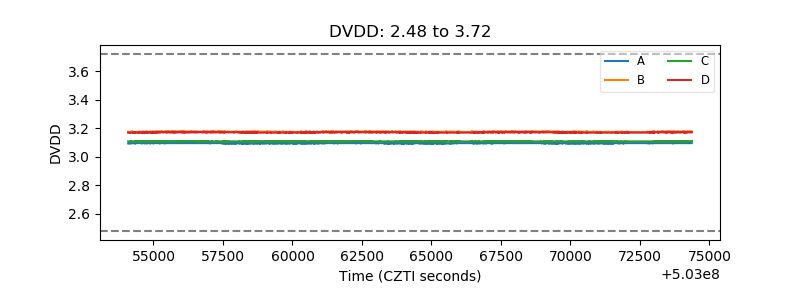 |
| Temperature 1 | 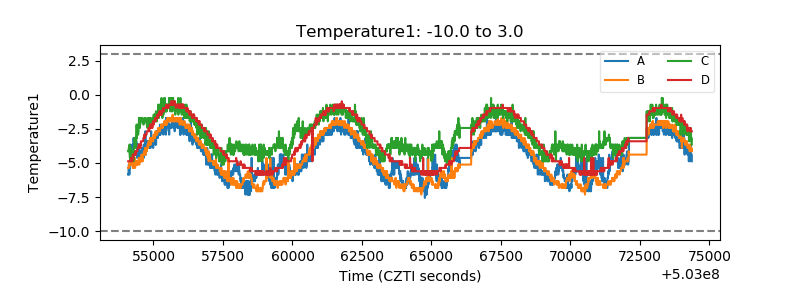 |
| Veto HV Monitor | 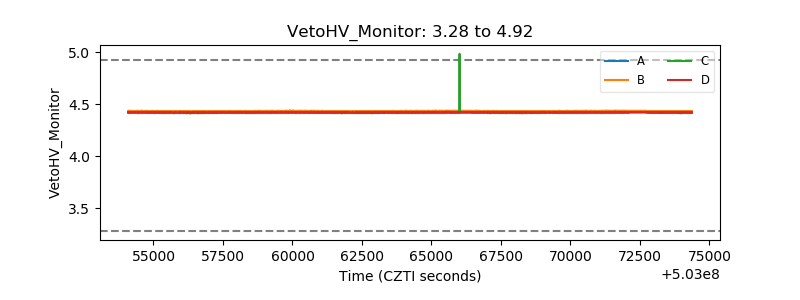 |
| Veto LLD | 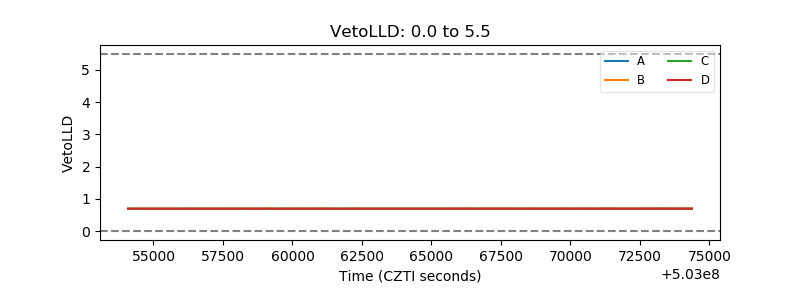 |
| Alpha Counter | 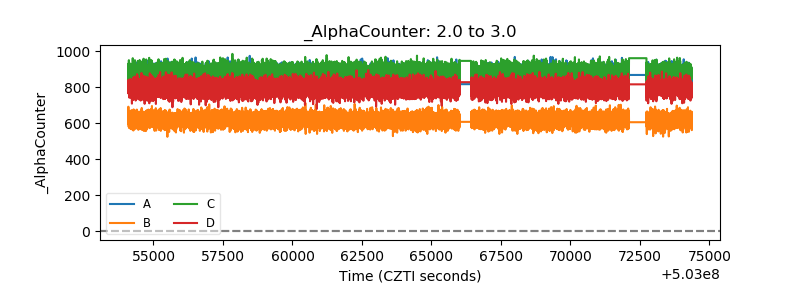 |
| _CPM_Rate | 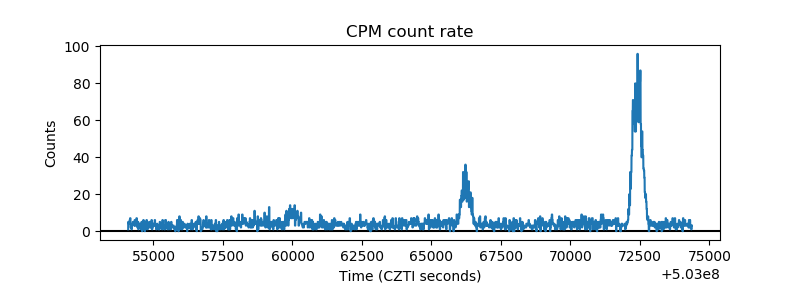 |
| CZT Counter | 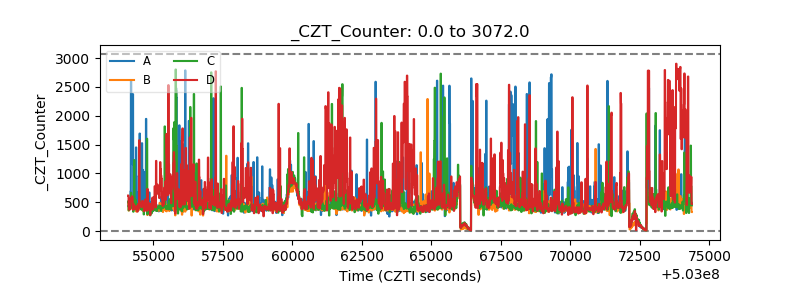 |
| +2.5 Volts monitor |  |
| +5 Volts monitor | 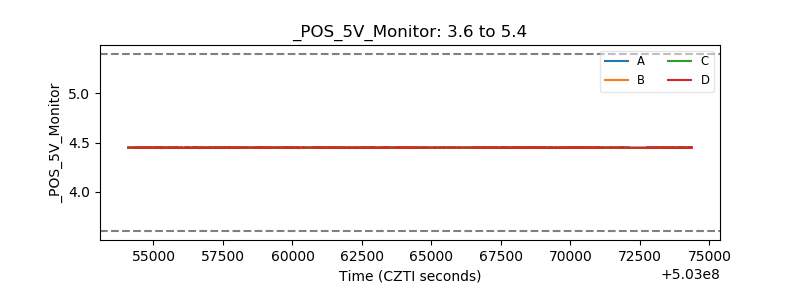 |
| _ROLL_ROT | 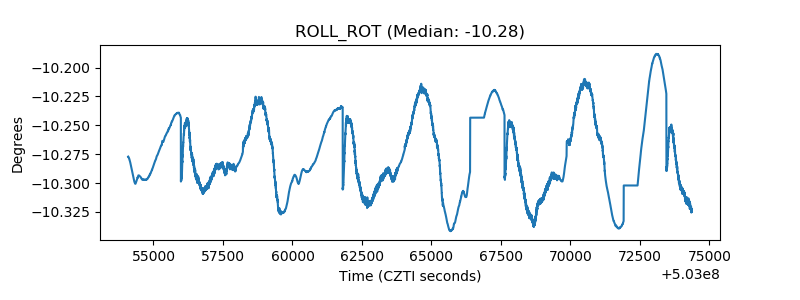 |
| _Roll_DEC | 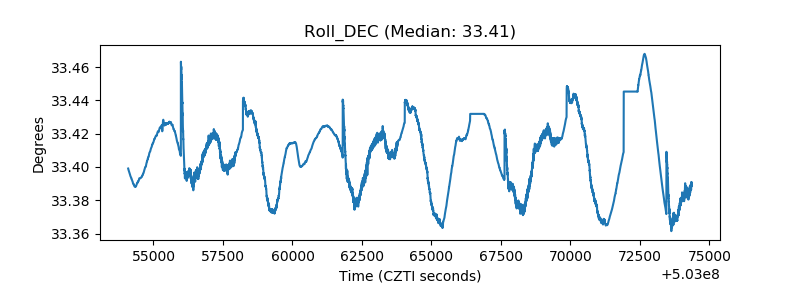 |
| _Roll_RA | 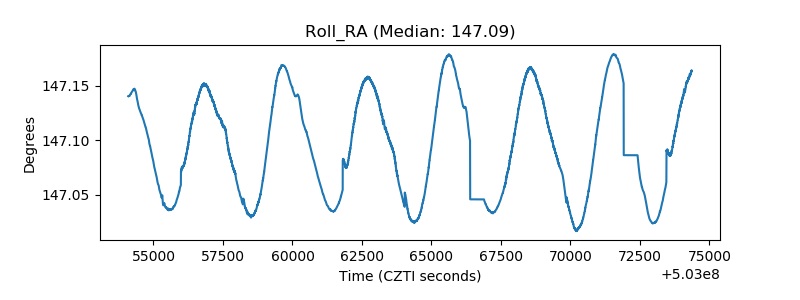 |
| Veto Counter | 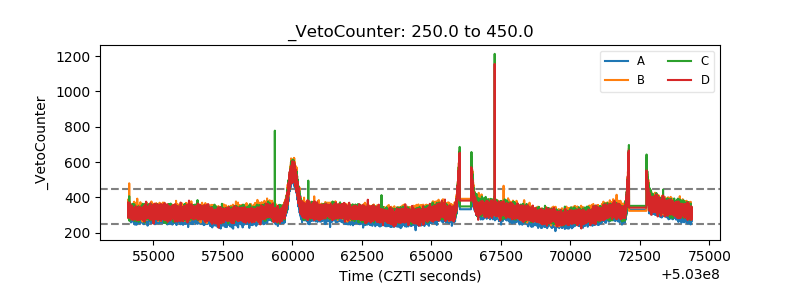 |