| Param | Original file | Final file |
|---|---|---|
| Filename | modeM0/AS1A14_022T16_9000006532_55194cztM0_level2.fits | modeM0/AS1A14_022T16_9000006532_55194cztM0_level2_quad_clean.evt |
| Size (bytes) | 592,810,560 | 92,911,680 |
| Size | 565.3 MB | 88.6 MB |
| Events in quadrant A | 7,821,073 | 498,498 |
| Events in quadrant B | 3,095,131 | 697,943 |
| Events in quadrant C | 3,715,090 | 613,770 |
| Events in quadrant D | 6,769,272 | 515,596 |
| Mode SS | |||
|---|---|---|---|
| Quadrant | BADHDUFLAG | Total packets | Discarded packets |
| A | 0 | 142 | 0 |
| B | 0 | 142 | 0 |
| C | 0 | 142 | 0 |
| D | 0 | 142 | 0 |
| Mode M0 | |||
|---|---|---|---|
| Quadrant | BADHDUFLAG | Total packets | Discarded packets |
| A | 0 | 28040 | 2 |
| B | 0 | 14459 | 2 |
| C | 0 | 15983 | 2 |
| D | 0 | 25141 | 2 |
| Mode M9 | |||
|---|---|---|---|
| Quadrant | BADHDUFLAG | Total packets | Discarded packets |
| A | 0 | 10 | 0 |
| B | 0 | 10 | 0 |
| C | 0 | 11 | 0 |
| D | 0 | 11 | 0 |
| Quadrant | Total seconds | Saturated seconds | Saturation percentage |
|---|---|---|---|
| A | 6996 | 1811 | 25.886221% |
| B | 6996 | 68 | 0.971984% |
| C | 6996 | 104 | 1.486564% |
| D | 6996 | 1029 | 14.708405% |
Noise dominated data is calculated using 1-second bins in cleaned event files. If a bin has >2000 counts, and if more than 50% of those come from <1% of pixels, then it is considered to be noise-dominated and hence unusable.
| Quadrant | # 1 sec bins | Bins with >0 counts | Bins with >2000 counts | High rate bins dominated by noise | Noise dominated (total time) | Noise dominated (detector-on time) | Marked lightcurve |
|---|---|---|---|---|---|---|---|
| A | 7791 | 6997 | 1496 | 1496 | 19.20% | 21.38% | 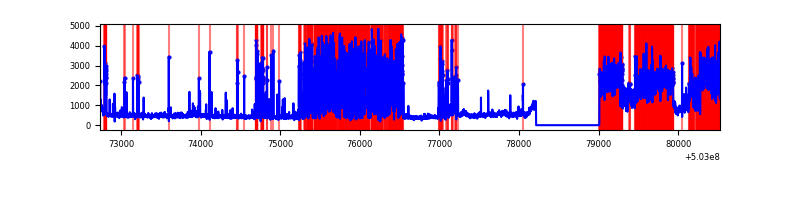 |
| B | 7791 | 6997 | 8 | 8 | 0.10% | 0.11% | 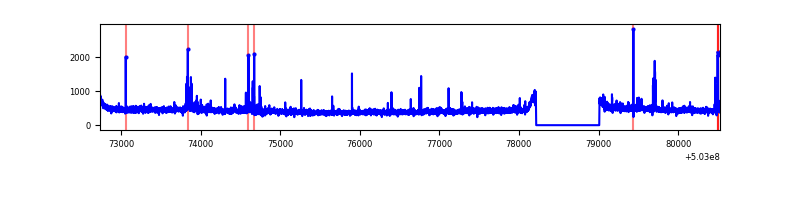 |
| C | 7791 | 6997 | 42 | 42 | 0.54% | 0.60% | 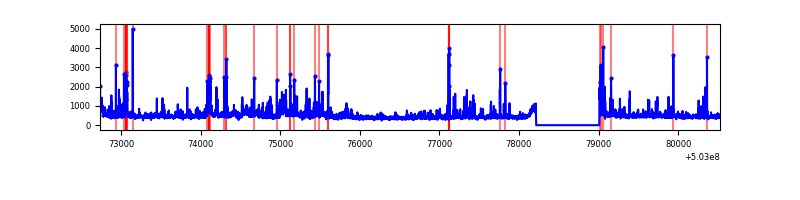 |
| D | 7791 | 6997 | 851 | 851 | 10.92% | 12.16% | 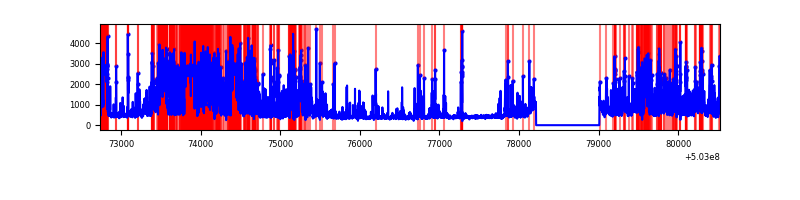 |
Top three noisy pixels from each quadrant. If the there are fewer than three noisy pixels in the level2.evt file, extra rows are filled as -1
| Pixel properties | Quadrant properties | ||||||
|---|---|---|---|---|---|---|---|
| Quadrant | DetID | PixID | Counts | Sigma | Mean | Median | Sigma |
| A | 3 | 45 | 2546924 | 15527.97 | 661 | 645 | 164.0 |
| A | 12 | 115 | 2098703 | 12794.58 | 661 | 645 | 164.0 |
| A | 0 | 8 | 285755 | 1738.69 | 661 | 645 | 164.0 |
| B | 10 | 247 | 39314 | 242.88 | 741 | 716 | 158.9 |
| B | 0 | 182 | 38519 | 237.88 | 741 | 716 | 158.9 |
| B | 2 | 249 | 31775 | 195.44 | 741 | 716 | 158.9 |
| C | 9 | 38 | 293606 | 1468.29 | 730 | 722 | 199.5 |
| C | 13 | 3 | 193896 | 968.42 | 730 | 722 | 199.5 |
| C | 15 | 217 | 129690 | 646.55 | 730 | 722 | 199.5 |
| D | 2 | 249 | 1251102 | 6597.58 | 680 | 652 | 189.5 |
| D | 11 | 176 | 785341 | 4140.15 | 680 | 652 | 189.5 |
| D | 3 | 13 | 778417 | 4103.62 | 680 | 652 | 189.5 |
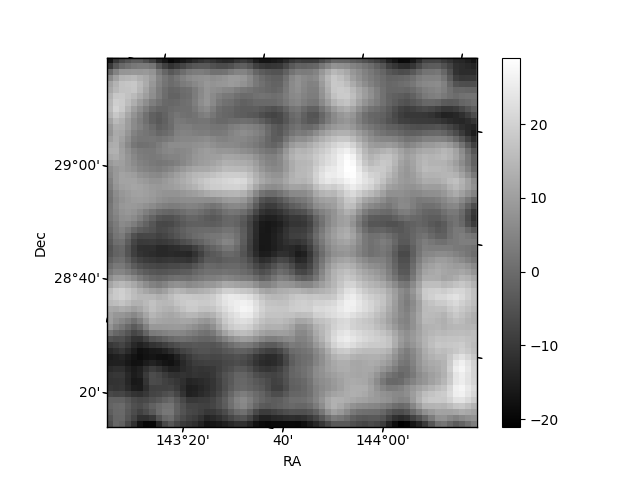
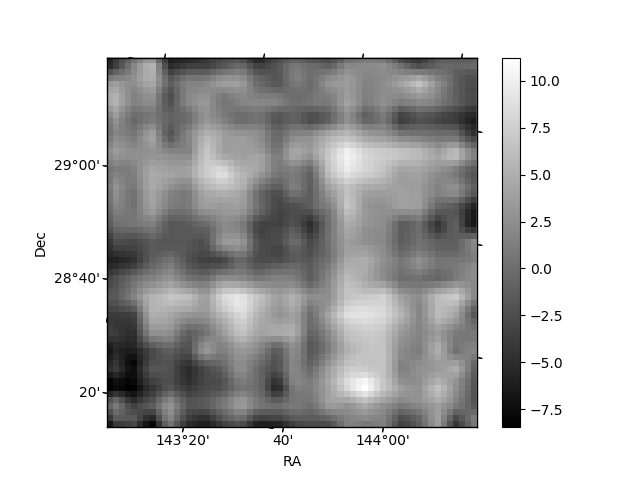
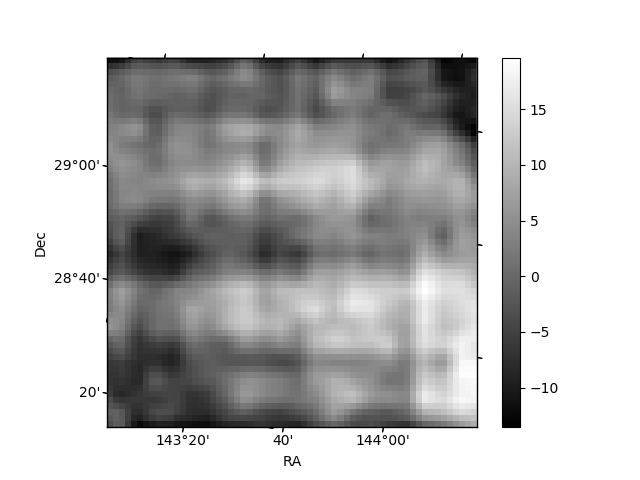
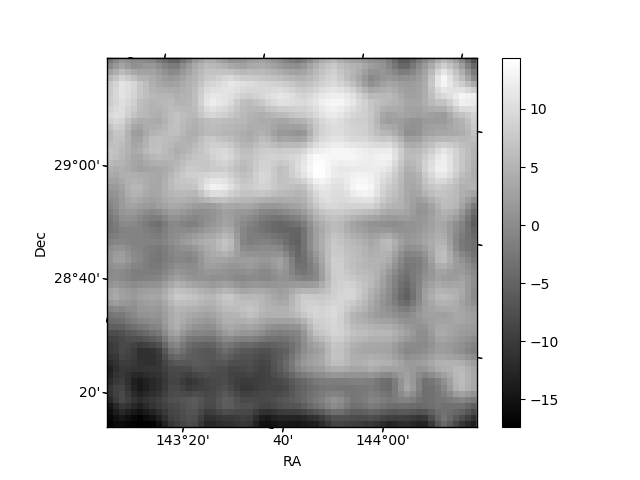
Histogram calculated using DETX and DETY for each event in the final _common_clean file
| Quadrant A | 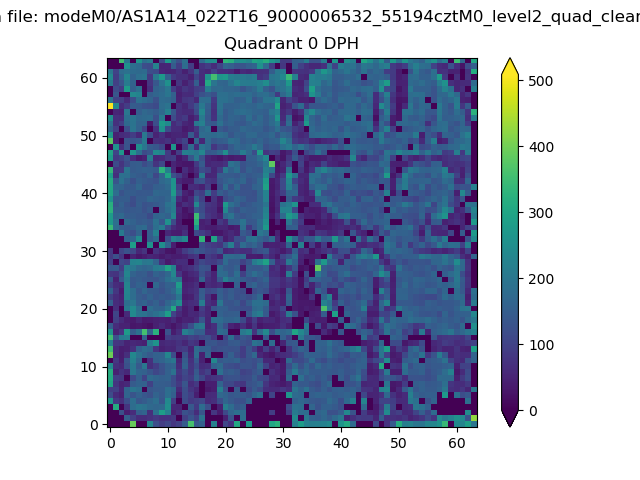 |
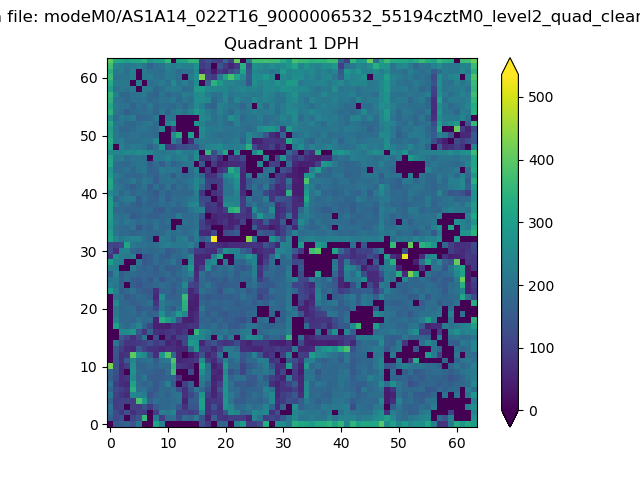 |
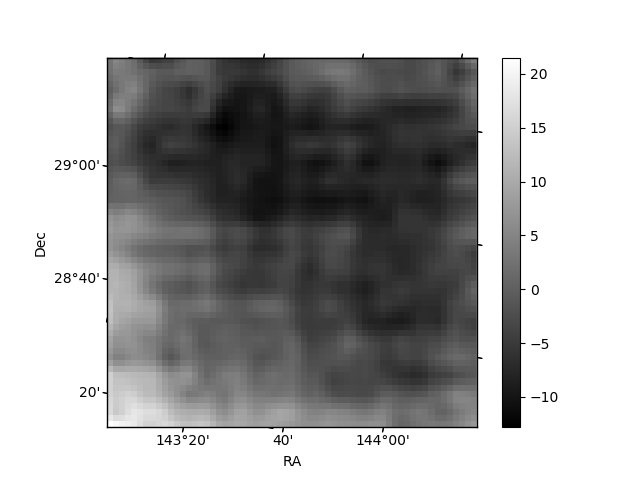
Quadrant B |
|---|---|---|---|
| Quadrant D | 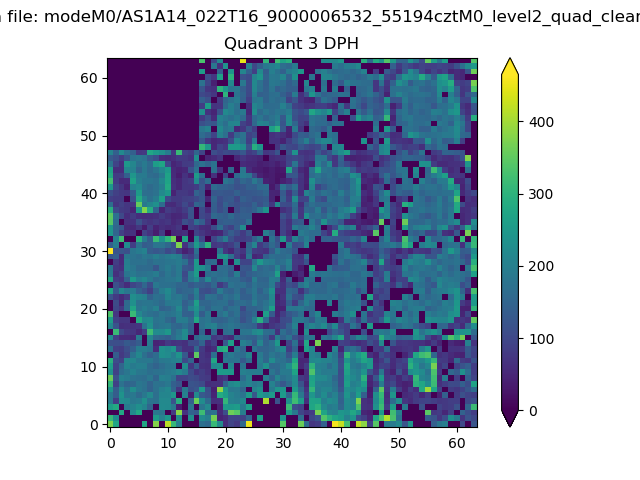 |
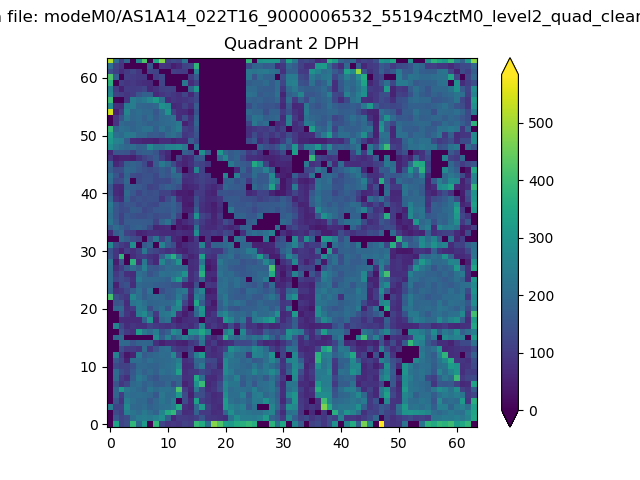 |
Quadrant C |
| Plot type | Count rate plots | Images |
|---|---|---|
| Comparison with Poisson distribution Blue bars denote a histogram of data divided into 1 sec bins. Red curve is a Poisson curve with rate = median count rate of data. |
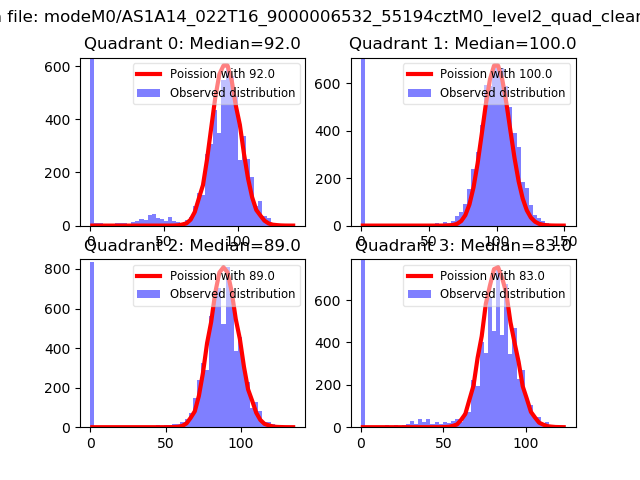 |
 |
| Quadrant-wise count rates Data is divided into 100 sec bins |
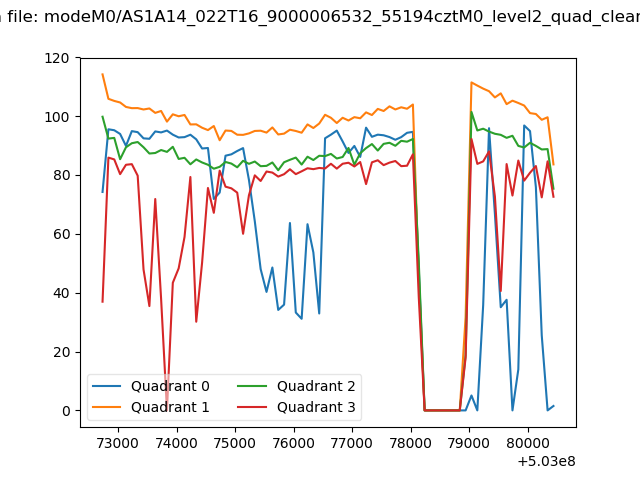 |
|
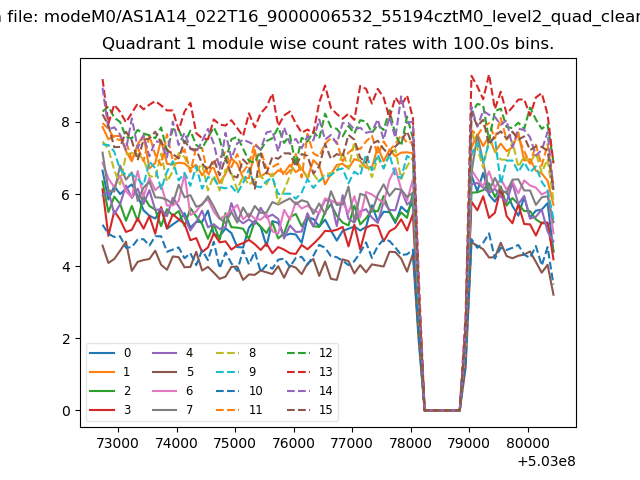
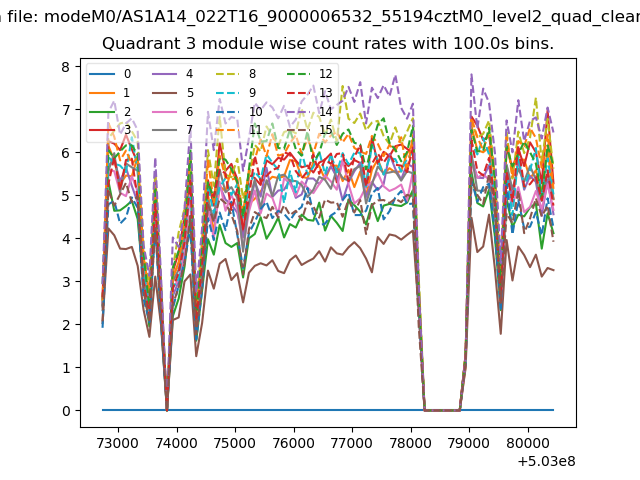
| Module-wise count rates for Quadrant A Data is divided into 100 sec bins |
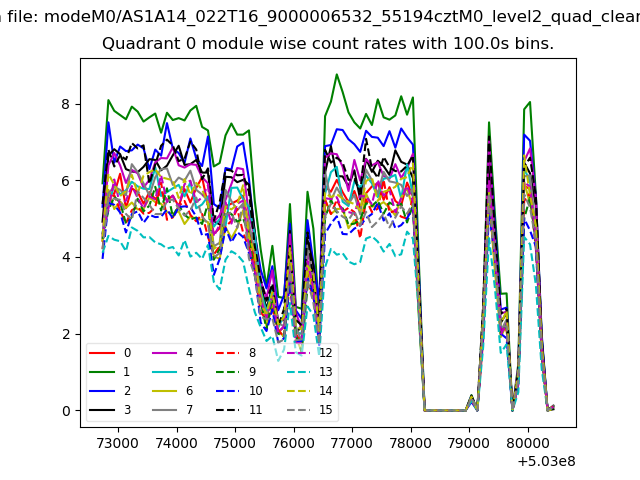 |
 |
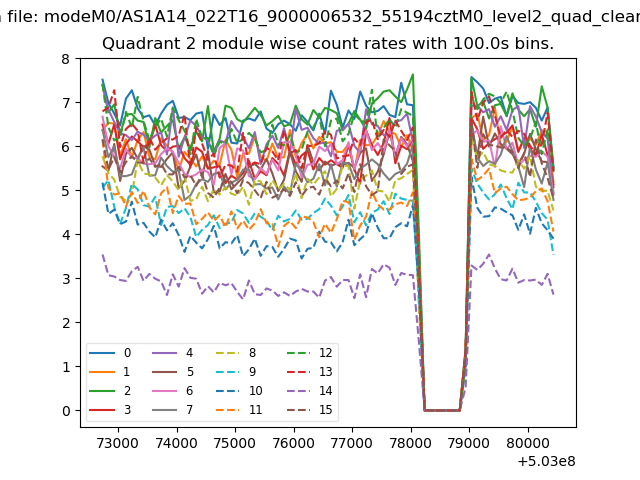
| Module-wise count rates for Quadrant B Data is divided into 100 sec bins |
 |
 |
| Module-wise count rates for Quadrant C Data is divided into 100 sec bins |
 |
 |
| Module-wise count rates for Quadrant D Data is divided into 100 sec bins |
 |
 |
| Parameter | Plot |
|---|---|
| CZT HV Monitor | 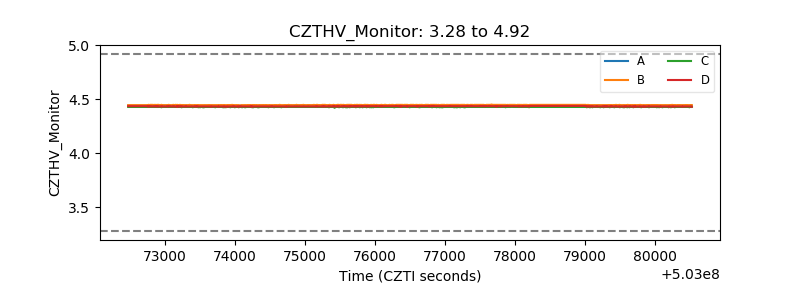 |
| D_VDD | 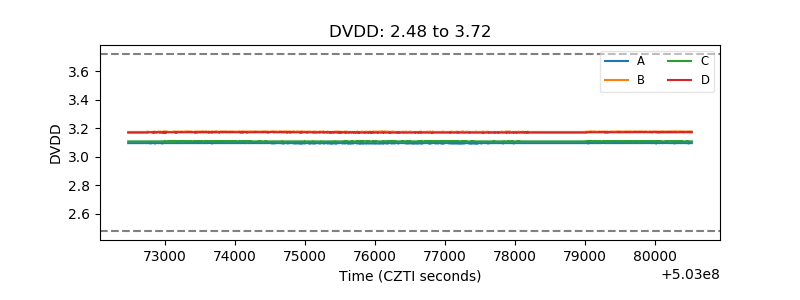 |
| Temperature 1 | 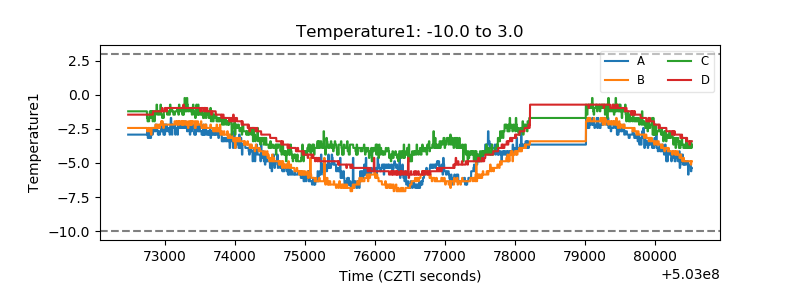 |
| Veto HV Monitor | 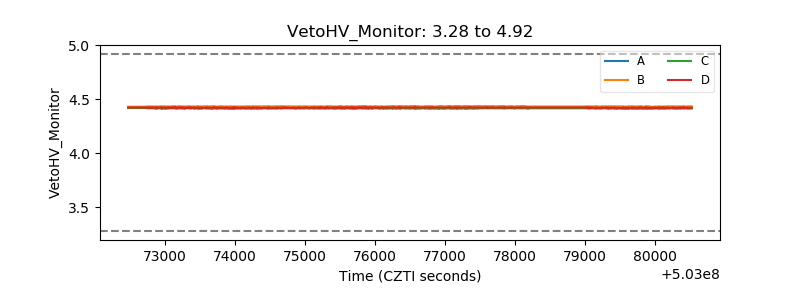 |
| Veto LLD | 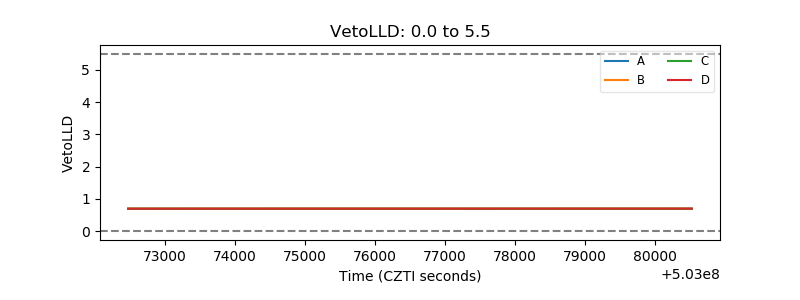 |
| Alpha Counter | 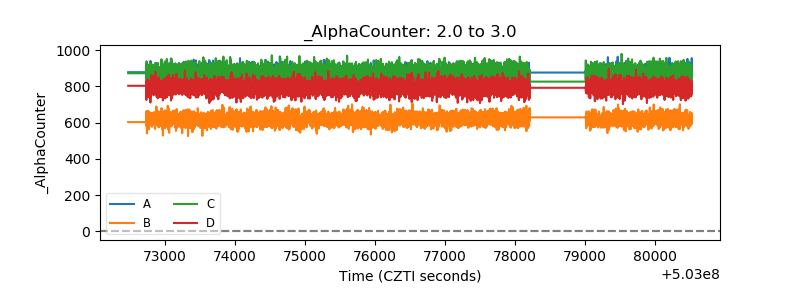 |
| _CPM_Rate | 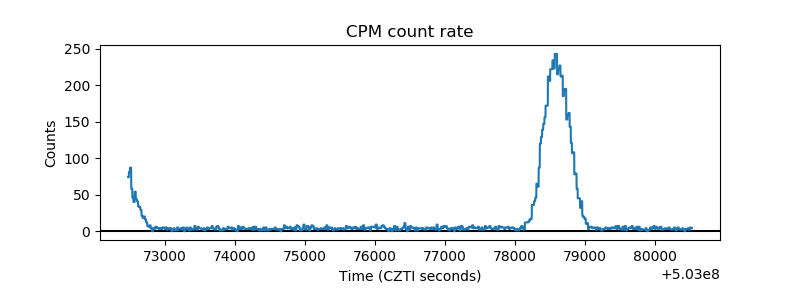 |
| CZT Counter | 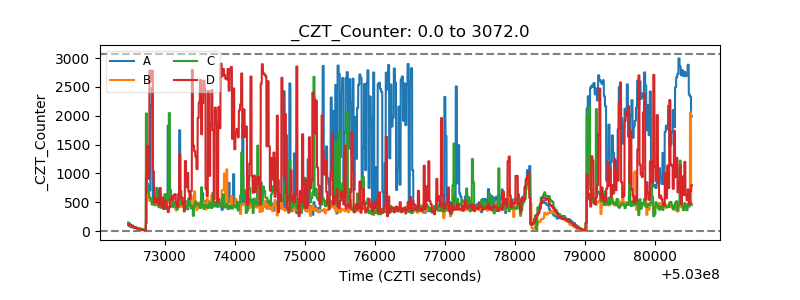 |
| +2.5 Volts monitor | 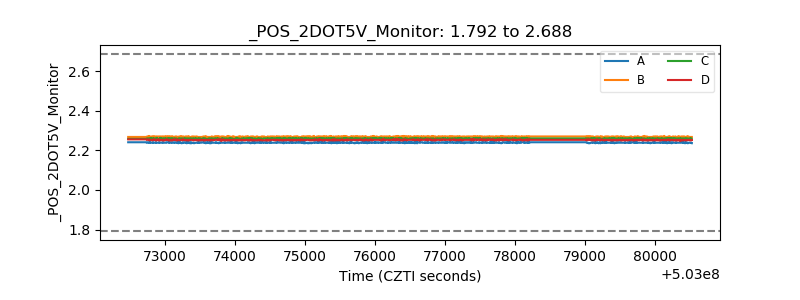 |
| +5 Volts monitor | 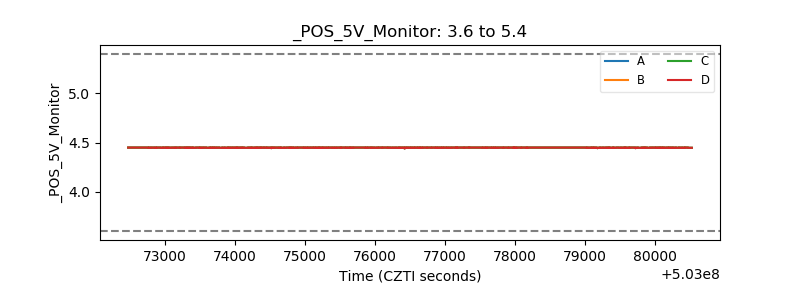 |
| _ROLL_ROT | 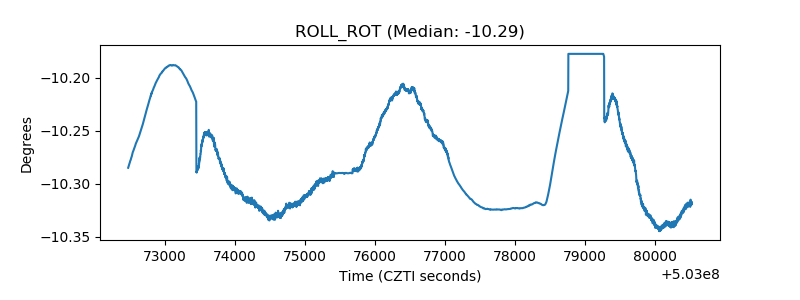 |
| _Roll_DEC |  |
| _Roll_RA | 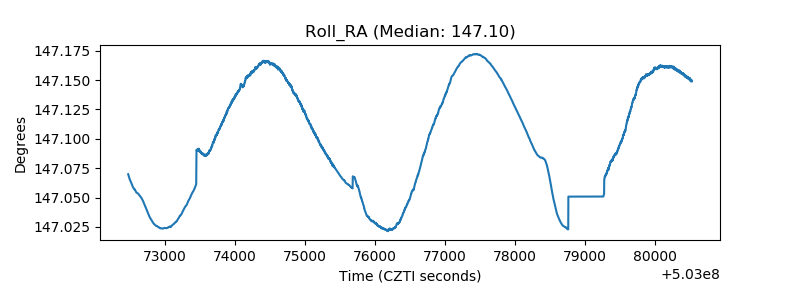 |
| Veto Counter | 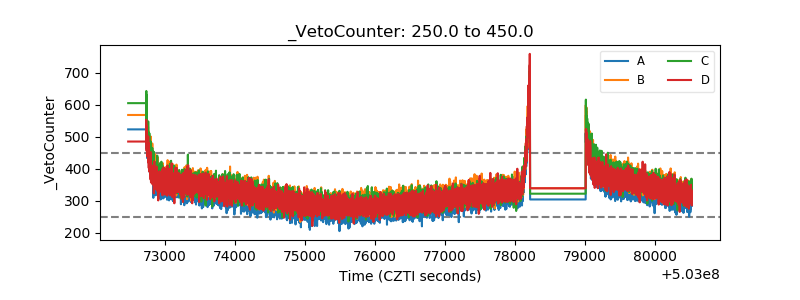 |