| Param | Original file | Final file |
|---|---|---|
| Filename | modeM0/AS1A14_022T16_9000006532_55197cztM0_level2.fits | modeM0/AS1A14_022T16_9000006532_55197cztM0_level2_quad_clean.evt |
| Size (bytes) | 590,204,160 | 93,663,360 |
| Size | 562.9 MB | 89.3 MB |
| Events in quadrant A | 10,147,945 | 434,126 |
| Events in quadrant B | 2,989,276 | 711,215 |
| Events in quadrant C | 3,724,565 | 629,038 |
| Events in quadrant D | 4,451,131 | 582,488 |
| Mode SS | |||
|---|---|---|---|
| Quadrant | BADHDUFLAG | Total packets | Discarded packets |
| A | 0 | 140 | 0 |
| B | 0 | 140 | 0 |
| C | 0 | 140 | 0 |
| D | 0 | 140 | 0 |
| Mode M0 | |||
|---|---|---|---|
| Quadrant | BADHDUFLAG | Total packets | Discarded packets |
| A | 0 | 34924 | 3 |
| B | 0 | 14085 | 2 |
| C | 0 | 16133 | 2 |
| D | 0 | 18228 | 2 |
| Mode M9 | |||
|---|---|---|---|
| Quadrant | BADHDUFLAG | Total packets | Discarded packets |
| A | 0 | 21 | 0 |
| B | 0 | 21 | 0 |
| C | 0 | 21 | 0 |
| D | 0 | 21 | 0 |
| Quadrant | Total seconds | Saturated seconds | Saturation percentage |
|---|---|---|---|
| A | 6879 | 2603 | 37.839802% |
| B | 6879 | 78 | 1.133886% |
| C | 6880 | 122 | 1.773256% |
| D | 6880 | 296 | 4.302326% |
Noise dominated data is calculated using 1-second bins in cleaned event files. If a bin has >2000 counts, and if more than 50% of those come from <1% of pixels, then it is considered to be noise-dominated and hence unusable.
| Quadrant | # 1 sec bins | Bins with >0 counts | Bins with >2000 counts | High rate bins dominated by noise | Noise dominated (total time) | Noise dominated (detector-on time) | Marked lightcurve |
|---|---|---|---|---|---|---|---|
| A | 8933 | 6879 | 2235 | 2235 | 25.02% | 32.49% | 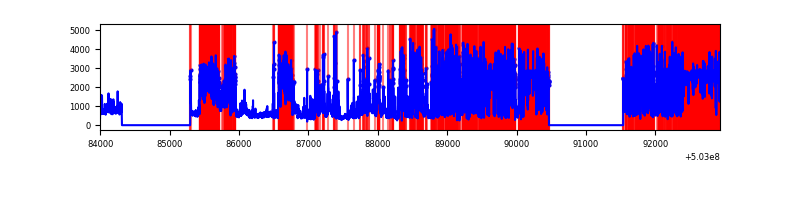 |
| B | 8934 | 6881 | 3 | 3 | 0.03% | 0.04% | 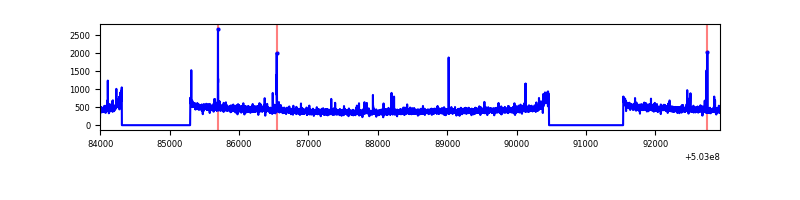 |
| C | 8935 | 6882 | 48 | 48 | 0.54% | 0.70% | 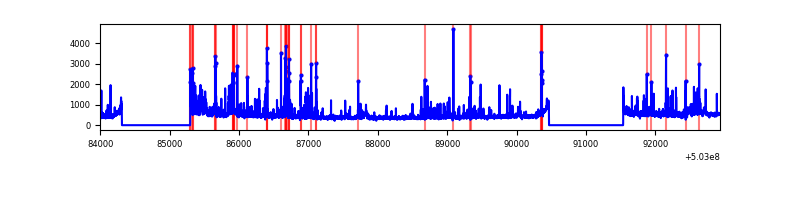 |
| D | 8935 | 6882 | 186 | 186 | 2.08% | 2.70% | 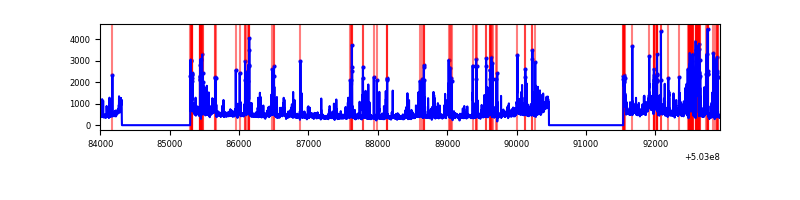 |
Top three noisy pixels from each quadrant. If the there are fewer than three noisy pixels in the level2.evt file, extra rows are filled as -1
| Pixel properties | Quadrant properties | ||||||
|---|---|---|---|---|---|---|---|
| Quadrant | DetID | PixID | Counts | Sigma | Mean | Median | Sigma |
| A | 3 | 45 | 5378004 | 37109.48 | 585 | 572 | 144.9 |
| A | 12 | 115 | 2123876 | 14652.85 | 585 | 572 | 144.9 |
| A | 0 | 8 | 127975 | 879.2 | 585 | 572 | 144.9 |
| B | 12 | 111 | 19207 | 115.93 | 739 | 711 | 159.5 |
| B | 11 | 111 | 18243 | 109.89 | 739 | 711 | 159.5 |
| B | 10 | 247 | 18227 | 109.79 | 739 | 711 | 159.5 |
| C | 13 | 3 | 189898 | 947.69 | 727 | 720 | 199.6 |
| C | 1 | 16 | 181310 | 904.67 | 727 | 720 | 199.6 |
| C | 6 | 13 | 124810 | 621.63 | 727 | 720 | 199.6 |
| D | 11 | 129 | 569645 | 2835.08 | 713 | 683 | 200.7 |
| D | 2 | 249 | 383125 | 1905.67 | 713 | 683 | 200.7 |
| D | 7 | 96 | 230649 | 1145.9 | 713 | 683 | 200.7 |
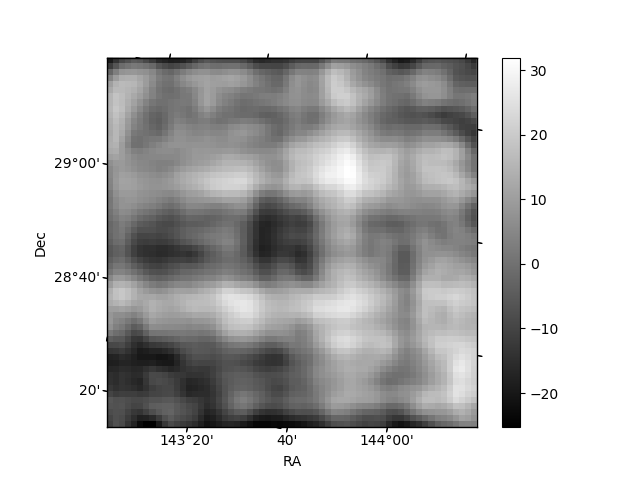
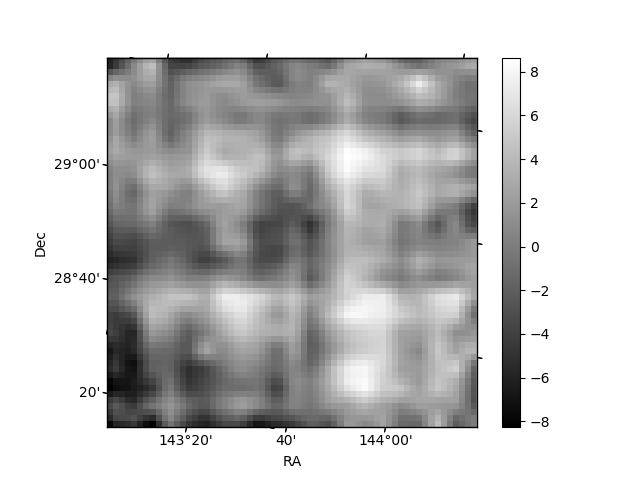
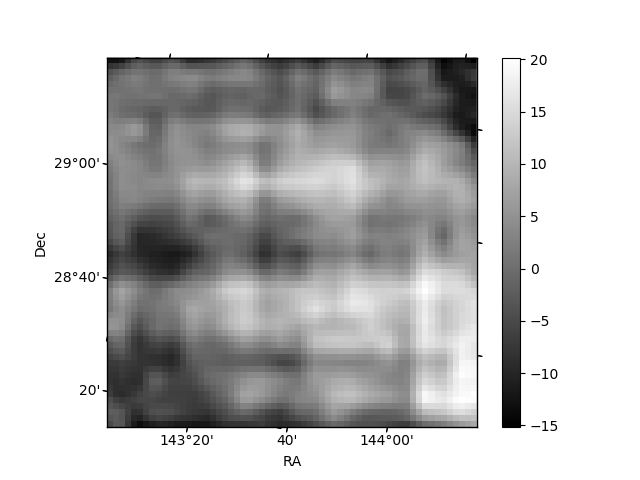
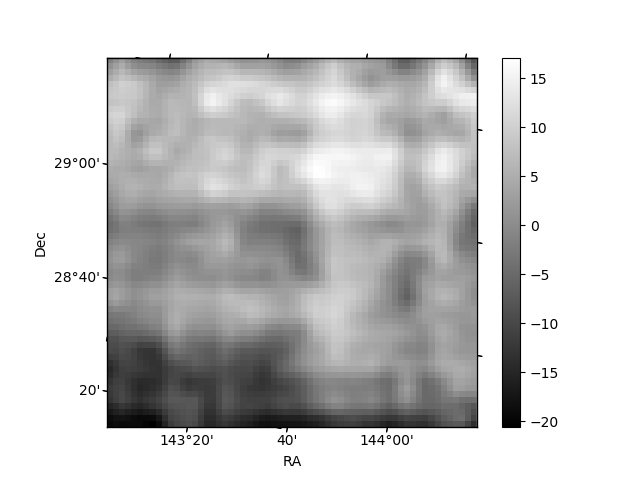
Histogram calculated using DETX and DETY for each event in the final _common_clean file
| Quadrant A | 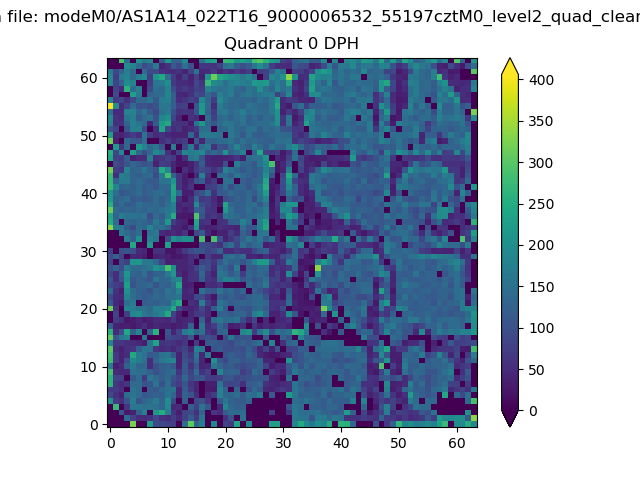 |
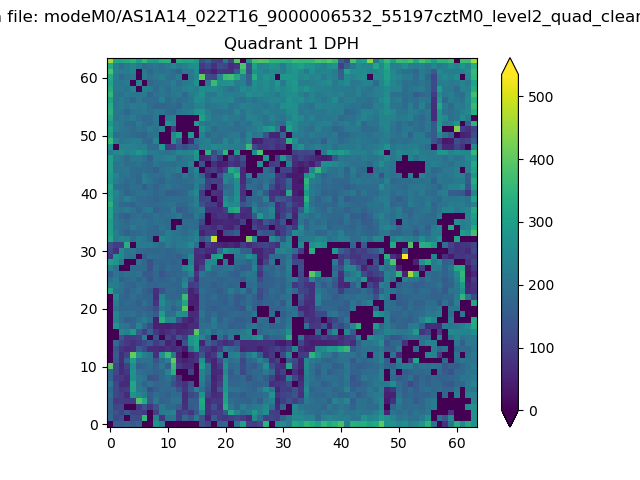 |
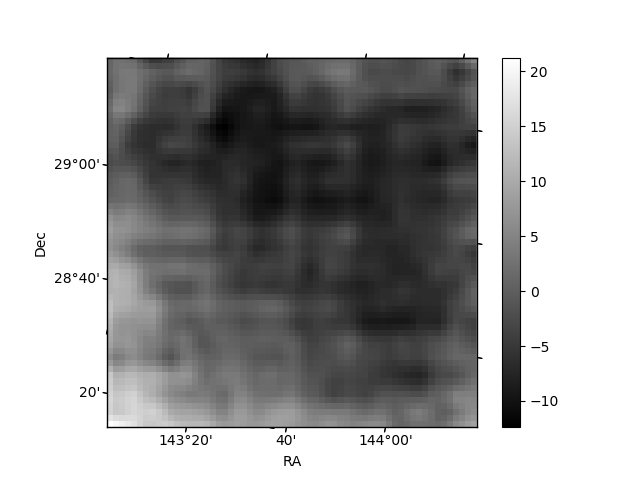
Quadrant B |
|---|---|---|---|
| Quadrant D | 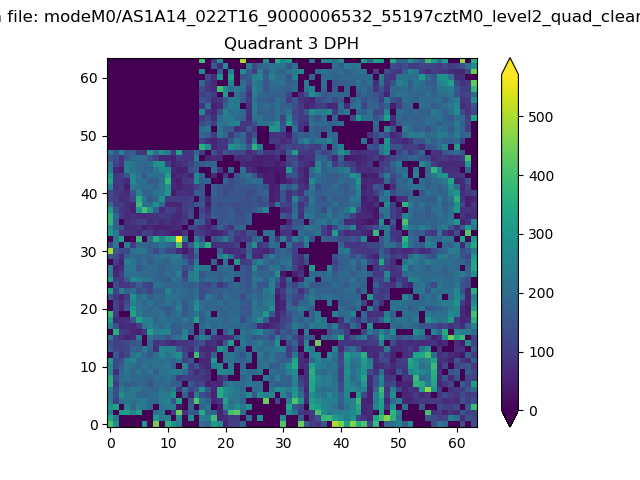 |
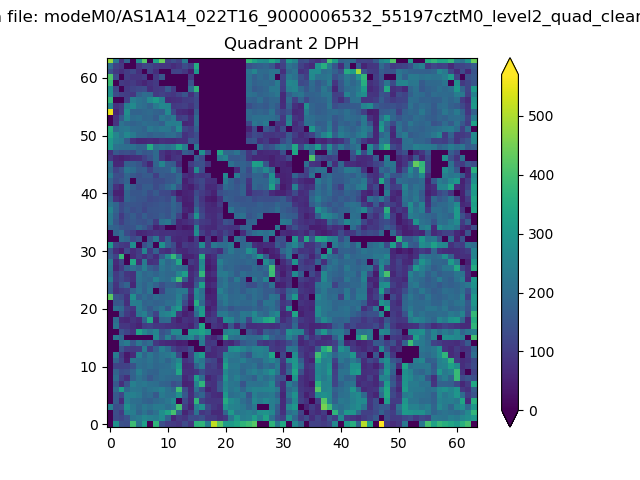 |
Quadrant C |
| Plot type | Count rate plots | Images |
|---|---|---|
| Comparison with Poisson distribution Blue bars denote a histogram of data divided into 1 sec bins. Red curve is a Poisson curve with rate = median count rate of data. |
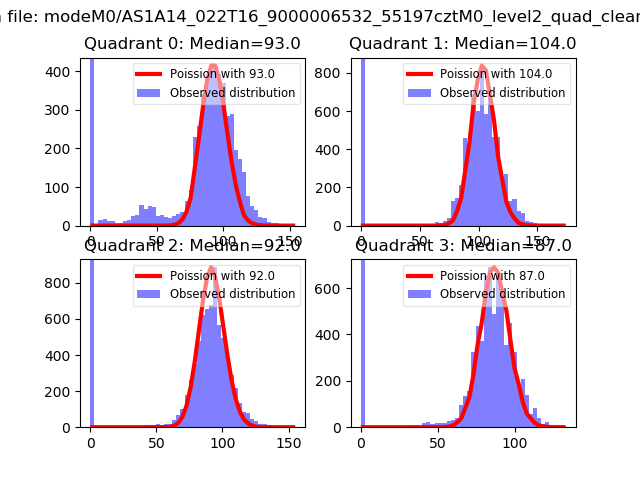 |
 |
| Quadrant-wise count rates Data is divided into 100 sec bins |
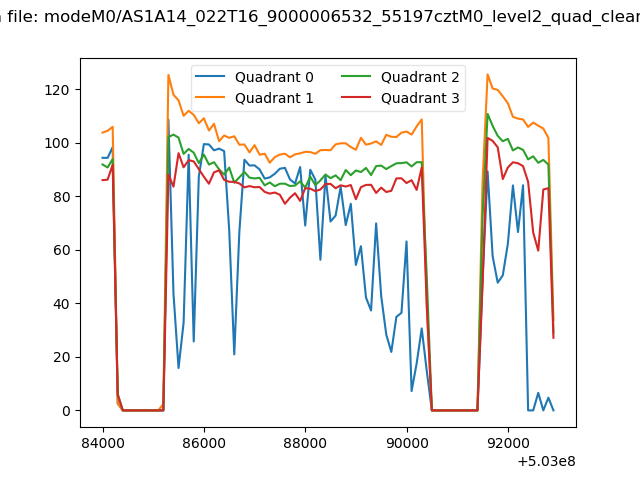 |
|
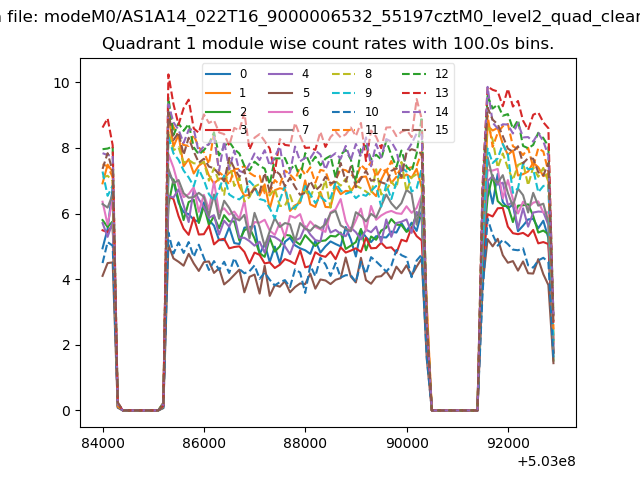
| Module-wise count rates for Quadrant A Data is divided into 100 sec bins |
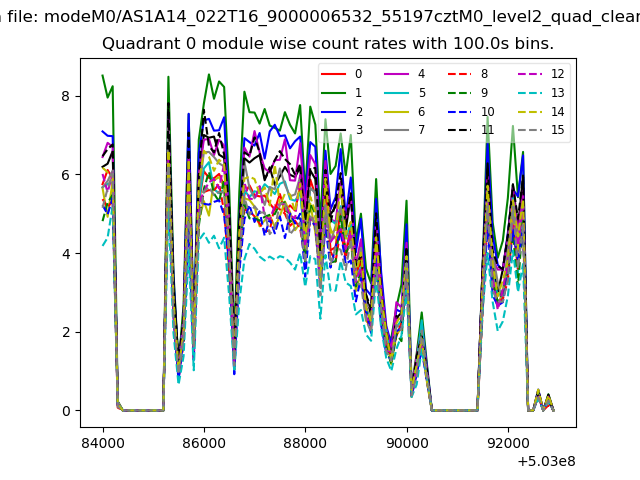 |
 |
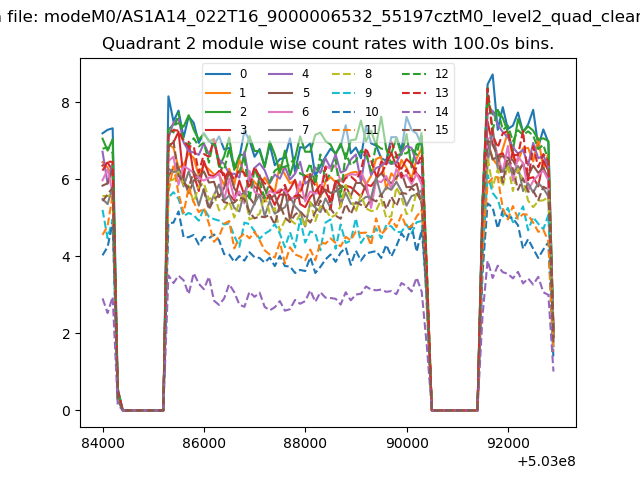
| Module-wise count rates for Quadrant B Data is divided into 100 sec bins |
 |
 |
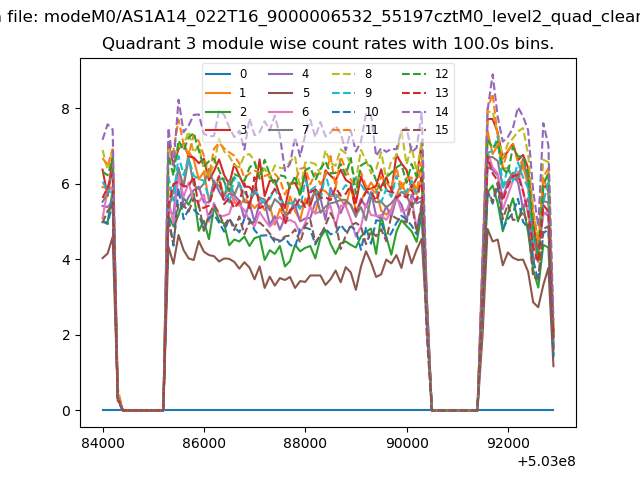
| Module-wise count rates for Quadrant C Data is divided into 100 sec bins |
 |
 |
| Module-wise count rates for Quadrant D Data is divided into 100 sec bins |
 |
 |
| Parameter | Plot |
|---|---|
| CZT HV Monitor | 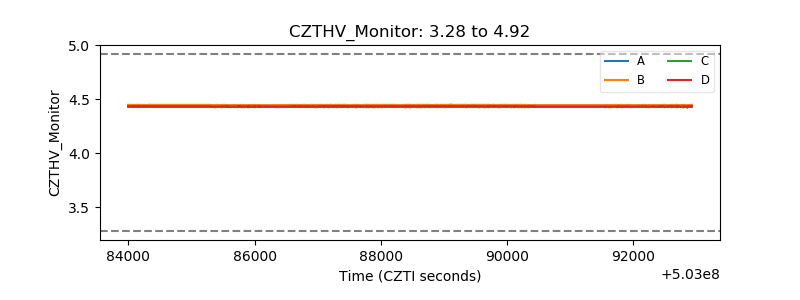 |
| D_VDD | 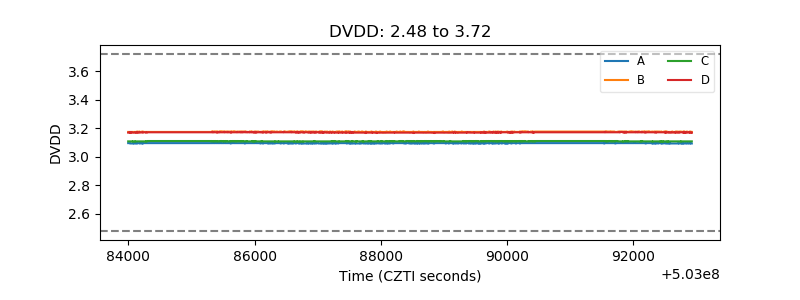 |
| Temperature 1 | 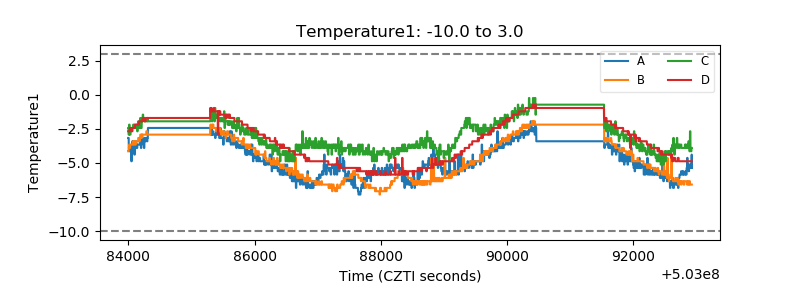 |
| Veto HV Monitor | 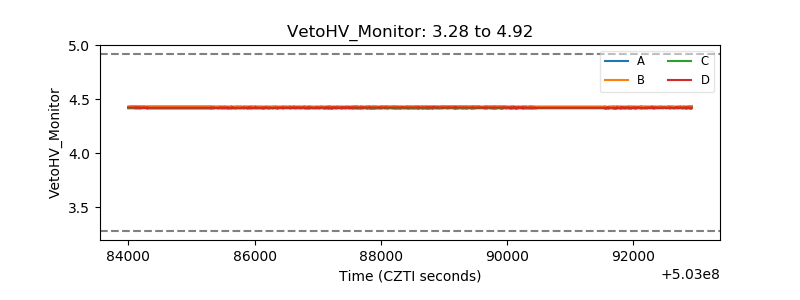 |
| Veto LLD | 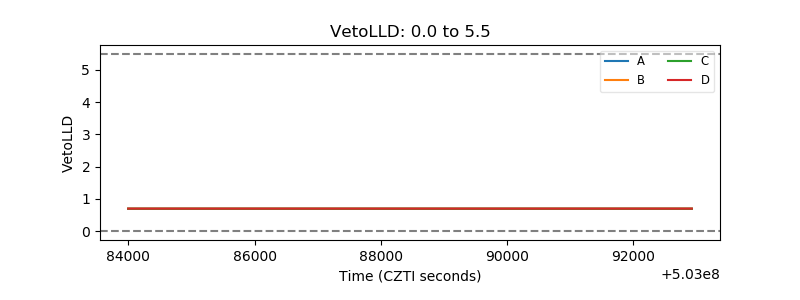 |
| Alpha Counter | 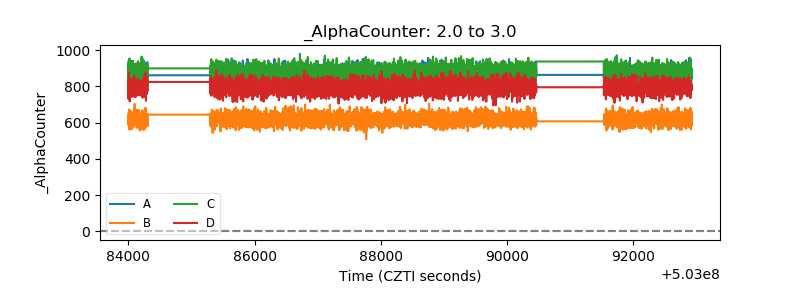 |
| _CPM_Rate | 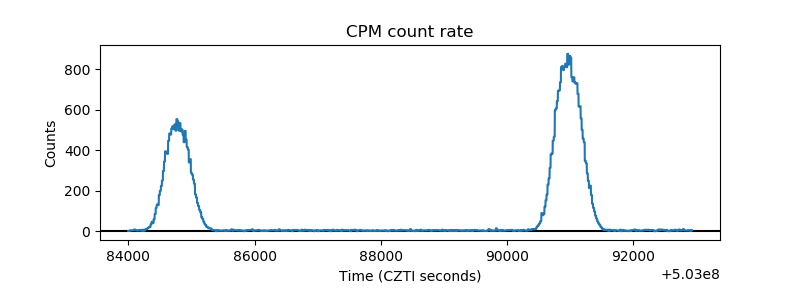 |
| CZT Counter | 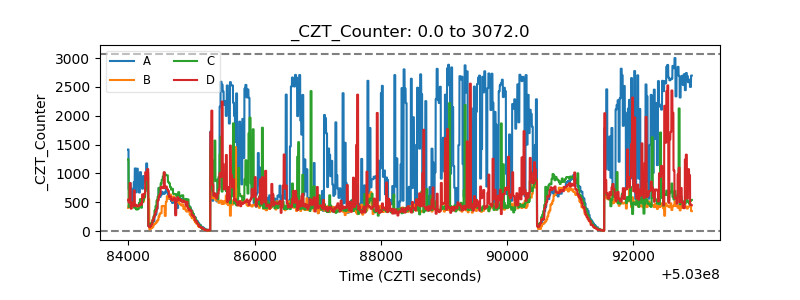 |
| +2.5 Volts monitor |  |
| +5 Volts monitor |  |
| _ROLL_ROT | 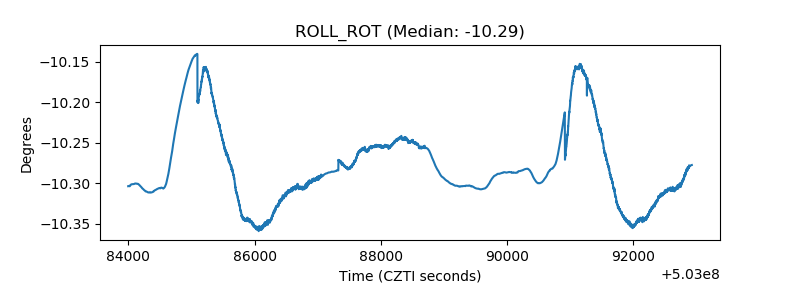 |
| _Roll_DEC | 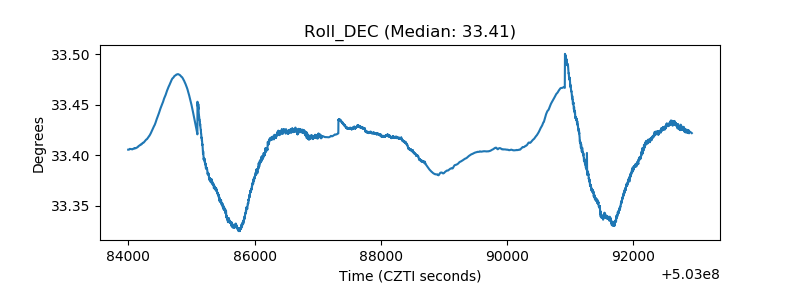 |
| _Roll_RA | 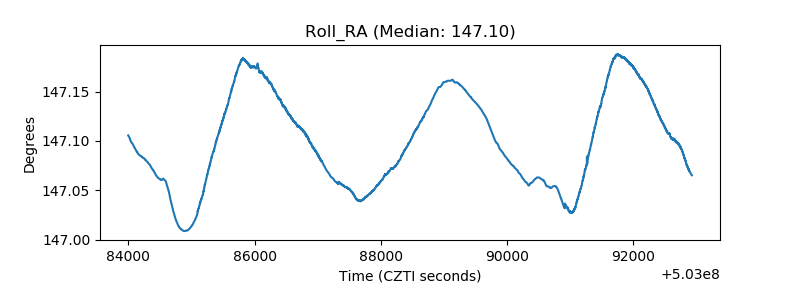 |
| Veto Counter | 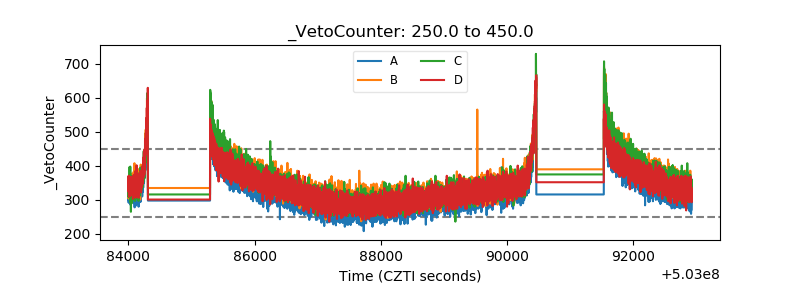 |