| Param | Original file | Final file |
|---|---|---|
| Filename | modeM0/AS1A14_022T16_9000006532_55198cztM0_level2.fits | modeM0/AS1A14_022T16_9000006532_55198cztM0_level2_quad_clean.evt |
| Size (bytes) | 512,870,400 | 90,089,280 |
| Size | 489.1 MB | 85.9 MB |
| Events in quadrant A | 7,086,399 | 481,931 |
| Events in quadrant B | 2,984,941 | 678,023 |
| Events in quadrant C | 3,389,310 | 596,431 |
| Events in quadrant D | 5,028,568 | 526,008 |
| Mode SS | |||
|---|---|---|---|
| Quadrant | BADHDUFLAG | Total packets | Discarded packets |
| A | 0 | 132 | 0 |
| B | 0 | 132 | 0 |
| C | 0 | 132 | 0 |
| D | 0 | 132 | 0 |
| Mode M0 | |||
|---|---|---|---|
| Quadrant | BADHDUFLAG | Total packets | Discarded packets |
| A | 0 | 25404 | 2 |
| B | 0 | 13565 | 2 |
| C | 0 | 14390 | 2 |
| D | 0 | 19520 | 3 |
| Mode M9 | |||
|---|---|---|---|
| Quadrant | BADHDUFLAG | Total packets | Discarded packets |
| A | 0 | 15 | 0 |
| B | 0 | 15 | 0 |
| C | 0 | 16 | 0 |
| D | 0 | 16 | 0 |
| Quadrant | Total seconds | Saturated seconds | Saturation percentage |
|---|---|---|---|
| A | 6376 | 1598 | 25.062735% |
| B | 6376 | 42 | 0.658720% |
| C | 6376 | 59 | 0.925345% |
| D | 6375 | 503 | 7.890196% |
Noise dominated data is calculated using 1-second bins in cleaned event files. If a bin has >2000 counts, and if more than 50% of those come from <1% of pixels, then it is considered to be noise-dominated and hence unusable.
| Quadrant | # 1 sec bins | Bins with >0 counts | Bins with >2000 counts | High rate bins dominated by noise | Noise dominated (total time) | Noise dominated (detector-on time) | Marked lightcurve |
|---|---|---|---|---|---|---|---|
| A | 7556 | 6377 | 1405 | 1405 | 18.59% | 22.03% | 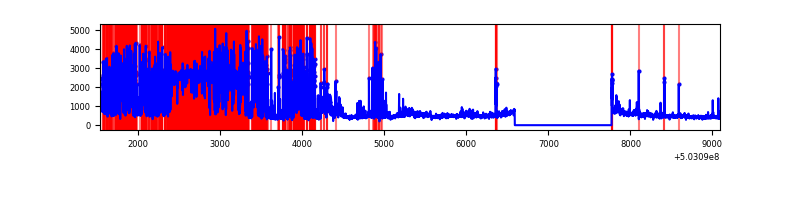 |
| B | 7556 | 6377 | 23 | 23 | 0.30% | 0.36% | 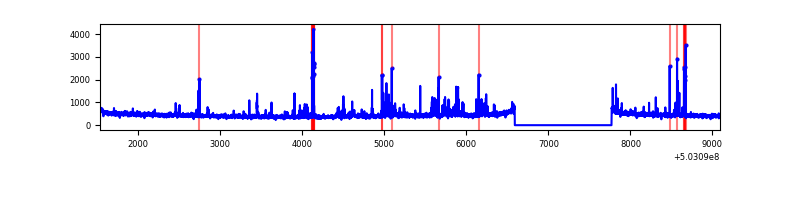 |
| C | 7556 | 6377 | 41 | 41 | 0.54% | 0.64% | 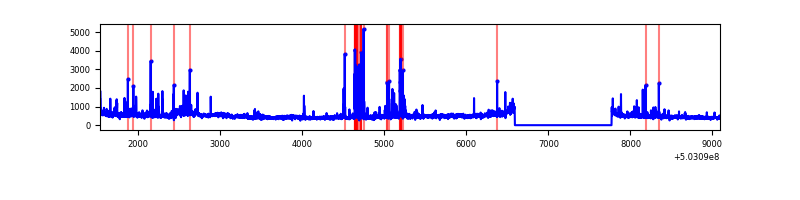 |
| D | 7555 | 6376 | 416 | 416 | 5.51% | 6.52% | 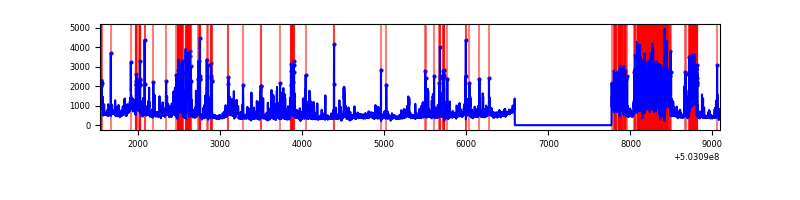 |
Top three noisy pixels from each quadrant. If the there are fewer than three noisy pixels in the level2.evt file, extra rows are filled as -1
| Pixel properties | Quadrant properties | ||||||
|---|---|---|---|---|---|---|---|
| Quadrant | DetID | PixID | Counts | Sigma | Mean | Median | Sigma |
| A | 3 | 45 | 3925261 | 27443.07 | 578 | 564 | 143.0 |
| A | 12 | 115 | 648332 | 4529.46 | 578 | 564 | 143.0 |
| A | 3 | 14 | 93157 | 647.45 | 578 | 564 | 143.0 |
| B | 5 | 185 | 200517 | 1360.55 | 677 | 650 | 146.9 |
| B | 4 | 81 | 58241 | 392.04 | 677 | 650 | 146.9 |
| B | 10 | 247 | 22874 | 151.28 | 677 | 650 | 146.9 |
| C | 1 | 16 | 405116 | 2205.6 | 666 | 662 | 183.4 |
| C | 13 | 3 | 95612 | 517.79 | 666 | 662 | 183.4 |
| C | 12 | 249 | 95372 | 516.48 | 666 | 662 | 183.4 |
| D | 2 | 249 | 1002253 | 5518.04 | 637 | 607 | 181.5 |
| D | 11 | 129 | 956309 | 5264.93 | 637 | 607 | 181.5 |
| D | 7 | 96 | 213746 | 1174.18 | 637 | 607 | 181.5 |
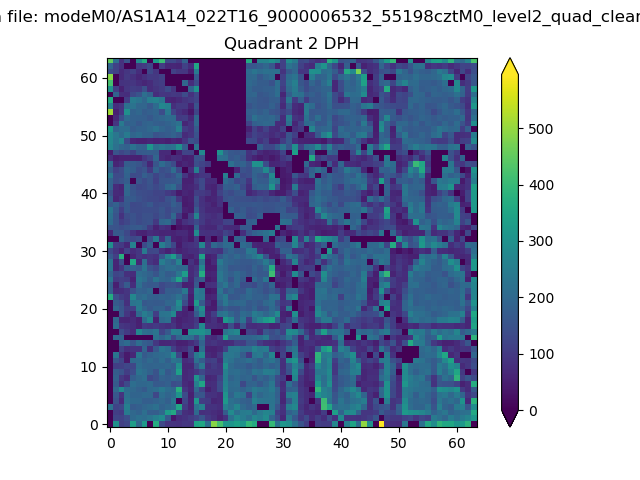
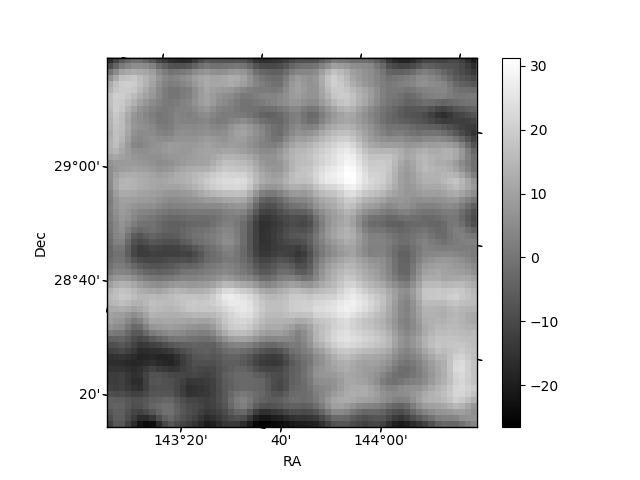
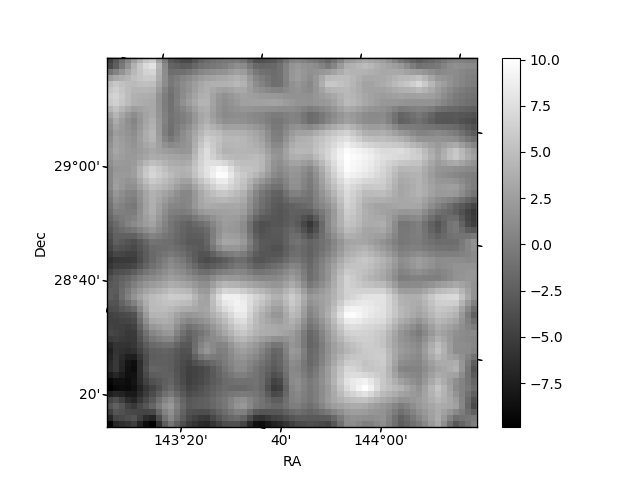
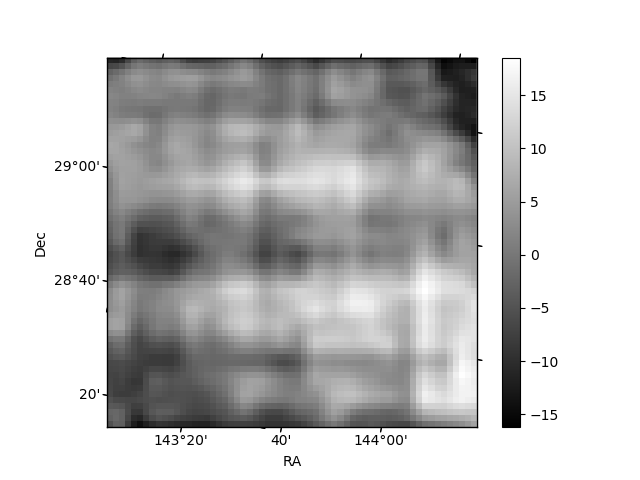
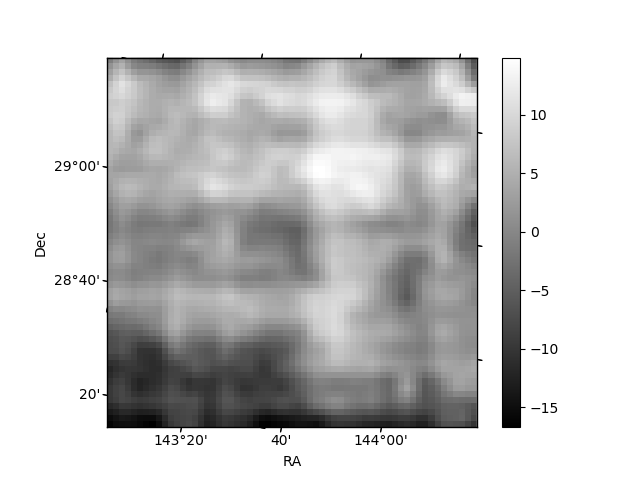
Histogram calculated using DETX and DETY for each event in the final _common_clean file
| Quadrant A | 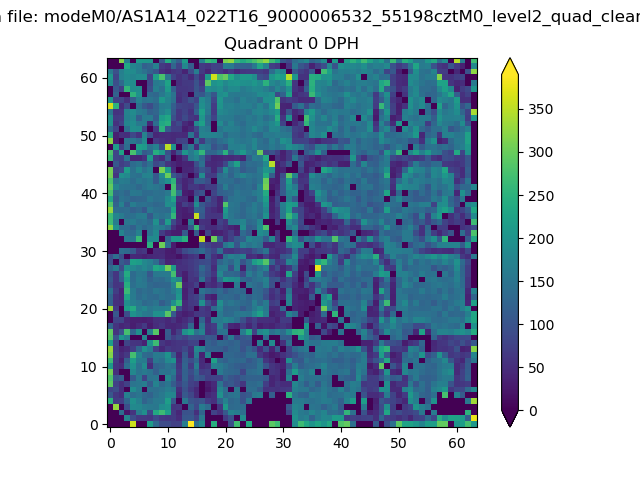 |
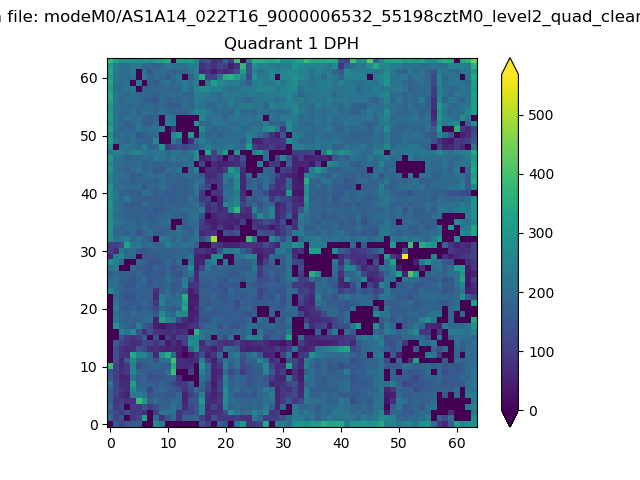 |
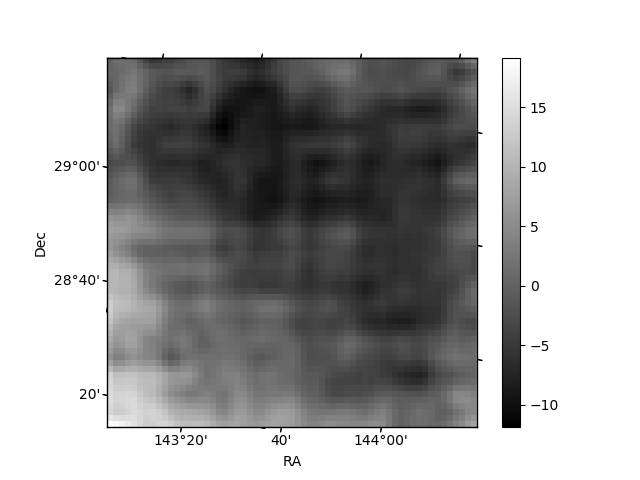
Quadrant B |
|---|---|---|---|
| Quadrant D | 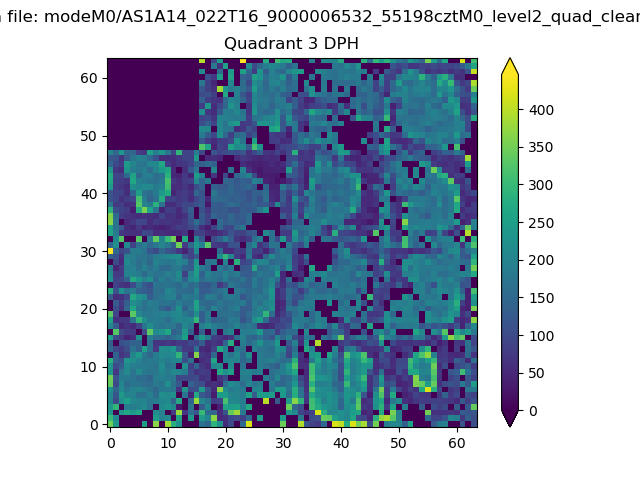 |
 |
Quadrant C |
| Plot type | Count rate plots | Images |
|---|---|---|
| Comparison with Poisson distribution Blue bars denote a histogram of data divided into 1 sec bins. Red curve is a Poisson curve with rate = median count rate of data. |
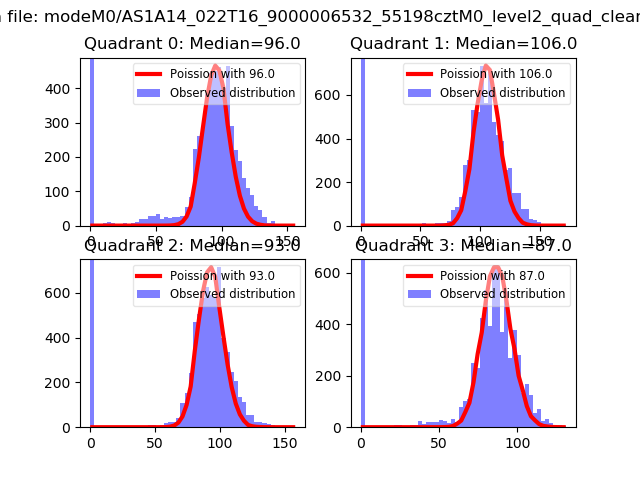 |
 |
| Quadrant-wise count rates Data is divided into 100 sec bins |
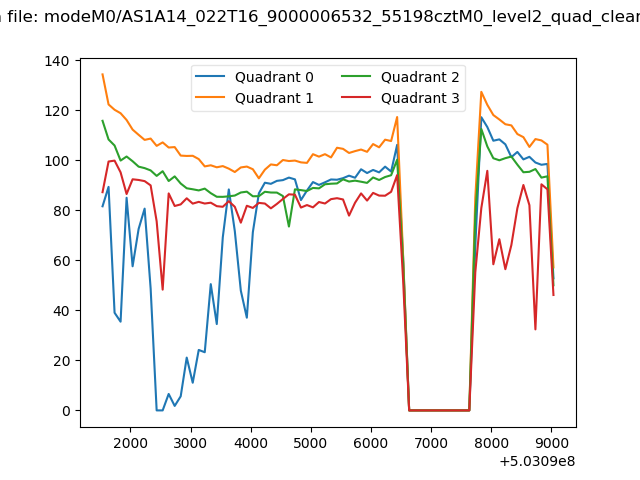 |
|
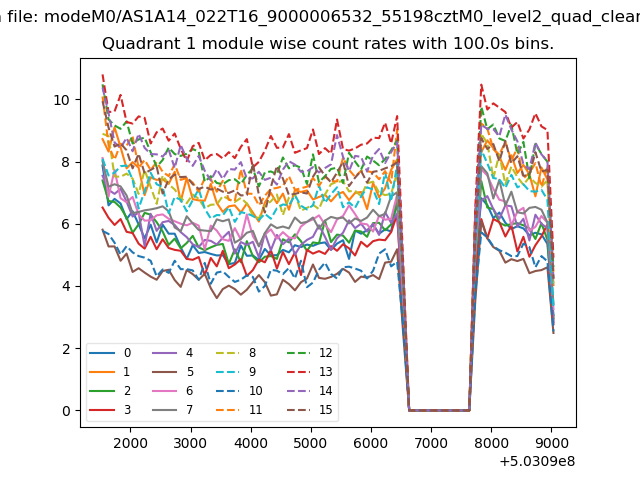
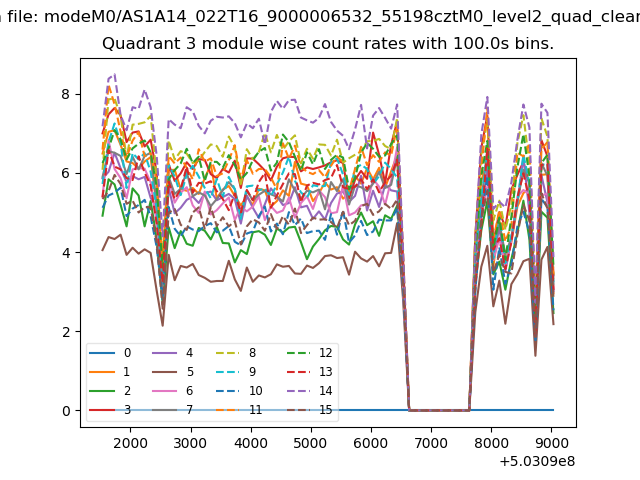
| Module-wise count rates for Quadrant A Data is divided into 100 sec bins |
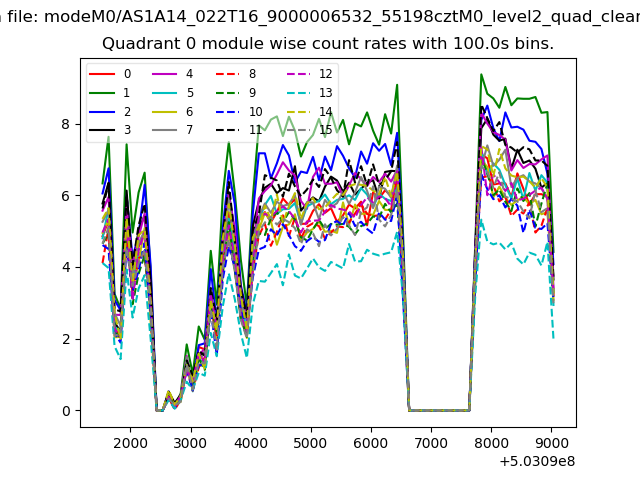 |
 |
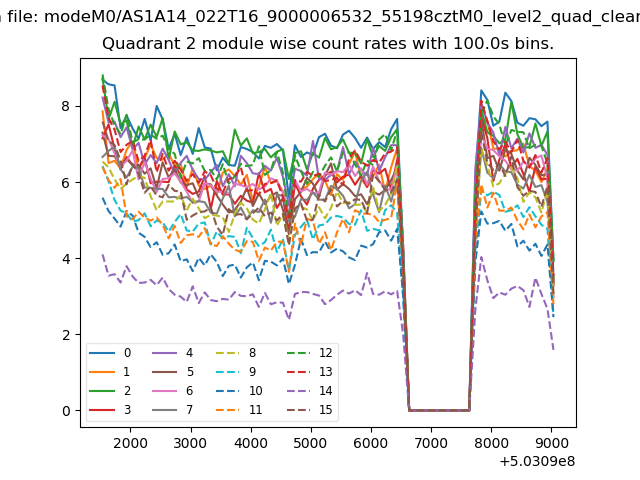
| Module-wise count rates for Quadrant B Data is divided into 100 sec bins |
 |
 |
| Module-wise count rates for Quadrant C Data is divided into 100 sec bins |
 |
 |
| Module-wise count rates for Quadrant D Data is divided into 100 sec bins |
 |
 |
| Parameter | Plot |
|---|---|
| CZT HV Monitor | 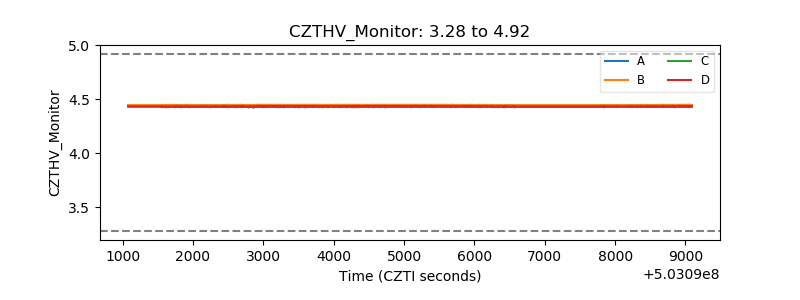 |
| D_VDD | 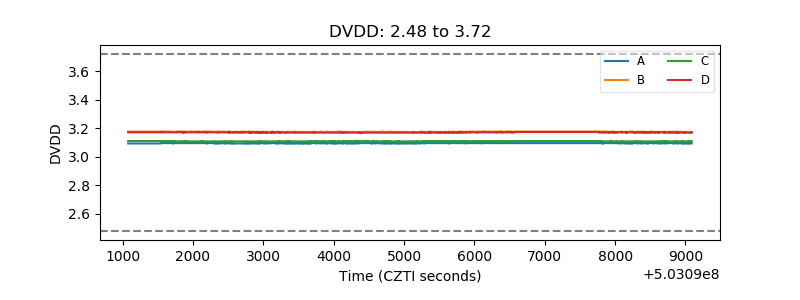 |
| Temperature 1 | 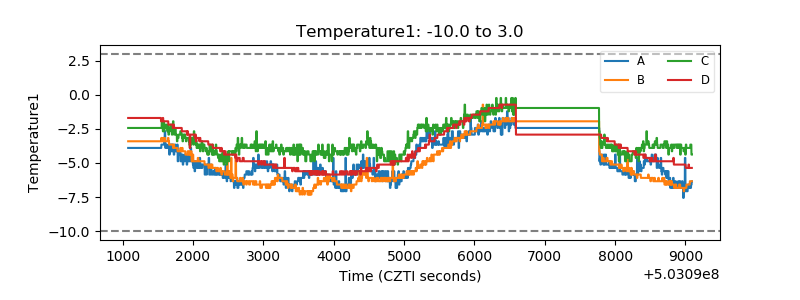 |
| Veto HV Monitor | 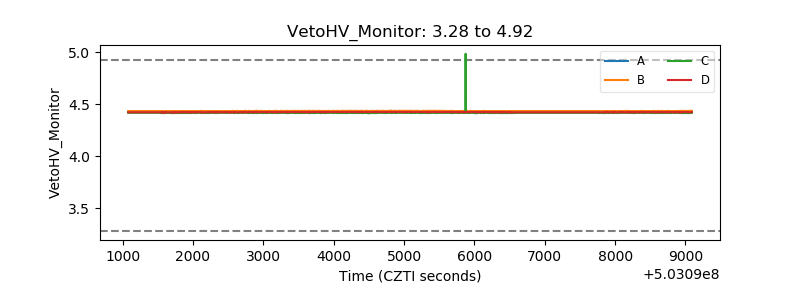 |
| Veto LLD | 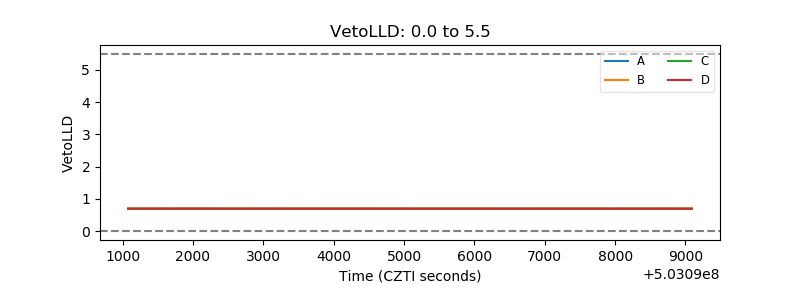 |
| Alpha Counter | 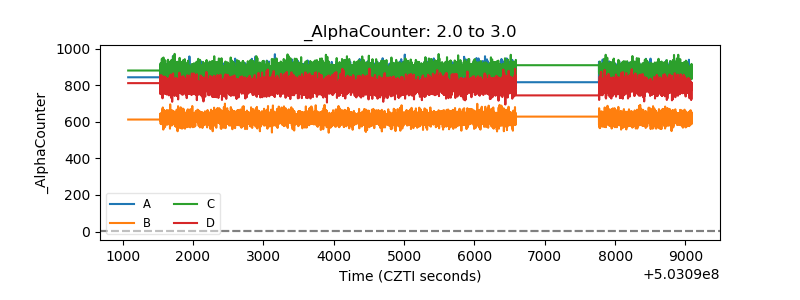 |
| _CPM_Rate | 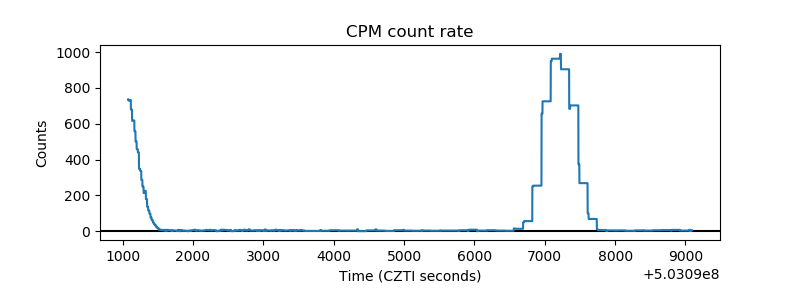 |
| CZT Counter | 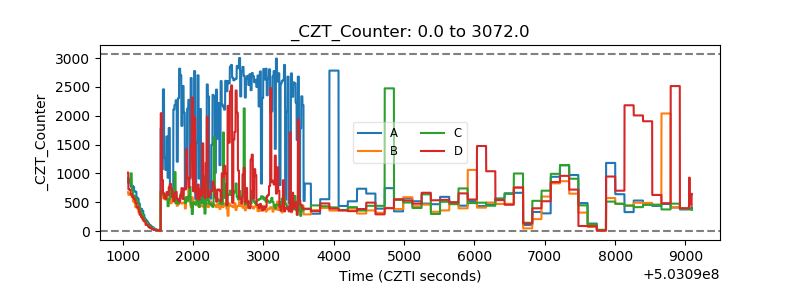 |
| +2.5 Volts monitor | 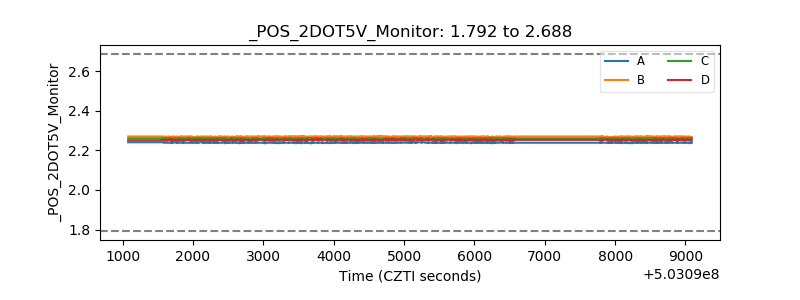 |
| +5 Volts monitor | 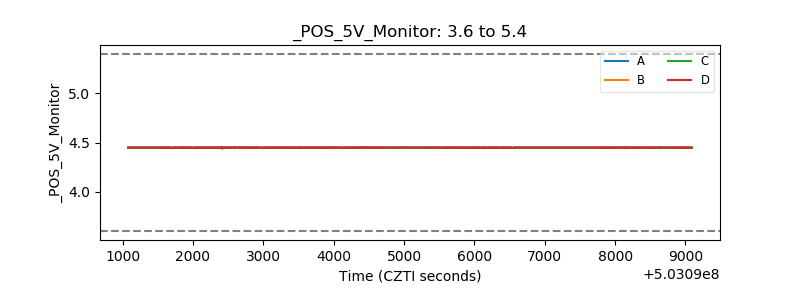 |
| _ROLL_ROT | 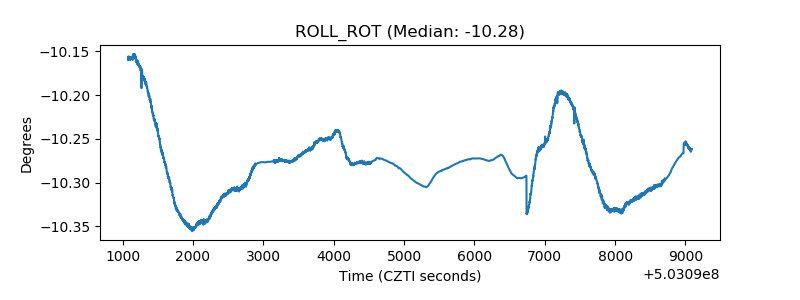 |
| _Roll_DEC | 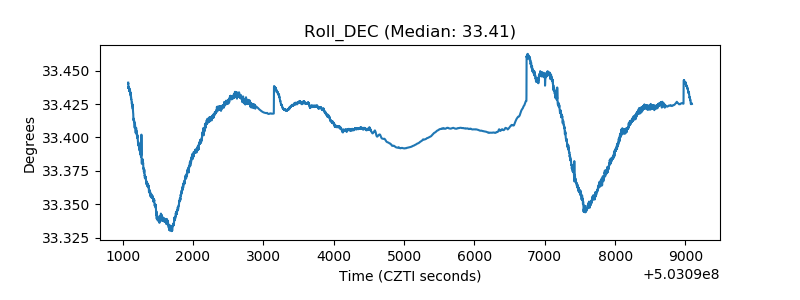 |
| _Roll_RA | 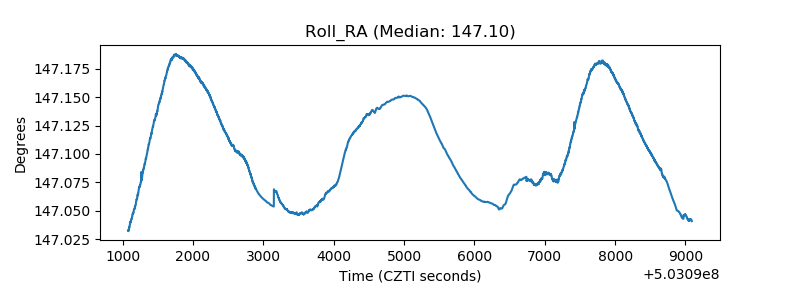 |
| Veto Counter | 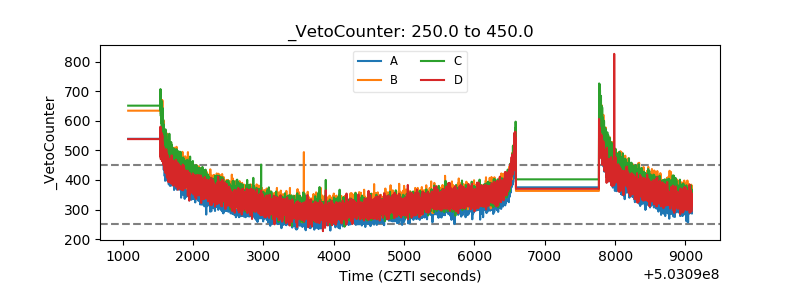 |