| Param | Original file | Final file |
|---|---|---|
| Filename | modeM0/AS1A14_022T16_9000006532_55200cztM0_level2.fits | modeM0/AS1A14_022T16_9000006532_55200cztM0_level2_quad_clean.evt |
| Size (bytes) | 438,099,840 | 98,850,240 |
| Size | 417.8 MB | 94.3 MB |
| Events in quadrant A | 3,799,656 | 649,125 |
| Events in quadrant B | 3,018,430 | 709,703 |
| Events in quadrant C | 3,374,917 | 621,626 |
| Events in quadrant D | 5,497,100 | 540,713 |
| Mode SS | |||
|---|---|---|---|
| Quadrant | BADHDUFLAG | Total packets | Discarded packets |
| A | 0 | 138 | 0 |
| B | 0 | 138 | 0 |
| C | 0 | 138 | 0 |
| D | 0 | 138 | 0 |
| Mode M0 | |||
|---|---|---|---|
| Quadrant | BADHDUFLAG | Total packets | Discarded packets |
| A | 0 | 16298 | 2 |
| B | 0 | 14204 | 2 |
| C | 0 | 15297 | 2 |
| D | 0 | 21266 | 3 |
| Mode M9 | |||
|---|---|---|---|
| Quadrant | BADHDUFLAG | Total packets | Discarded packets |
| A | 0 | 19 | 0 |
| B | 0 | 19 | 0 |
| C | 0 | 20 | 0 |
| D | 0 | 20 | 0 |
| Quadrant | Total seconds | Saturated seconds | Saturation percentage |
|---|---|---|---|
| A | 6774 | 125 | 1.845291% |
| B | 6774 | 48 | 0.708592% |
| C | 6774 | 92 | 1.358134% |
| D | 6773 | 677 | 9.995571% |
Noise dominated data is calculated using 1-second bins in cleaned event files. If a bin has >2000 counts, and if more than 50% of those come from <1% of pixels, then it is considered to be noise-dominated and hence unusable.
| Quadrant | # 1 sec bins | Bins with >0 counts | Bins with >2000 counts | High rate bins dominated by noise | Noise dominated (total time) | Noise dominated (detector-on time) | Marked lightcurve |
|---|---|---|---|---|---|---|---|
| A | 7904 | 6776 | 101 | 101 | 1.28% | 1.49% | 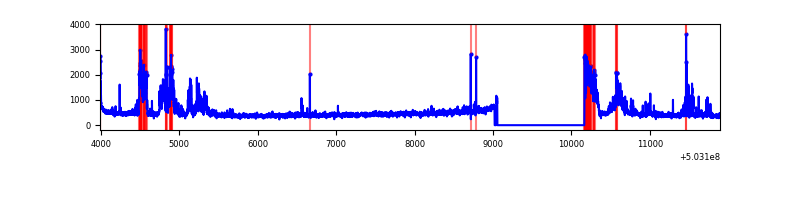 |
| B | 7904 | 6776 | 8 | 8 | 0.10% | 0.12% | 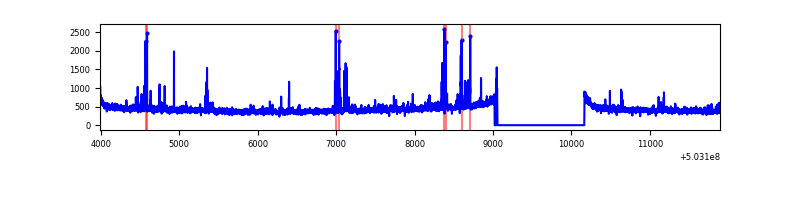 |
| C | 7904 | 6776 | 72 | 72 | 0.91% | 1.06% | 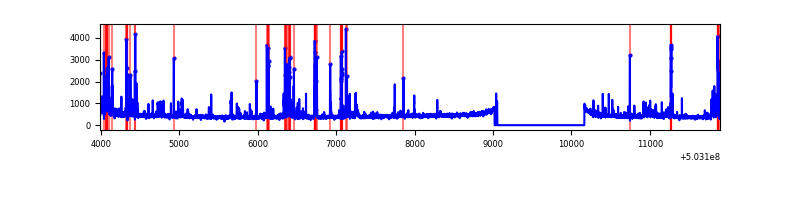 |
| D | 7903 | 6775 | 512 | 512 | 6.48% | 7.56% | 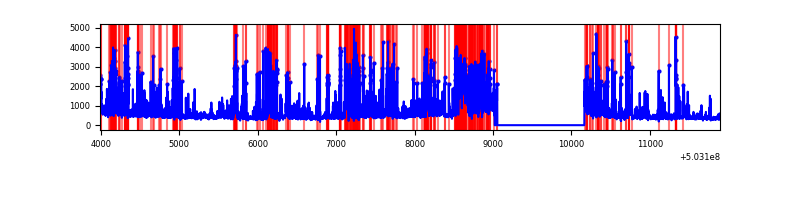 |
Top three noisy pixels from each quadrant. If the there are fewer than three noisy pixels in the level2.evt file, extra rows are filled as -1
| Pixel properties | Quadrant properties | ||||||
|---|---|---|---|---|---|---|---|
| Quadrant | DetID | PixID | Counts | Sigma | Mean | Median | Sigma |
| A | 12 | 115 | 816651 | 4607.06 | 709 | 693 | 177.1 |
| A | 3 | 14 | 96131 | 538.86 | 709 | 693 | 177.1 |
| A | 3 | 45 | 51011 | 284.11 | 709 | 693 | 177.1 |
| B | 10 | 247 | 119101 | 774.91 | 712 | 687 | 152.8 |
| B | 4 | 81 | 34584 | 221.82 | 712 | 687 | 152.8 |
| B | 12 | 111 | 18456 | 116.28 | 712 | 687 | 152.8 |
| C | 13 | 3 | 260446 | 1353.23 | 694 | 687 | 192.0 |
| C | 14 | 254 | 140177 | 726.68 | 694 | 687 | 192.0 |
| C | 1 | 16 | 76403 | 394.45 | 694 | 687 | 192.0 |
| D | 2 | 249 | 1155387 | 6179.44 | 655 | 628 | 186.9 |
| D | 7 | 96 | 992668 | 5308.68 | 655 | 628 | 186.9 |
| D | 11 | 129 | 581066 | 3106.09 | 655 | 628 | 186.9 |
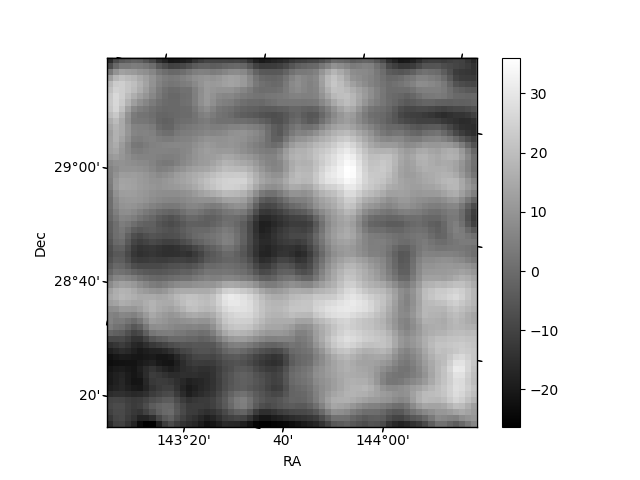
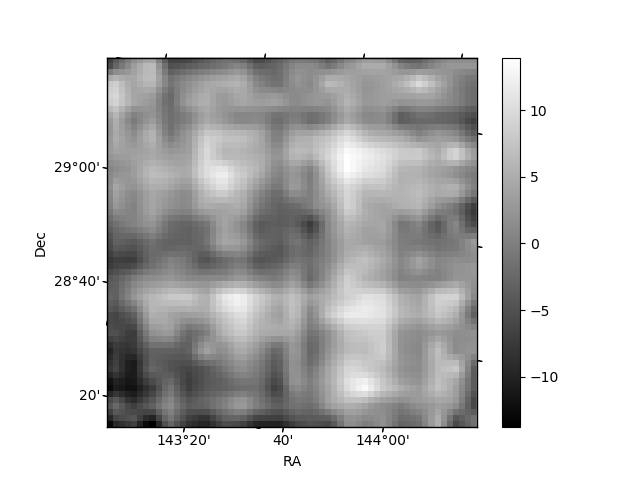
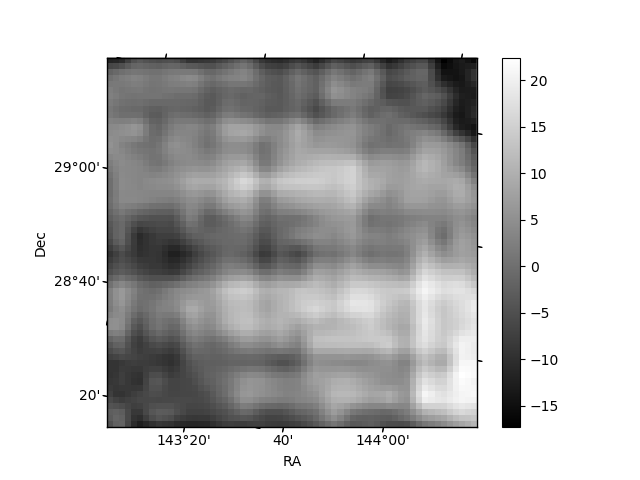
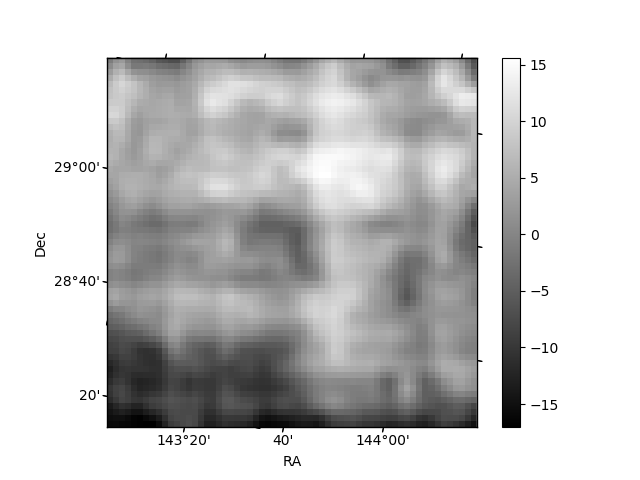
Histogram calculated using DETX and DETY for each event in the final _common_clean file
| Quadrant A | 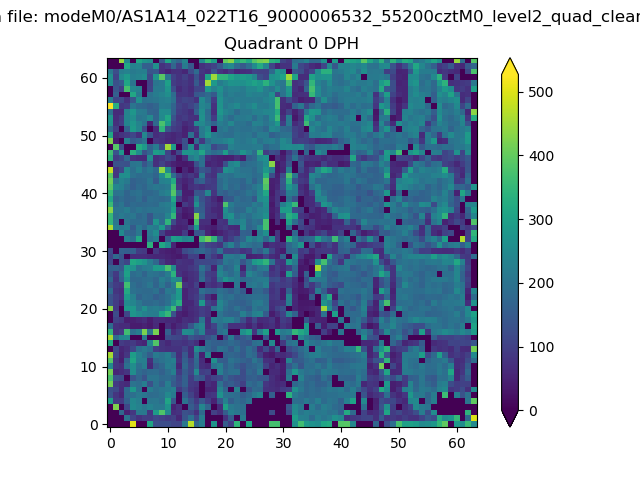 |
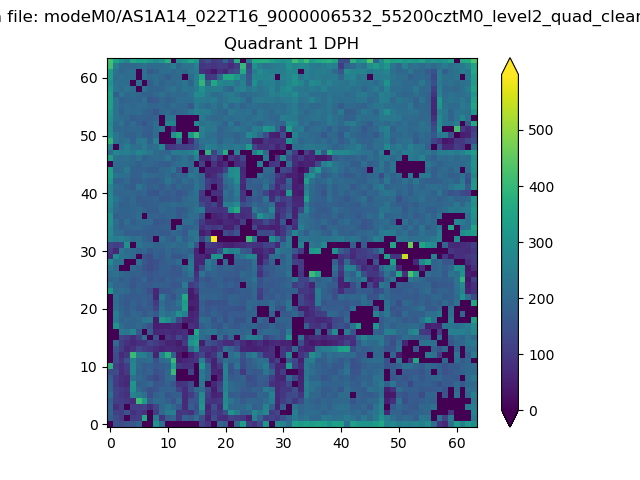 |
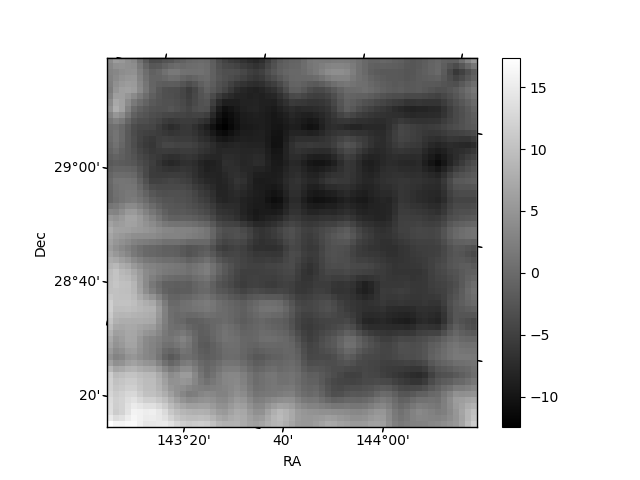
Quadrant B |
|---|---|---|---|
| Quadrant D | 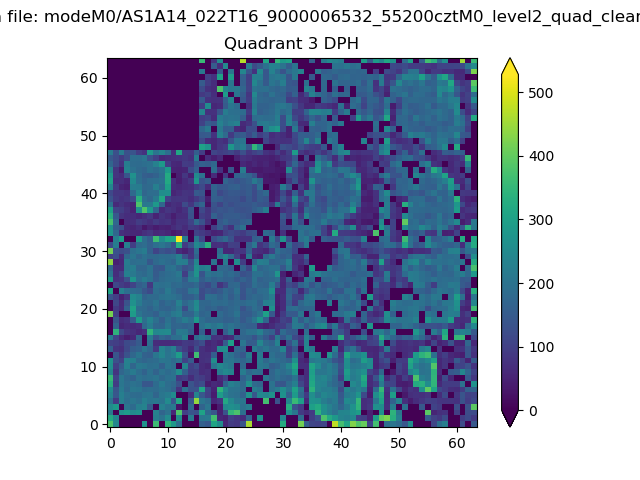 |
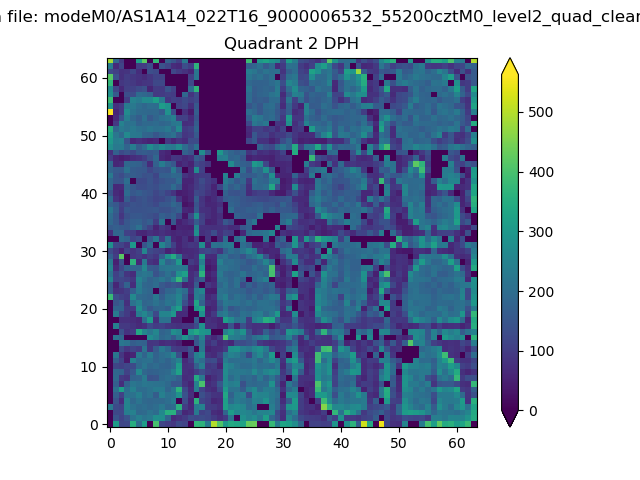 |
Quadrant C |
| Plot type | Count rate plots | Images |
|---|---|---|
| Comparison with Poisson distribution Blue bars denote a histogram of data divided into 1 sec bins. Red curve is a Poisson curve with rate = median count rate of data. |
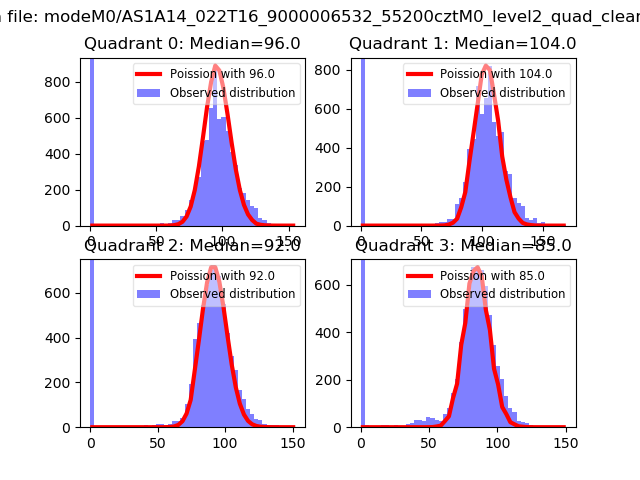 |
 |
| Quadrant-wise count rates Data is divided into 100 sec bins |
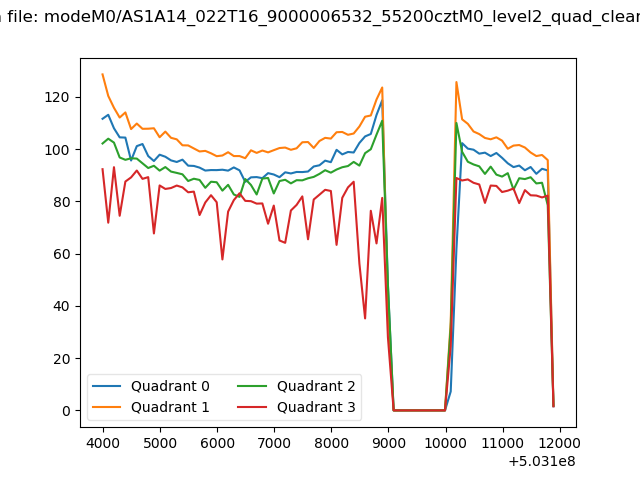 |
|
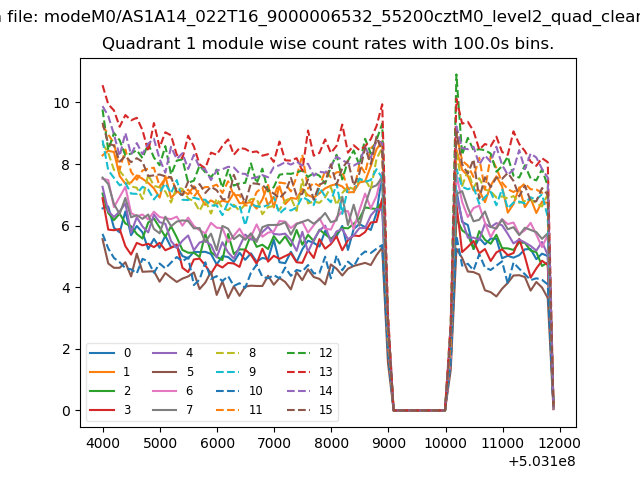
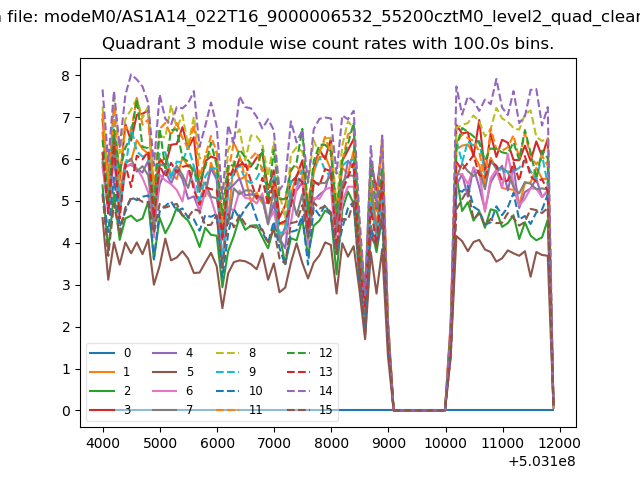
| Module-wise count rates for Quadrant A Data is divided into 100 sec bins |
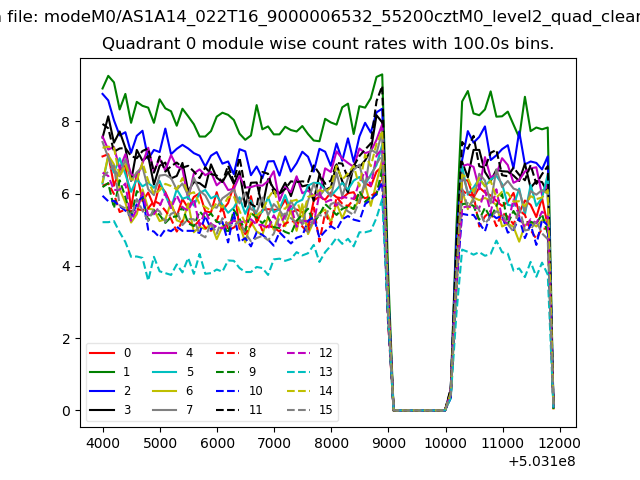 |
 |
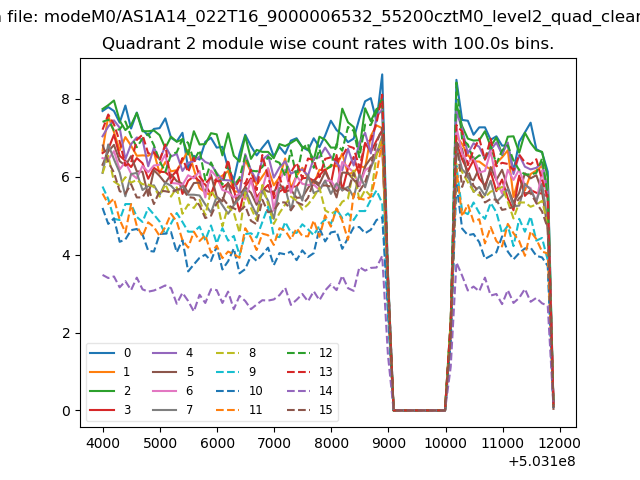
| Module-wise count rates for Quadrant B Data is divided into 100 sec bins |
 |
 |
| Module-wise count rates for Quadrant C Data is divided into 100 sec bins |
 |
 |
| Module-wise count rates for Quadrant D Data is divided into 100 sec bins |
 |
 |
| Parameter | Plot |
|---|---|
| CZT HV Monitor | 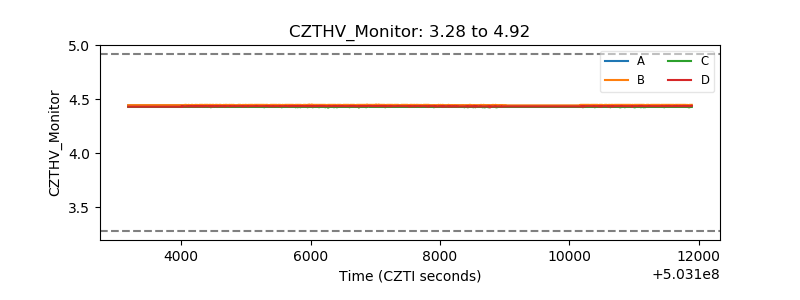 |
| D_VDD | 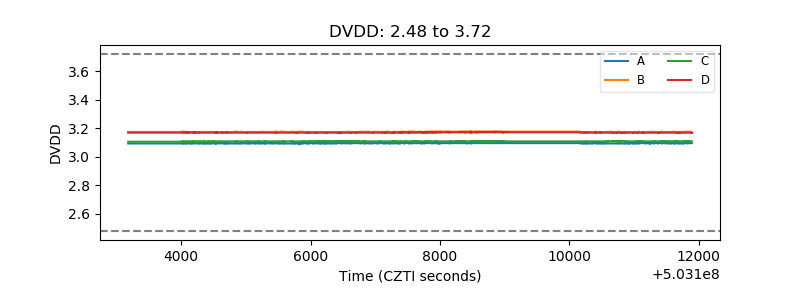 |
| Temperature 1 | 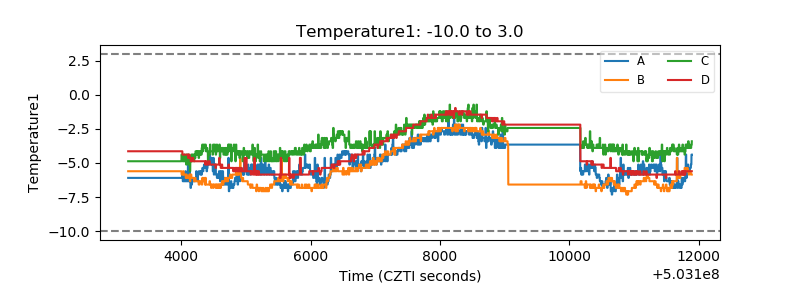 |
| Veto HV Monitor | 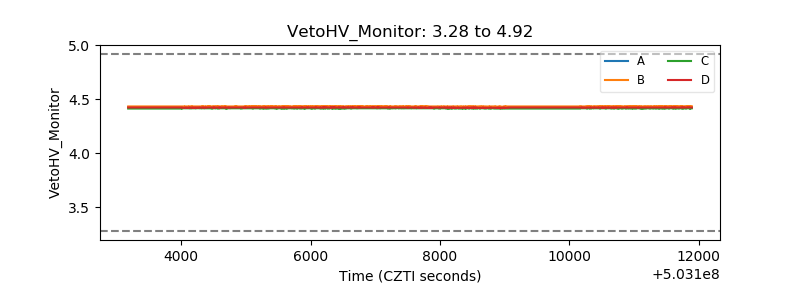 |
| Veto LLD | 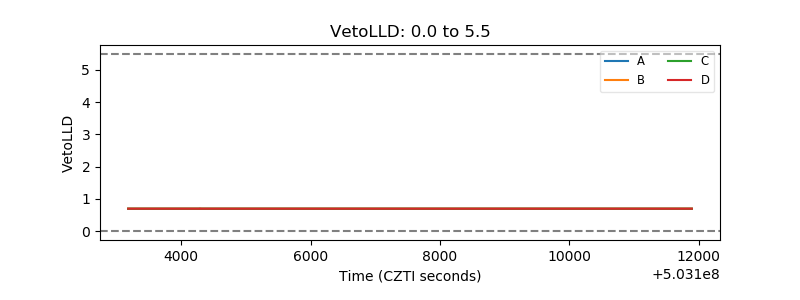 |
| Alpha Counter | 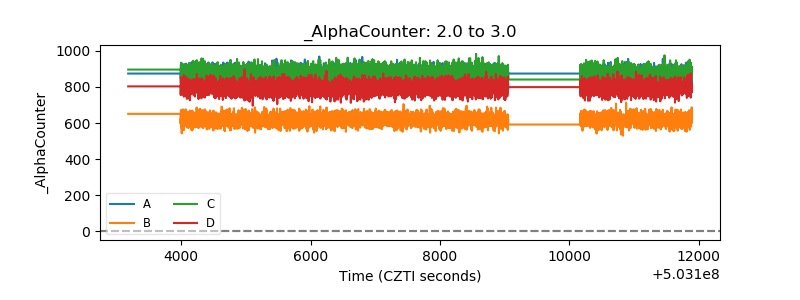 |
| _CPM_Rate | 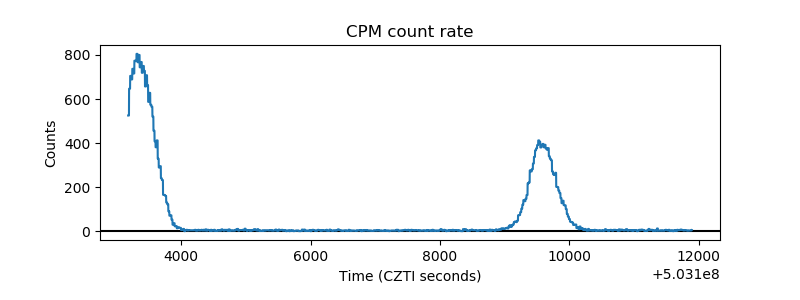 |
| CZT Counter | 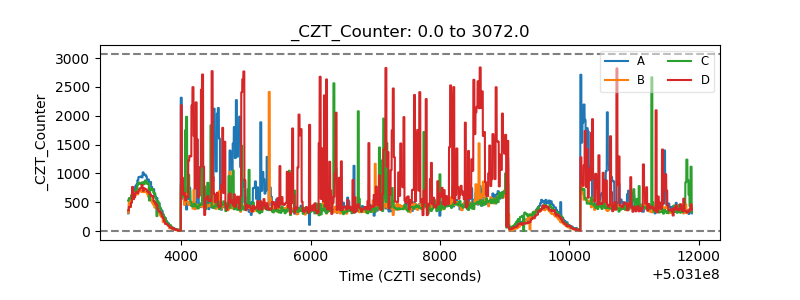 |
| +2.5 Volts monitor |  |
| +5 Volts monitor |  |
| _ROLL_ROT | 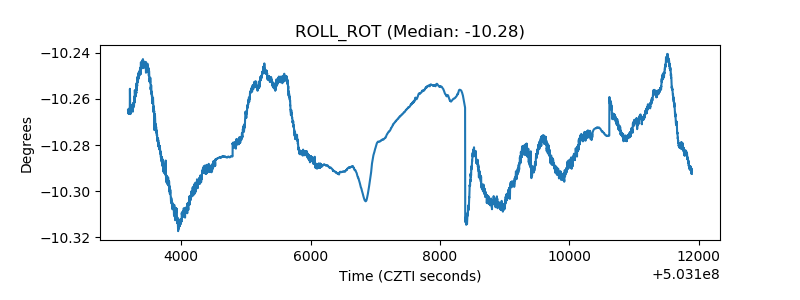 |
| _Roll_DEC | 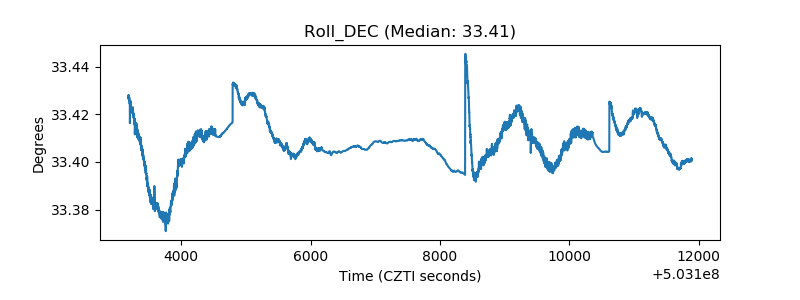 |
| _Roll_RA | 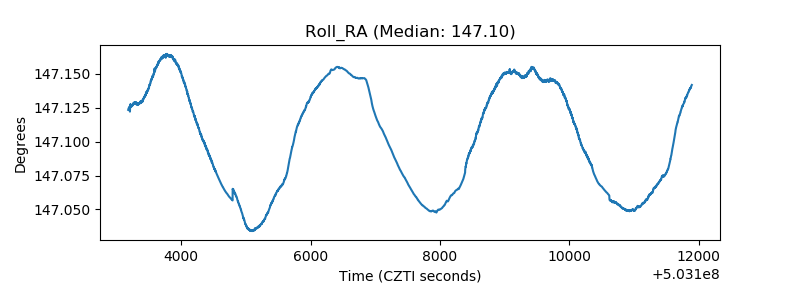 |
| Veto Counter | 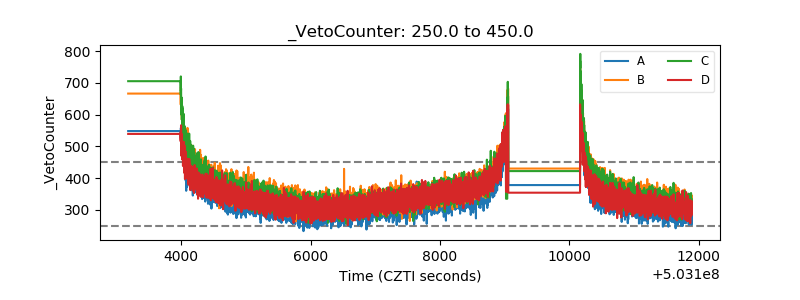 |