| Param | Original file | Final file |
|---|---|---|
| Filename | modeM0/AS1A14_022T16_9000006532_55201cztM0_level2.fits | modeM0/AS1A14_022T16_9000006532_55201cztM0_level2_quad_clean.evt |
| Size (bytes) | 421,718,400 | 110,364,480 |
| Size | 402.2 MB | 105.3 MB |
| Events in quadrant A | 3,601,996 | 732,846 |
| Events in quadrant B | 3,054,111 | 767,264 |
| Events in quadrant C | 3,303,767 | 700,522 |
| Events in quadrant D | 5,107,352 | 654,848 |
| Mode SS | |||
|---|---|---|---|
| Quadrant | BADHDUFLAG | Total packets | Discarded packets |
| A | 0 | 142 | 0 |
| B | 0 | 142 | 0 |
| C | 0 | 142 | 0 |
| D | 0 | 142 | 0 |
| Mode M0 | |||
|---|---|---|---|
| Quadrant | BADHDUFLAG | Total packets | Discarded packets |
| A | 0 | 16098 | 2 |
| B | 0 | 14651 | 2 |
| C | 0 | 15412 | 2 |
| D | 0 | 20548 | 3 |
| Mode M9 | |||
|---|---|---|---|
| Quadrant | BADHDUFLAG | Total packets | Discarded packets |
| A | 0 | 9 | 0 |
| B | 0 | 9 | 0 |
| C | 0 | 10 | 0 |
| D | 0 | 10 | 0 |
| Quadrant | Total seconds | Saturated seconds | Saturation percentage |
|---|---|---|---|
| A | 6985 | 167 | 2.390838% |
| B | 6985 | 86 | 1.231210% |
| C | 6985 | 75 | 1.073729% |
| D | 6984 | 450 | 6.443299% |
Noise dominated data is calculated using 1-second bins in cleaned event files. If a bin has >2000 counts, and if more than 50% of those come from <1% of pixels, then it is considered to be noise-dominated and hence unusable.
| Quadrant | # 1 sec bins | Bins with >0 counts | Bins with >2000 counts | High rate bins dominated by noise | Noise dominated (total time) | Noise dominated (detector-on time) | Marked lightcurve |
|---|---|---|---|---|---|---|---|
| A | 7905 | 6986 | 63 | 63 | 0.80% | 0.90% | 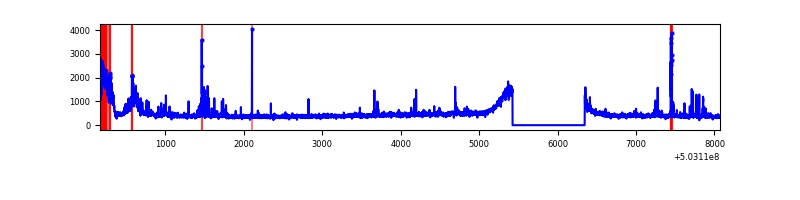 |
| B | 7905 | 6986 | 8 | 8 | 0.10% | 0.11% | 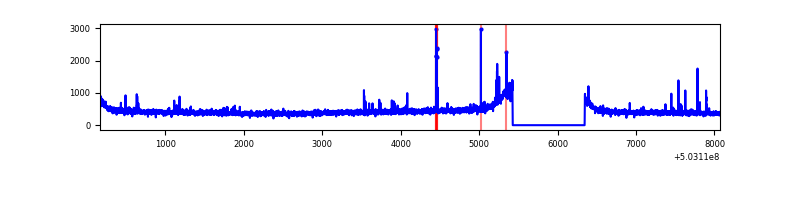 |
| C | 7905 | 6986 | 32 | 32 | 0.40% | 0.46% | 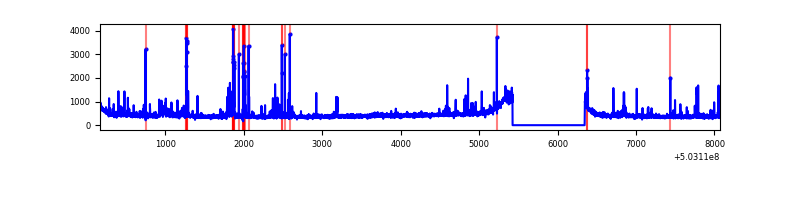 |
| D | 7904 | 6985 | 329 | 329 | 4.16% | 4.71% | 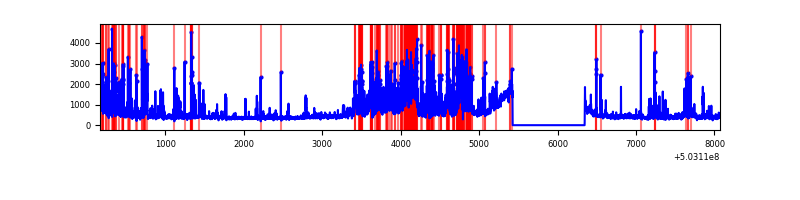 |
Top three noisy pixels from each quadrant. If the there are fewer than three noisy pixels in the level2.evt file, extra rows are filled as -1
| Pixel properties | Quadrant properties | ||||||
|---|---|---|---|---|---|---|---|
| Quadrant | DetID | PixID | Counts | Sigma | Mean | Median | Sigma |
| A | 12 | 115 | 378432 | 1909.24 | 766 | 748 | 197.8 |
| A | 0 | 8 | 72959 | 365.04 | 766 | 748 | 197.8 |
| A | 3 | 45 | 55999 | 279.3 | 766 | 748 | 197.8 |
| B | 10 | 247 | 20226 | 119.94 | 750 | 725 | 162.6 |
| B | 12 | 111 | 19422 | 115.0 | 750 | 725 | 162.6 |
| B | 11 | 111 | 17955 | 105.97 | 750 | 725 | 162.6 |
| C | 13 | 3 | 135734 | 640.25 | 739 | 729 | 210.9 |
| C | 14 | 254 | 120269 | 566.91 | 739 | 729 | 210.9 |
| C | 6 | 13 | 69591 | 326.57 | 739 | 729 | 210.9 |
| D | 2 | 249 | 923866 | 4230.54 | 732 | 698 | 218.2 |
| D | 2 | 62 | 543614 | 2487.98 | 732 | 698 | 218.2 |
| D | 7 | 96 | 301268 | 1377.4 | 732 | 698 | 218.2 |
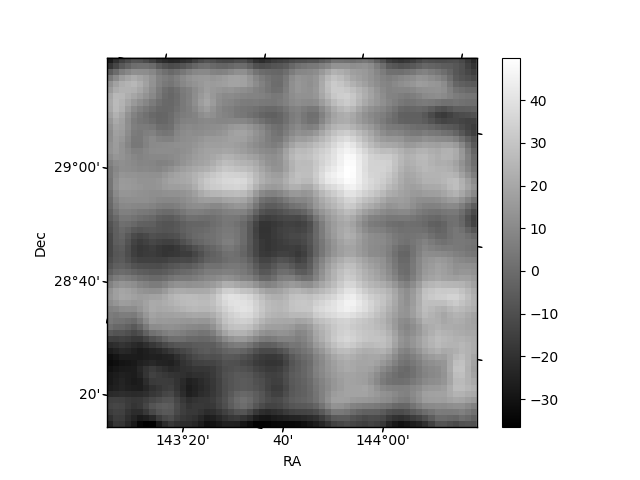
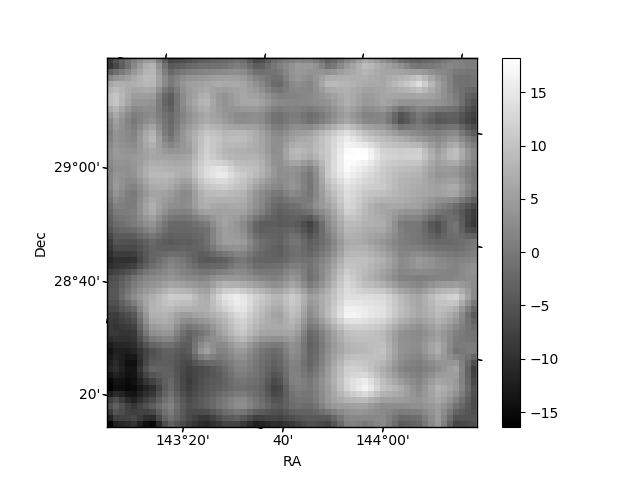
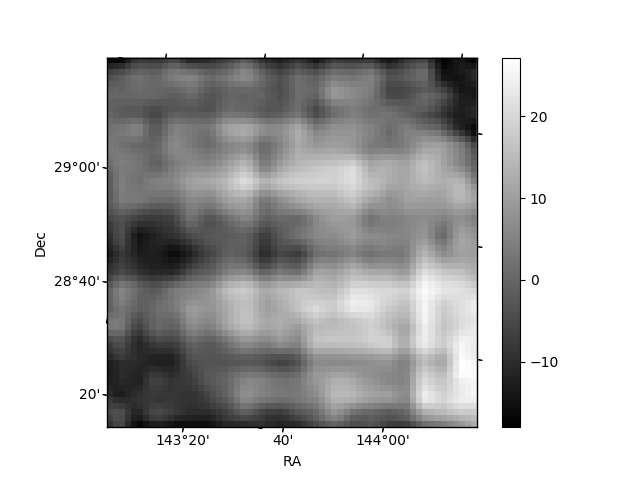
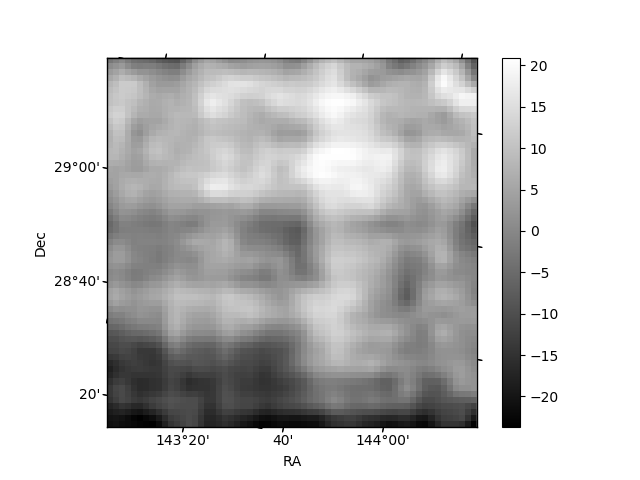
Histogram calculated using DETX and DETY for each event in the final _common_clean file
| Quadrant A | 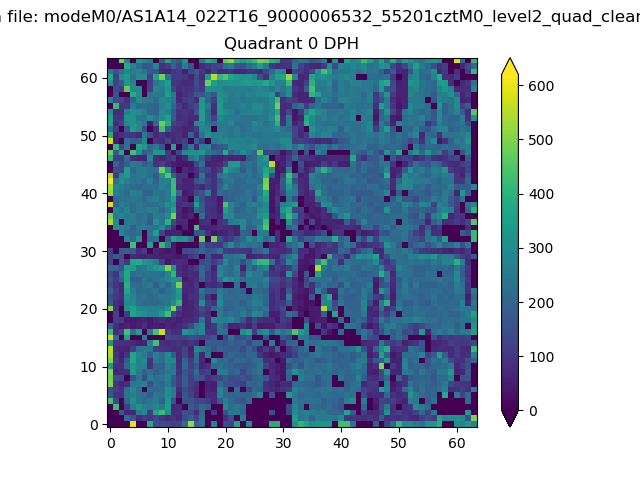 |
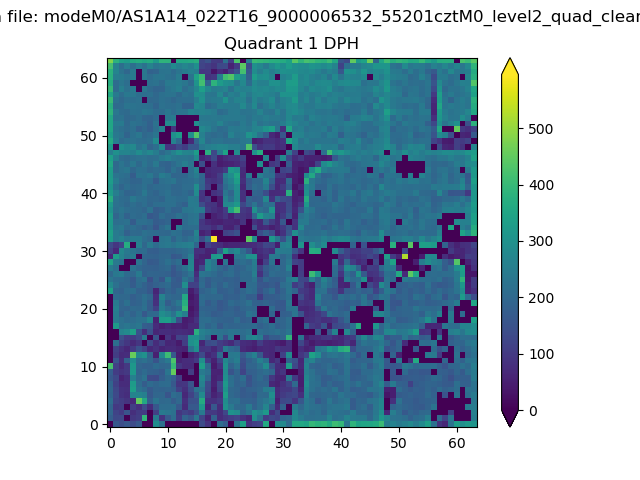 |
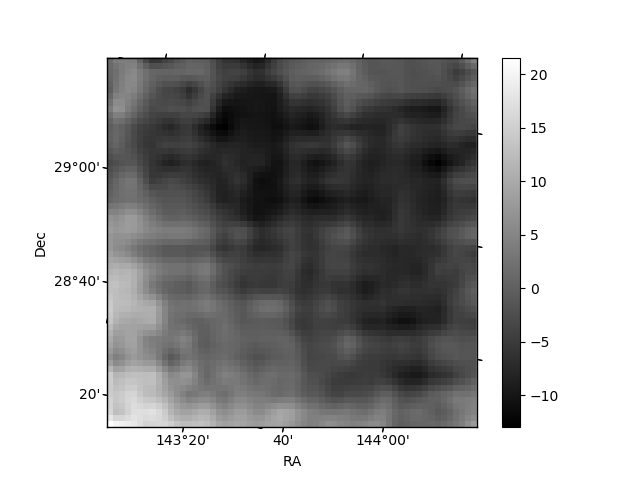
Quadrant B |
|---|---|---|---|
| Quadrant D | 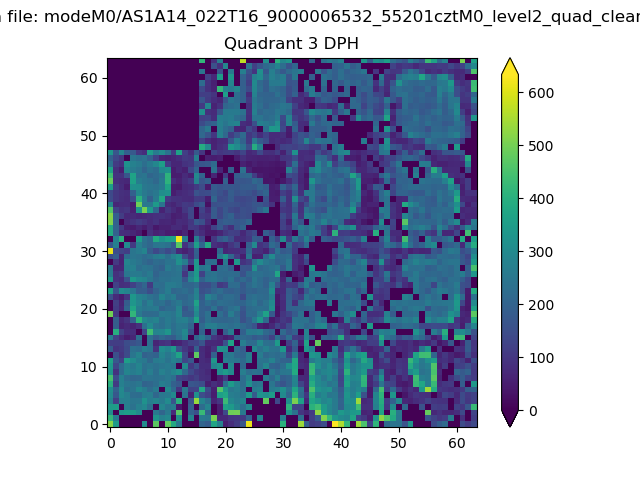 |
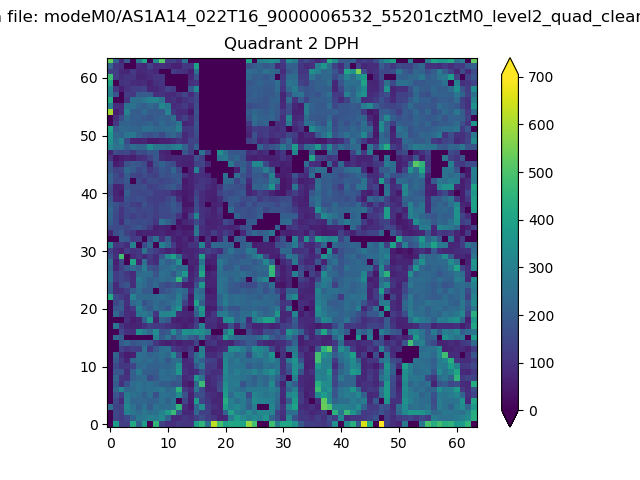 |
Quadrant C |
| Plot type | Count rate plots | Images |
|---|---|---|
| Comparison with Poisson distribution Blue bars denote a histogram of data divided into 1 sec bins. Red curve is a Poisson curve with rate = median count rate of data. |
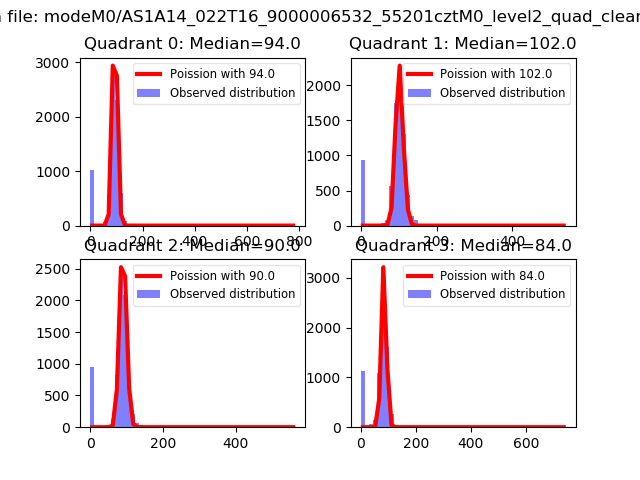 |
 |
| Quadrant-wise count rates Data is divided into 100 sec bins |
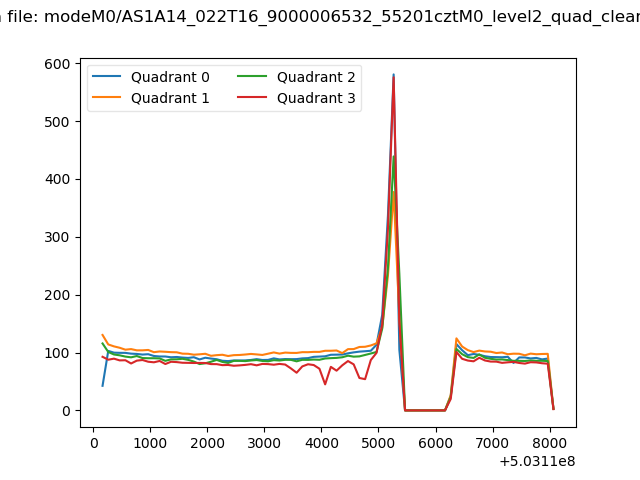 |
|
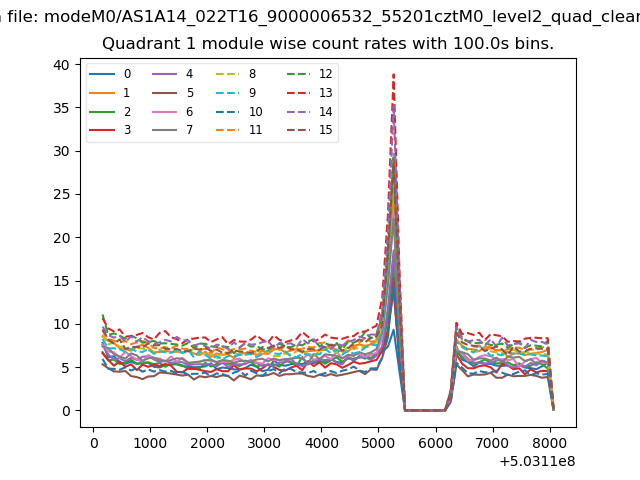
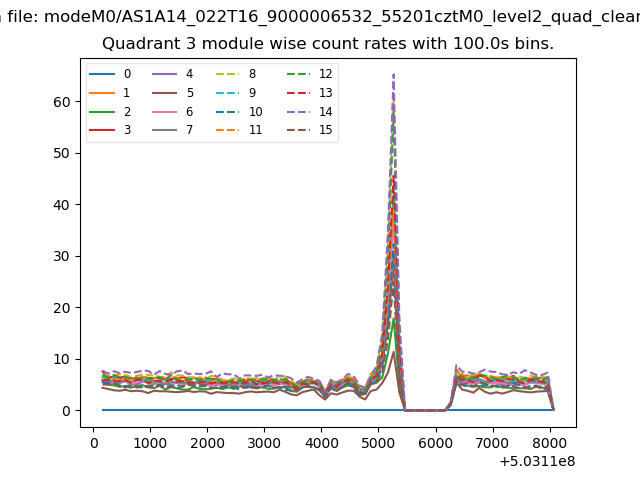
| Module-wise count rates for Quadrant A Data is divided into 100 sec bins |
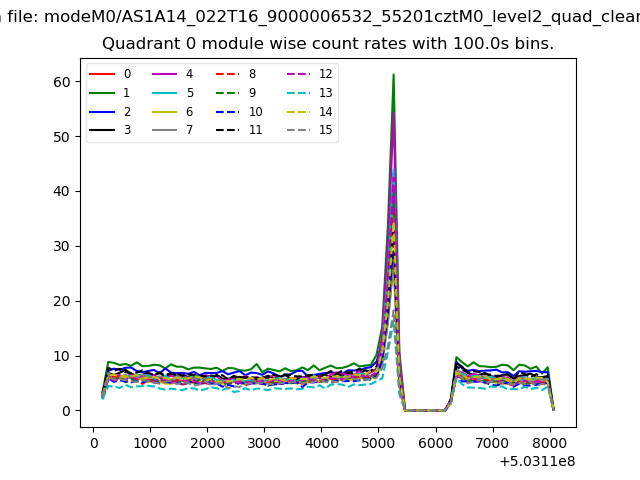 |
 |
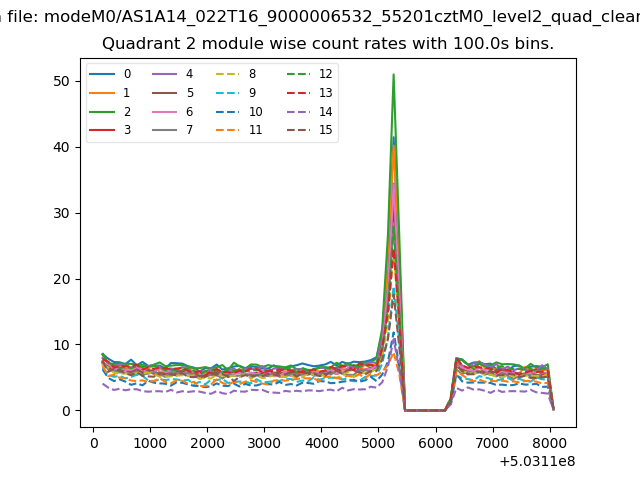
| Module-wise count rates for Quadrant B Data is divided into 100 sec bins |
 |
 |
| Module-wise count rates for Quadrant C Data is divided into 100 sec bins |
 |
 |
| Module-wise count rates for Quadrant D Data is divided into 100 sec bins |
 |
 |
| Parameter | Plot |
|---|---|
| CZT HV Monitor | 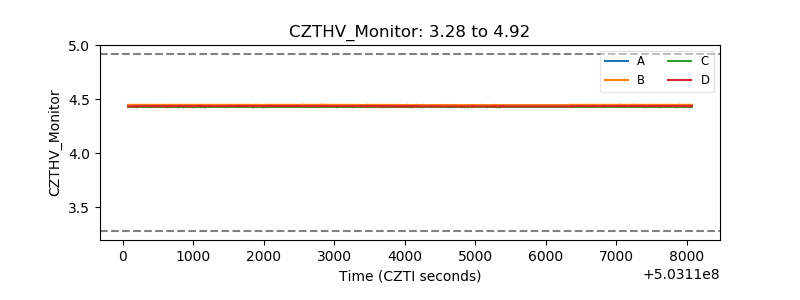 |
| D_VDD | 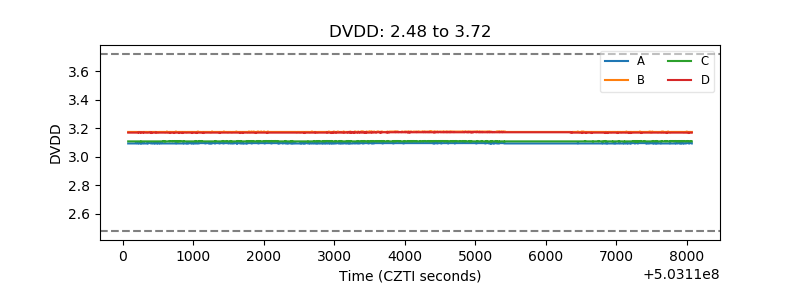 |
| Temperature 1 | 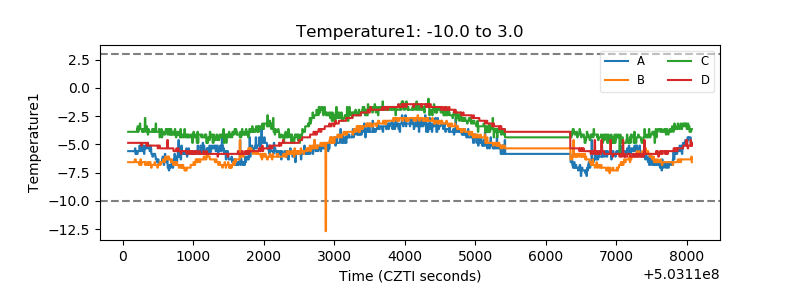 |
| Veto HV Monitor | 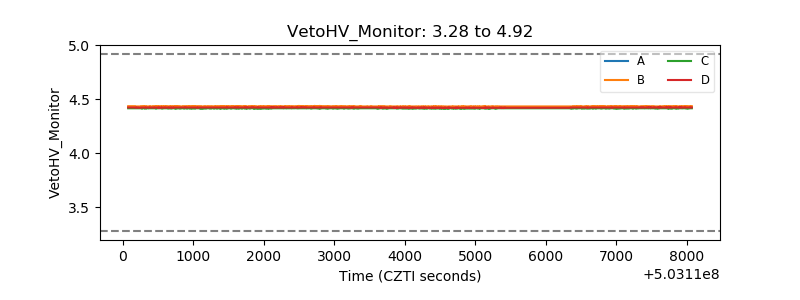 |
| Veto LLD | 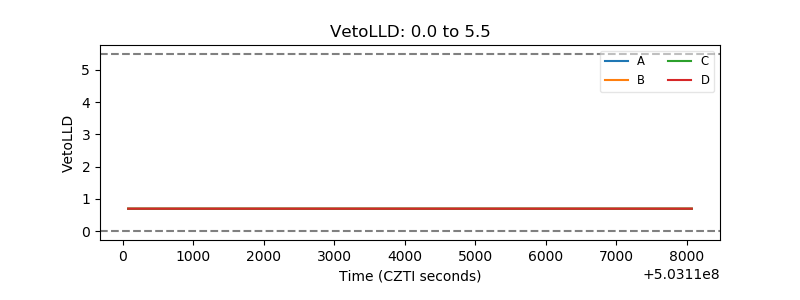 |
| Alpha Counter | 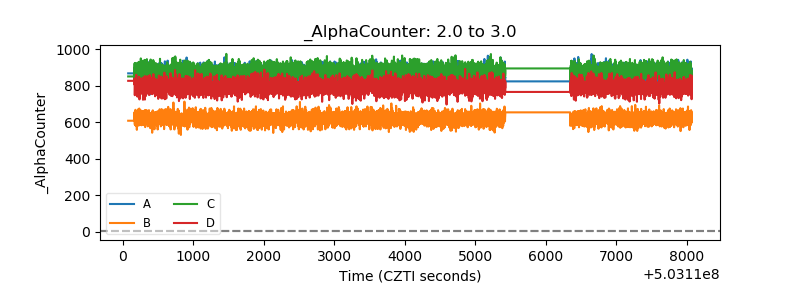 |
| _CPM_Rate | 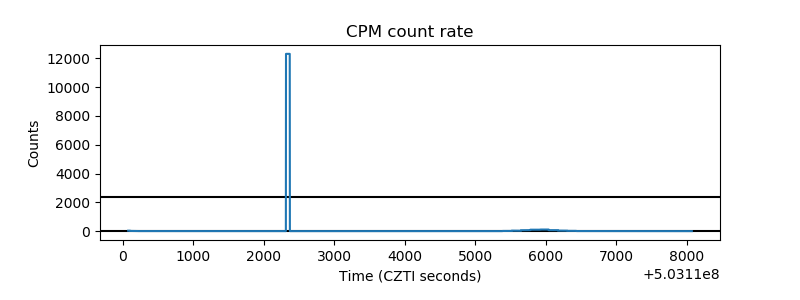 |
| CZT Counter | 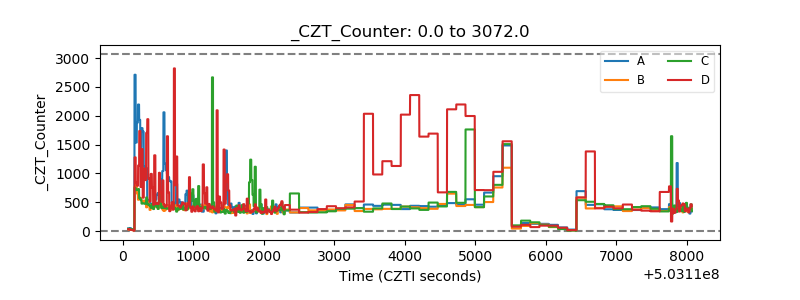 |
| +2.5 Volts monitor | 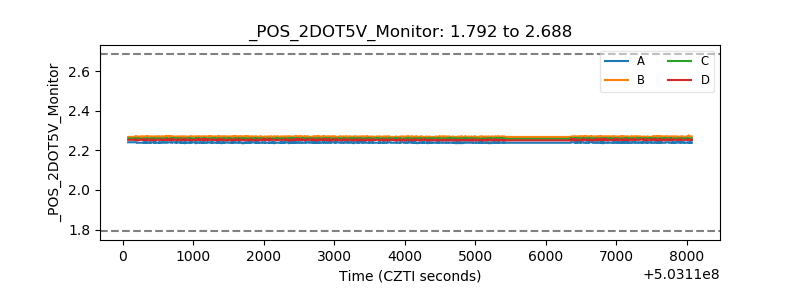 |
| +5 Volts monitor | 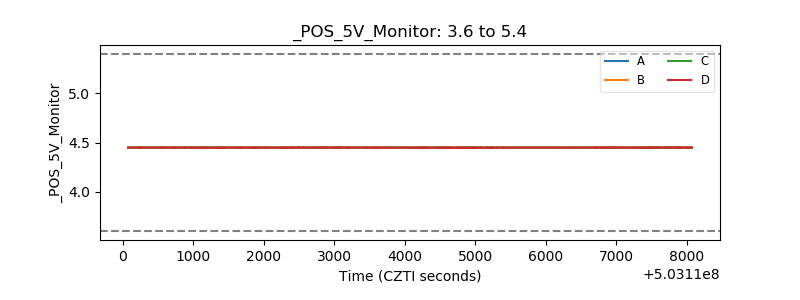 |
| _ROLL_ROT | 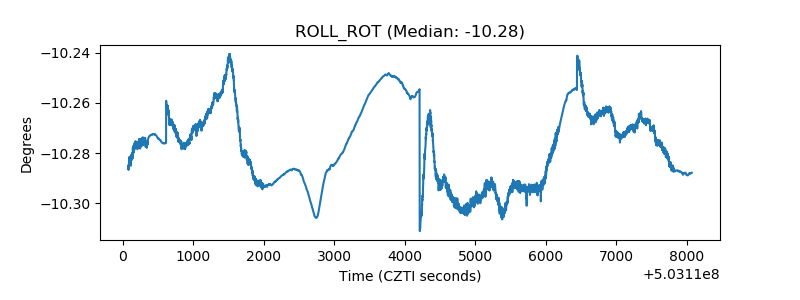 |
| _Roll_DEC | 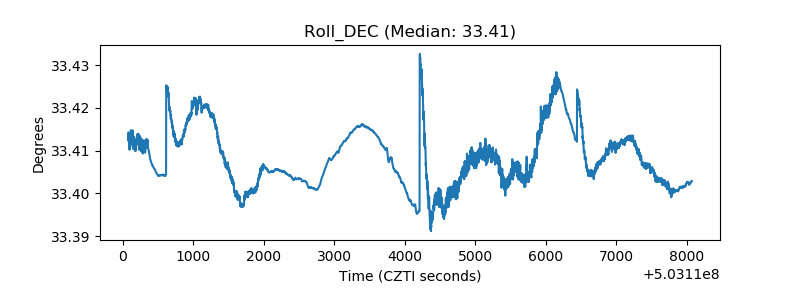 |
| _Roll_RA | 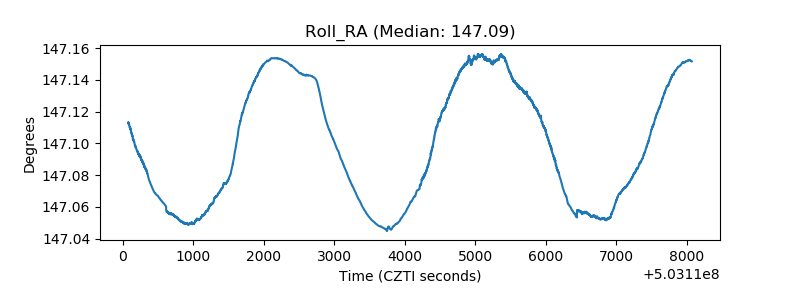 |
| Veto Counter | 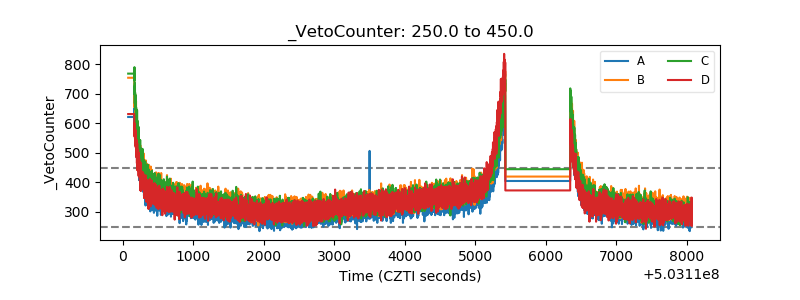 |