| Param | Original file | Final file |
|---|---|---|
| Filename | modeM0/AS1A14_022T16_9000006532_55203cztM0_level2.fits | modeM0/AS1A14_022T16_9000006532_55203cztM0_level2_quad_clean.evt |
| Size (bytes) | 497,949,120 | 118,941,120 |
| Size | 474.9 MB | 113.4 MB |
| Events in quadrant A | 3,874,279 | 786,834 |
| Events in quadrant B | 3,584,884 | 828,143 |
| Events in quadrant C | 4,012,823 | 741,512 |
| Events in quadrant D | 6,328,500 | 680,147 |
| Mode SS | |||
|---|---|---|---|
| Quadrant | BADHDUFLAG | Total packets | Discarded packets |
| A | 0 | 164 | 0 |
| B | 0 | 164 | 0 |
| C | 0 | 164 | 0 |
| D | 0 | 164 | 0 |
| Mode M0 | |||
|---|---|---|---|
| Quadrant | BADHDUFLAG | Total packets | Discarded packets |
| A | 0 | 17647 | 1 |
| B | 0 | 16978 | 1 |
| C | 0 | 18276 | 2 |
| D | 0 | 24696 | 1 |
| Mode M9 | |||
|---|---|---|---|
| Quadrant | BADHDUFLAG | Total packets | Discarded packets |
| A | 0 | 4 | 0 |
| B | 0 | 4 | 0 |
| C | 0 | 4 | 0 |
| D | 0 | 4 | 0 |
| Quadrant | Total seconds | Saturated seconds | Saturation percentage |
|---|---|---|---|
| A | 8128 | 164 | 2.017717% |
| B | 8128 | 190 | 2.337598% |
| C | 8128 | 114 | 1.402559% |
| D | 8128 | 533 | 6.557579% |
Noise dominated data is calculated using 1-second bins in cleaned event files. If a bin has >2000 counts, and if more than 50% of those come from <1% of pixels, then it is considered to be noise-dominated and hence unusable.
| Quadrant | # 1 sec bins | Bins with >0 counts | Bins with >2000 counts | High rate bins dominated by noise | Noise dominated (total time) | Noise dominated (detector-on time) | Marked lightcurve |
|---|---|---|---|---|---|---|---|
| A | 8533 | 8129 | 36 | 36 | 0.42% | 0.44% | 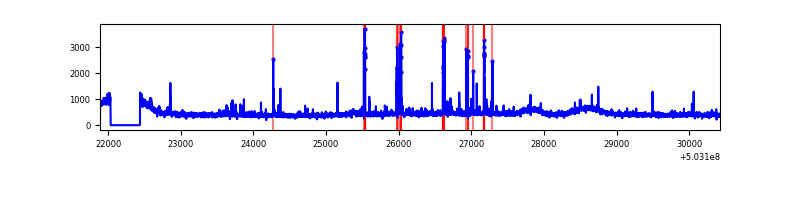 |
| B | 8533 | 8129 | 5 | 5 | 0.06% | 0.06% | 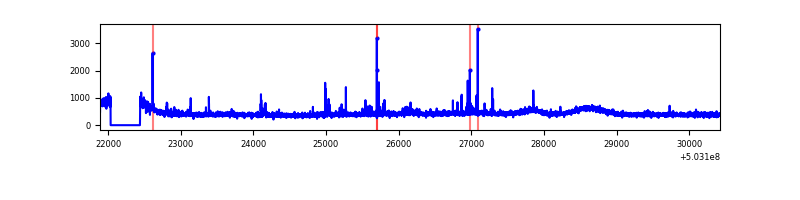 |
| C | 8533 | 8129 | 66 | 66 | 0.77% | 0.81% | 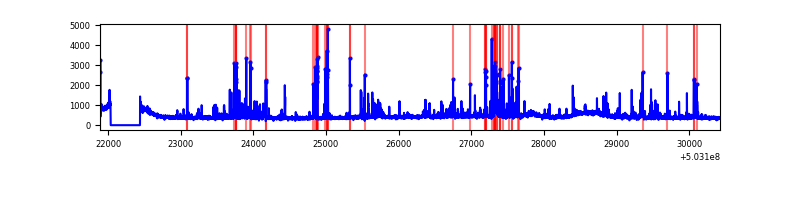 |
| D | 8533 | 8129 | 410 | 410 | 4.80% | 5.04% | 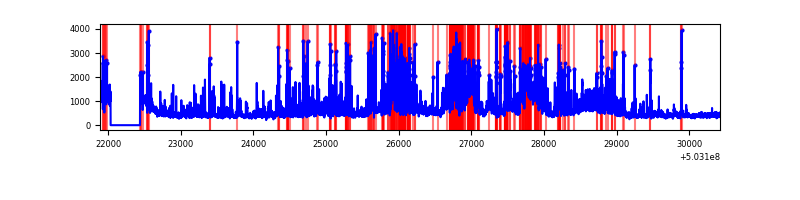 |
Top three noisy pixels from each quadrant. If the there are fewer than three noisy pixels in the level2.evt file, extra rows are filled as -1
| Pixel properties | Quadrant properties | ||||||
|---|---|---|---|---|---|---|---|
| Quadrant | DetID | PixID | Counts | Sigma | Mean | Median | Sigma |
| A | 0 | 8 | 95952 | 426.59 | 895 | 872 | 222.9 |
| A | 3 | 14 | 95204 | 423.23 | 895 | 872 | 222.9 |
| A | 4 | 249 | 76899 | 341.11 | 895 | 872 | 222.9 |
| B | 4 | 81 | 40527 | 207.37 | 876 | 845 | 191.4 |
| B | 10 | 247 | 28534 | 144.7 | 876 | 845 | 191.4 |
| B | 0 | 182 | 27534 | 139.47 | 876 | 845 | 191.4 |
| C | 13 | 3 | 322659 | 1352.93 | 860 | 852 | 237.9 |
| C | 14 | 254 | 82494 | 343.24 | 860 | 852 | 237.9 |
| C | 12 | 252 | 69801 | 289.87 | 860 | 852 | 237.9 |
| D | 11 | 129 | 2206170 | 9205.32 | 846 | 811 | 239.6 |
| D | 7 | 96 | 357703 | 1489.69 | 846 | 811 | 239.6 |
| D | 2 | 249 | 124943 | 518.14 | 846 | 811 | 239.6 |
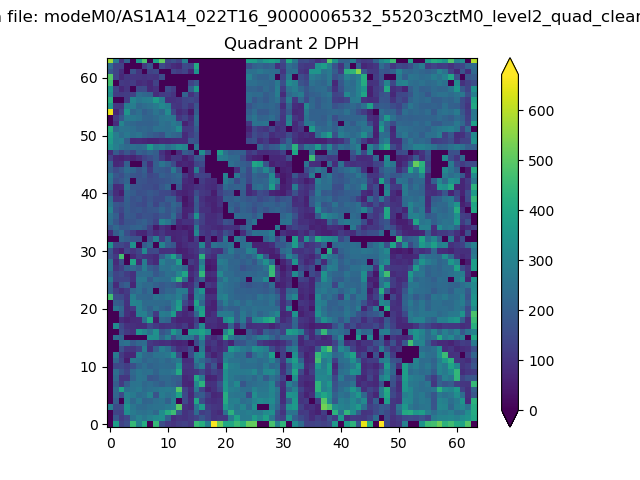
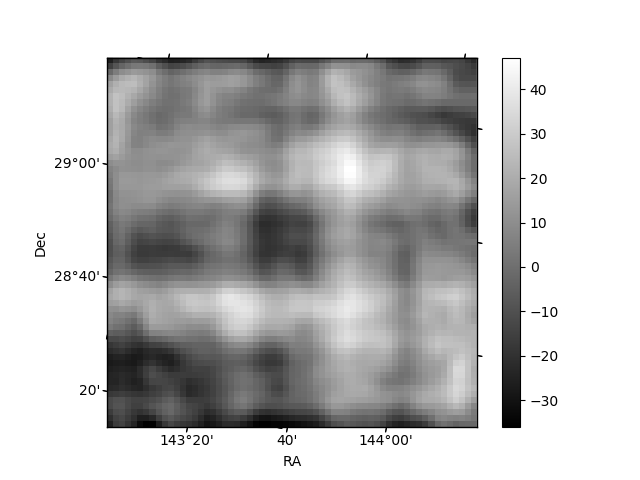
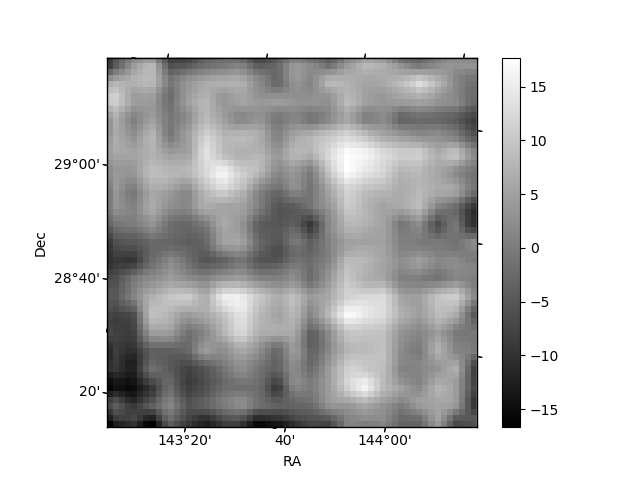
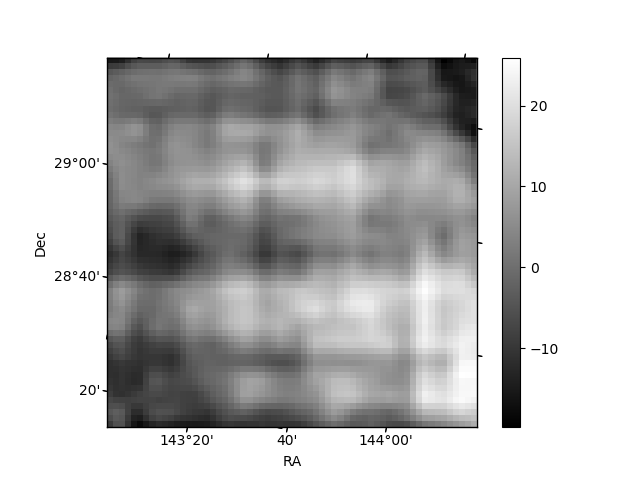
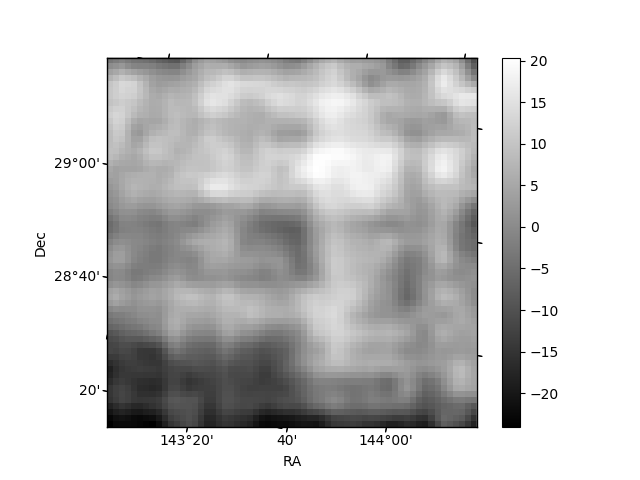
Histogram calculated using DETX and DETY for each event in the final _common_clean file
| Quadrant A | 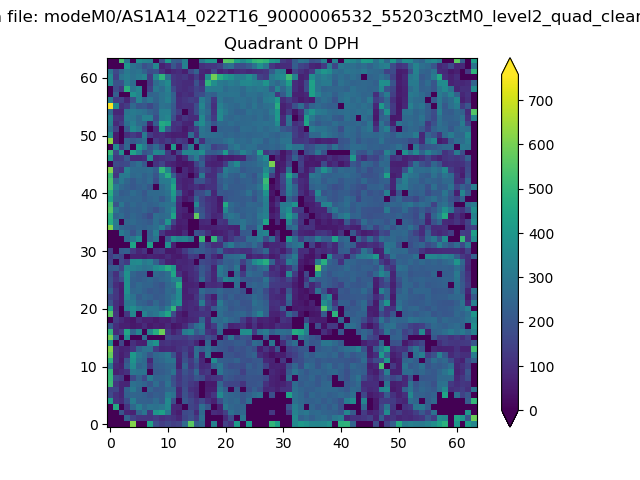 |
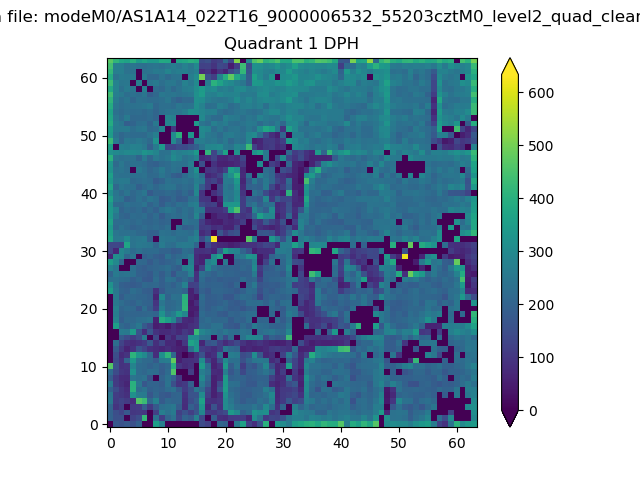 |
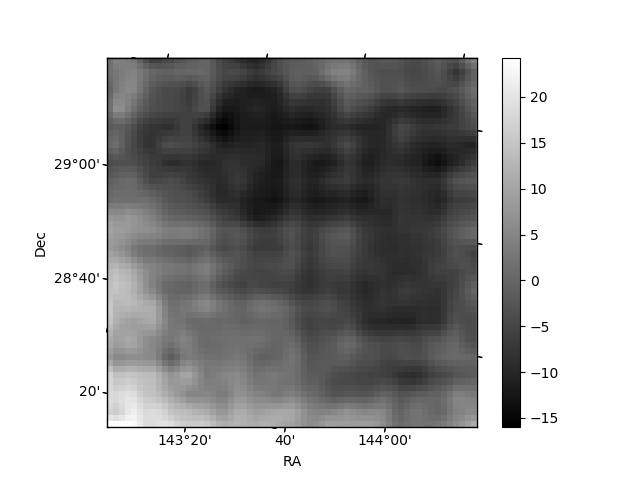
Quadrant B |
|---|---|---|---|
| Quadrant D | 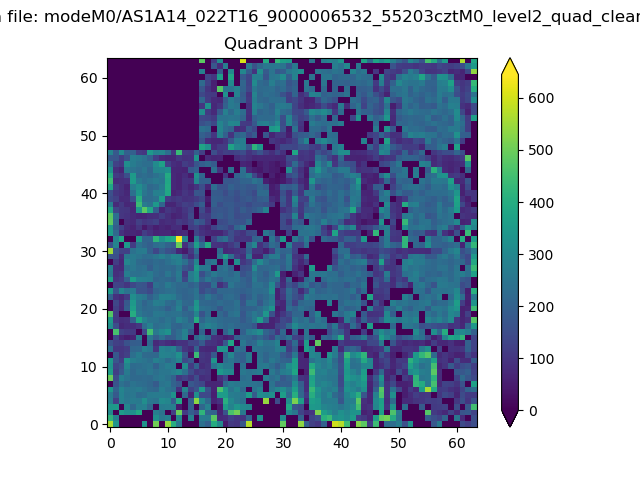 |
 |
Quadrant C |
| Plot type | Count rate plots | Images |
|---|---|---|
| Comparison with Poisson distribution Blue bars denote a histogram of data divided into 1 sec bins. Red curve is a Poisson curve with rate = median count rate of data. |
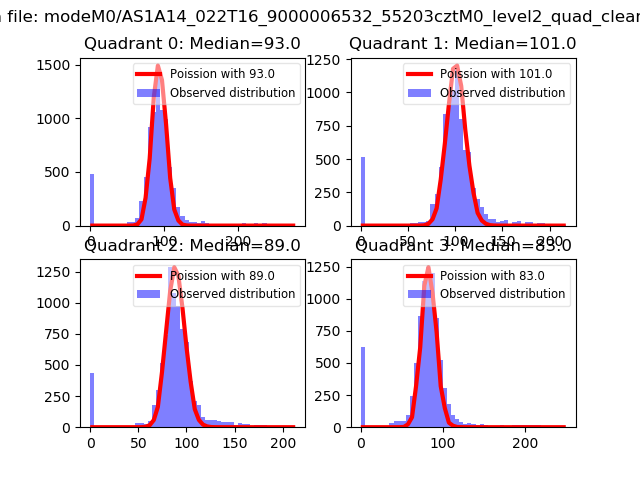 |
 |
| Quadrant-wise count rates Data is divided into 100 sec bins |
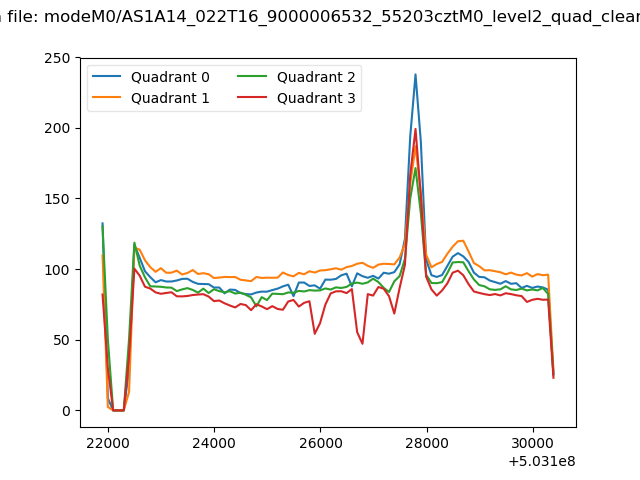 |
|
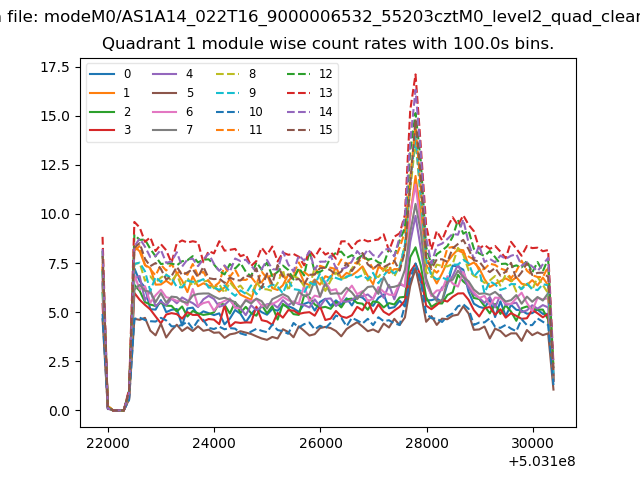
| Module-wise count rates for Quadrant A Data is divided into 100 sec bins |
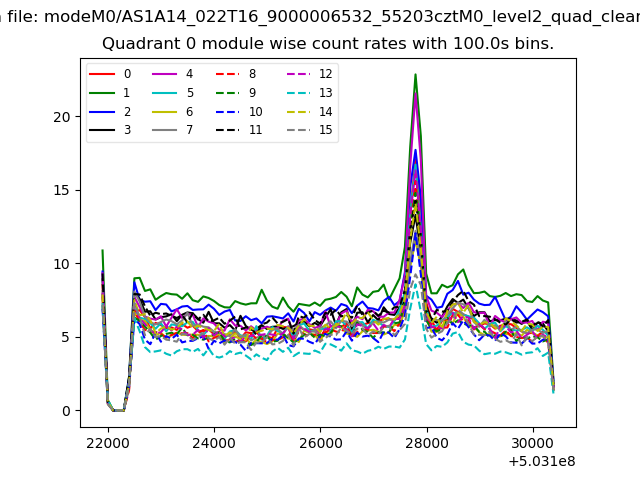 |
 |
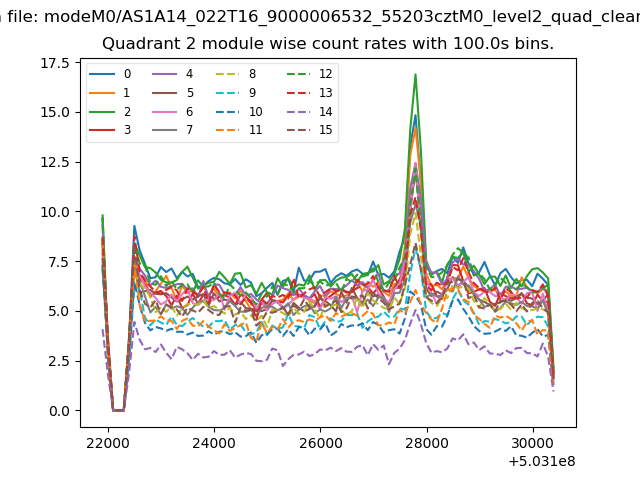
| Module-wise count rates for Quadrant B Data is divided into 100 sec bins |
 |
 |
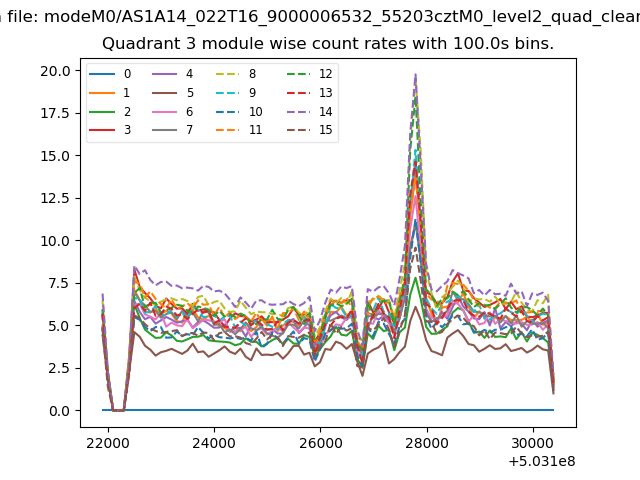
| Module-wise count rates for Quadrant C Data is divided into 100 sec bins |
 |
 |
| Module-wise count rates for Quadrant D Data is divided into 100 sec bins |
 |
 |
| Parameter | Plot |
|---|---|
| CZT HV Monitor | 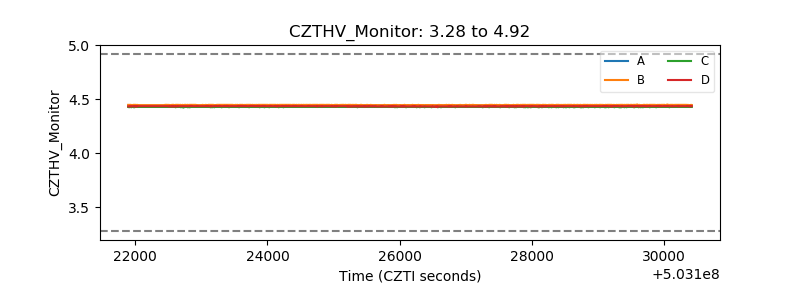 |
| D_VDD | 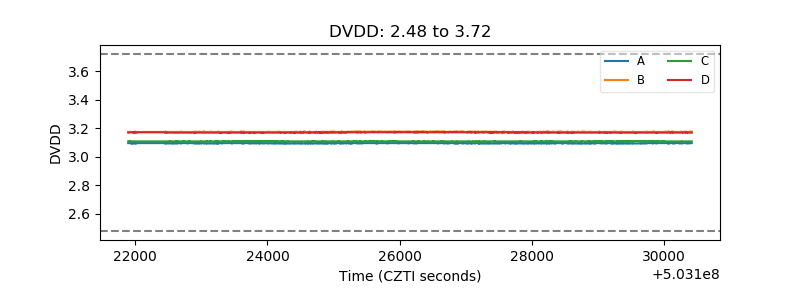 |
| Temperature 1 | 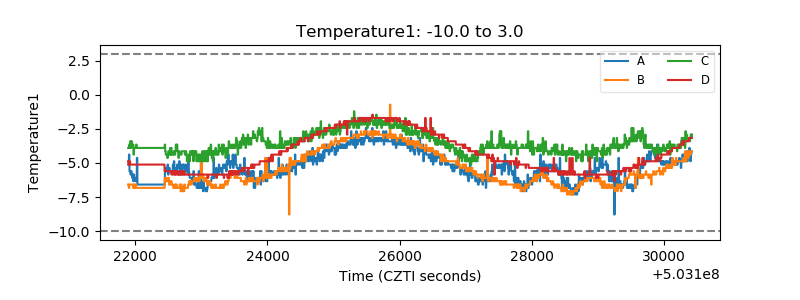 |
| Veto HV Monitor | 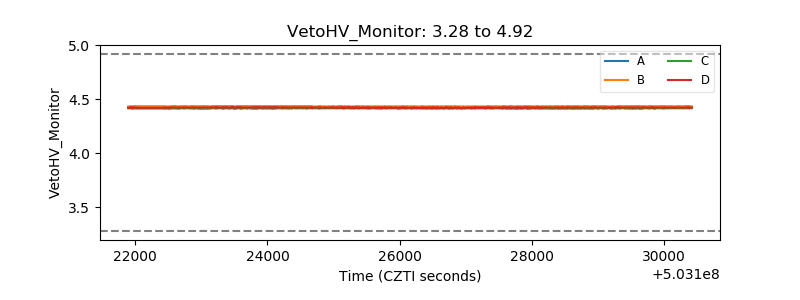 |
| Veto LLD | 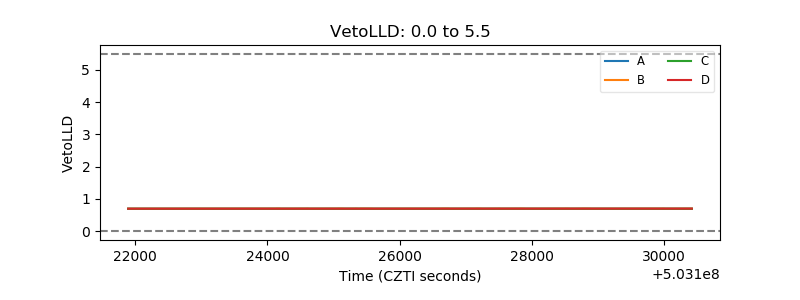 |
| Alpha Counter | 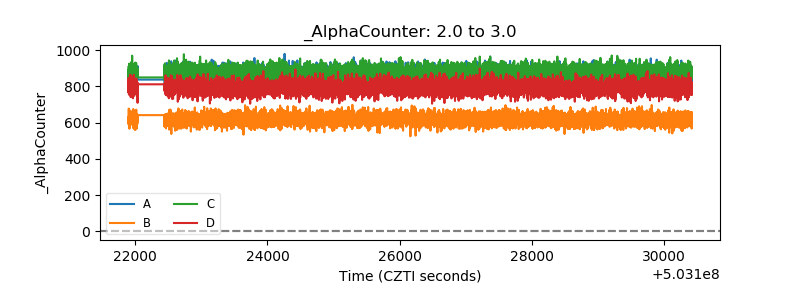 |
| _CPM_Rate | 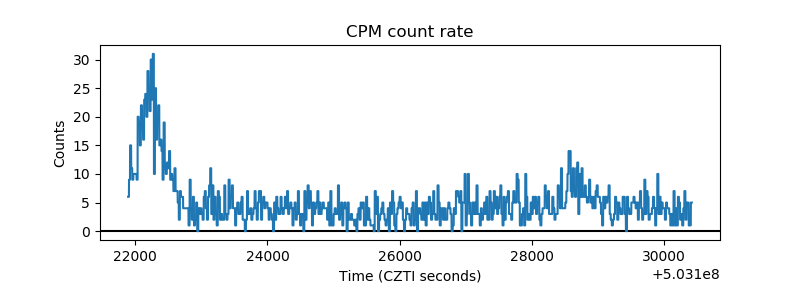 |
| CZT Counter | 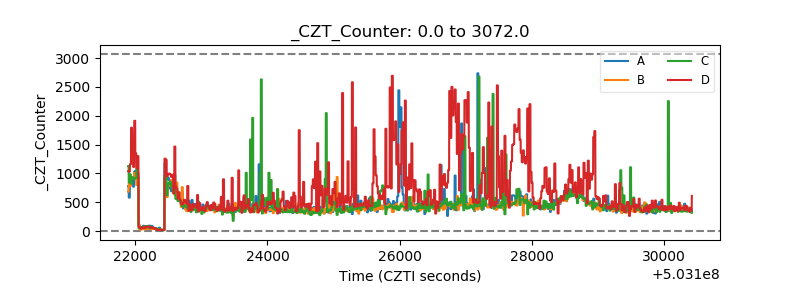 |
| +2.5 Volts monitor | 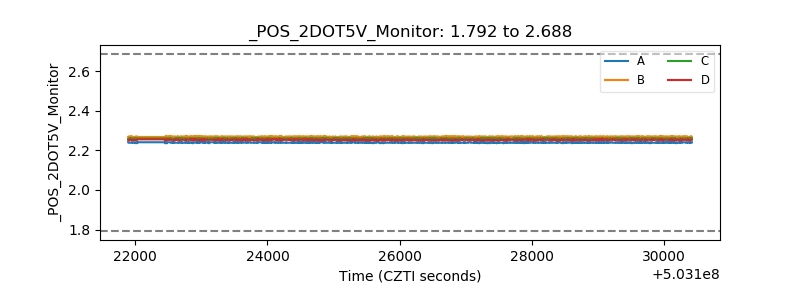 |
| +5 Volts monitor |  |
| _ROLL_ROT | 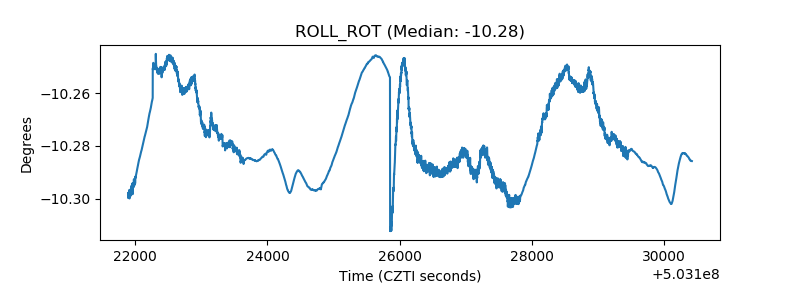 |
| _Roll_DEC | 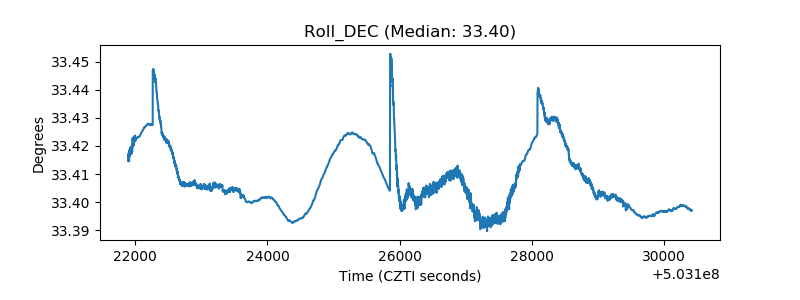 |
| _Roll_RA | 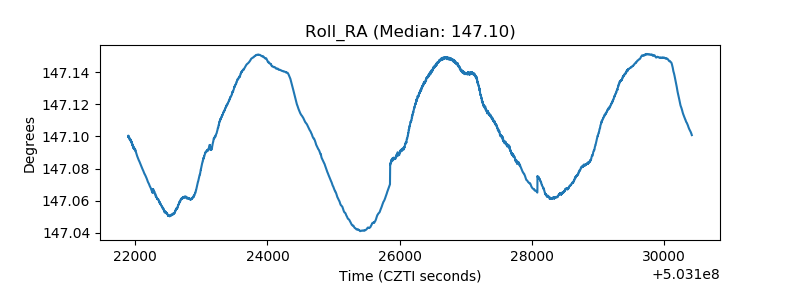 |
| Veto Counter | 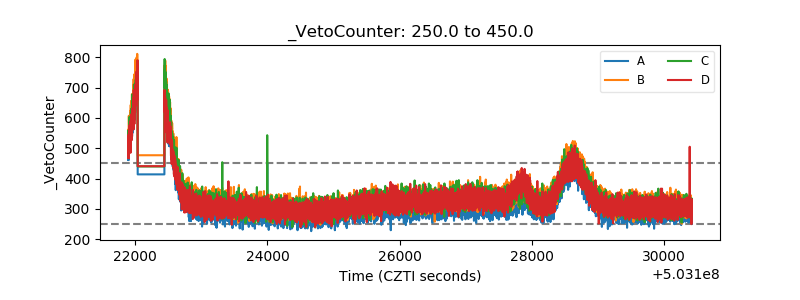 |