| Param | Original file | Final file |
|---|---|---|
| Filename | modeM0/AS1A14_022T16_9000006532_55204cztM0_level2.fits | modeM0/AS1A14_022T16_9000006532_55204cztM0_level2_quad_clean.evt |
| Size (bytes) | 479,885,760 | 109,344,960 |
| Size | 457.7 MB | 104.3 MB |
| Events in quadrant A | 3,473,904 | 720,903 |
| Events in quadrant B | 3,353,675 | 773,629 |
| Events in quadrant C | 4,291,755 | 670,575 |
| Events in quadrant D | 6,039,572 | 605,075 |
| Mode SS | |||
|---|---|---|---|
| Quadrant | BADHDUFLAG | Total packets | Discarded packets |
| A | 0 | 154 | 0 |
| B | 0 | 154 | 0 |
| C | 0 | 154 | 0 |
| D | 0 | 154 | 0 |
| Mode M0 | |||
|---|---|---|---|
| Quadrant | BADHDUFLAG | Total packets | Discarded packets |
| A | 0 | 16164 | 0 |
| B | 0 | 16029 | 0 |
| C | 0 | 18693 | 4 |
| D | 0 | 23574 | 0 |
| Quadrant | Total seconds | Saturated seconds | Saturation percentage |
|---|---|---|---|
| A | 7781 | 15 | 0.192777% |
| B | 7782 | 17 | 0.218453% |
| C | 7781 | 165 | 2.120550% |
| D | 7781 | 599 | 7.698239% |
Noise dominated data is calculated using 1-second bins in cleaned event files. If a bin has >2000 counts, and if more than 50% of those come from <1% of pixels, then it is considered to be noise-dominated and hence unusable.
| Quadrant | # 1 sec bins | Bins with >0 counts | Bins with >2000 counts | High rate bins dominated by noise | Noise dominated (total time) | Noise dominated (detector-on time) | Marked lightcurve |
|---|---|---|---|---|---|---|---|
| A | 7781 | 7781 | 9 | 9 | 0.12% | 0.12% | 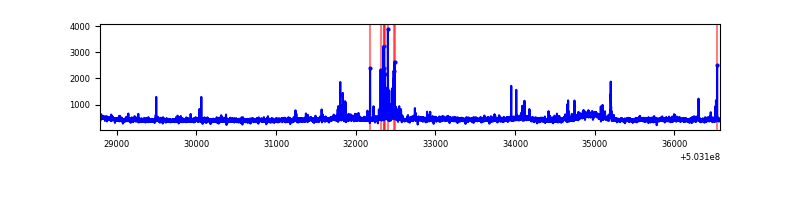 |
| B | 7782 | 7782 | 12 | 12 | 0.15% | 0.15% | 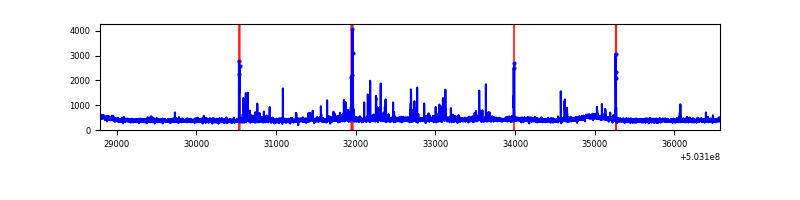 |
| C | 7781 | 7781 | 129 | 129 | 1.66% | 1.66% | 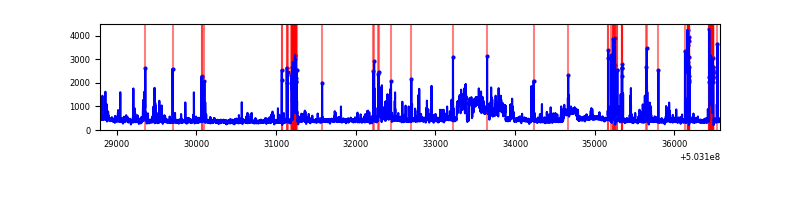 |
| D | 7781 | 7781 | 536 | 536 | 6.89% | 6.89% | 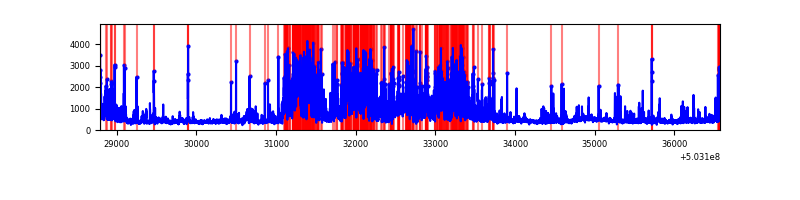 |
Top three noisy pixels from each quadrant. If the there are fewer than three noisy pixels in the level2.evt file, extra rows are filled as -1
| Pixel properties | Quadrant properties | ||||||
|---|---|---|---|---|---|---|---|
| Quadrant | DetID | PixID | Counts | Sigma | Mean | Median | Sigma |
| A | 0 | 8 | 121147 | 600.45 | 807 | 787 | 200.5 |
| A | 3 | 14 | 83906 | 414.66 | 807 | 787 | 200.5 |
| A | 4 | 249 | 43641 | 213.79 | 807 | 787 | 200.5 |
| B | 10 | 247 | 108164 | 619.1 | 794 | 763 | 173.5 |
| B | 0 | 182 | 30298 | 170.25 | 794 | 763 | 173.5 |
| B | 6 | 255 | 27123 | 151.95 | 794 | 763 | 173.5 |
| C | 1 | 16 | 524120 | 2454.51 | 769 | 760 | 213.2 |
| C | 13 | 3 | 391203 | 1831.14 | 769 | 760 | 213.2 |
| C | 15 | 193 | 145713 | 679.82 | 769 | 760 | 213.2 |
| D | 2 | 249 | 1896019 | 8916.14 | 748 | 717 | 212.6 |
| D | 11 | 129 | 678428 | 3188.18 | 748 | 717 | 212.6 |
| D | 5 | 38 | 174748 | 818.7 | 748 | 717 | 212.6 |
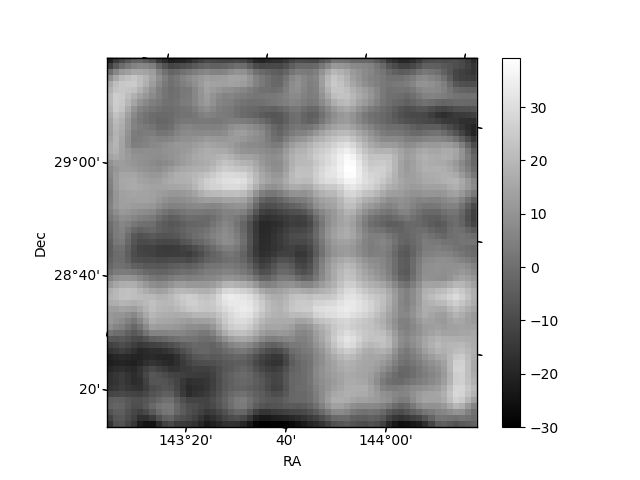
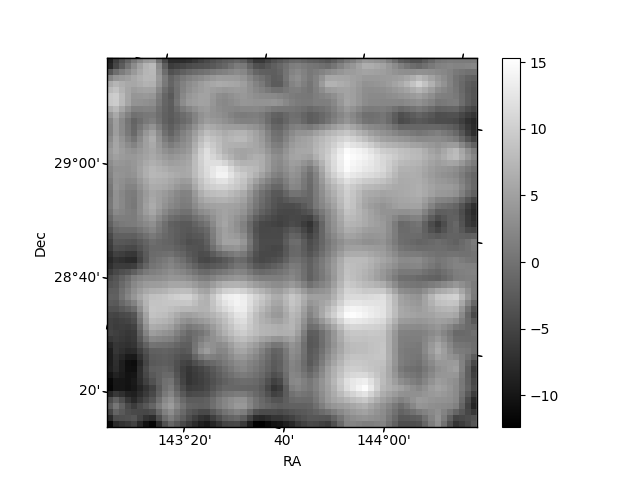
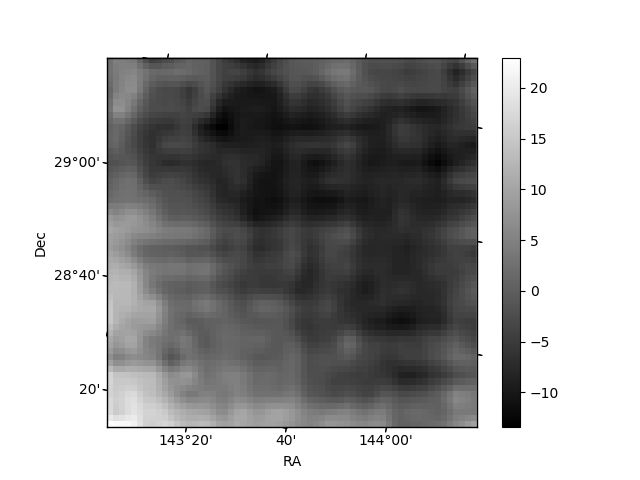
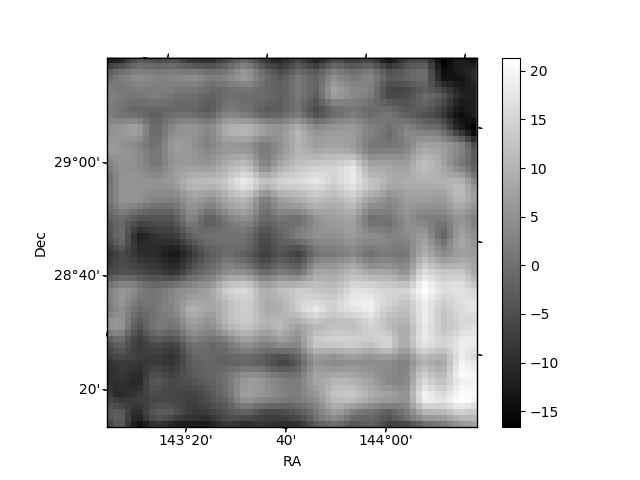
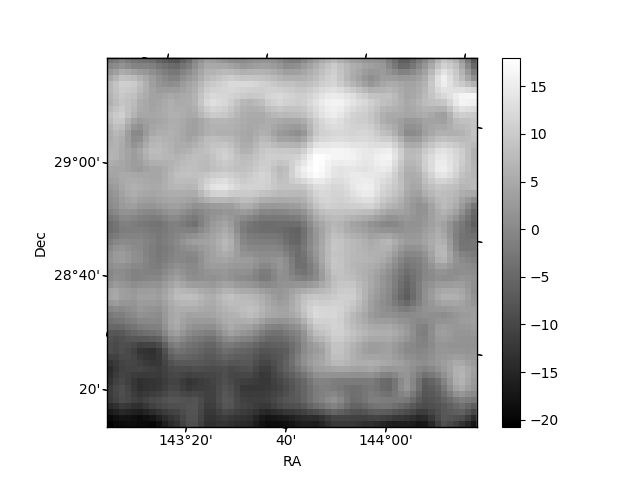
Histogram calculated using DETX and DETY for each event in the final _common_clean file
| Quadrant A | 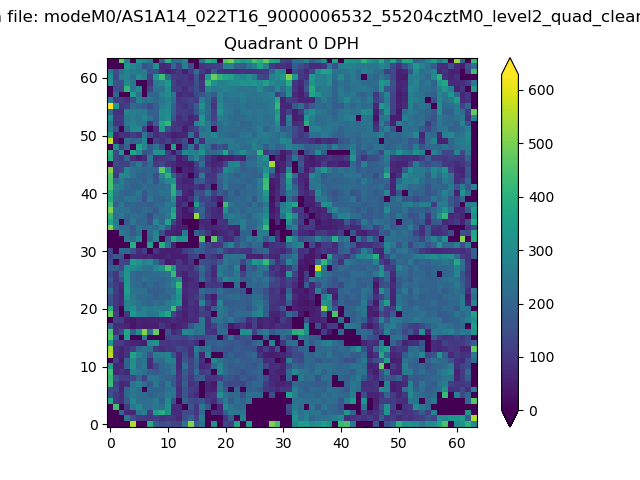 |
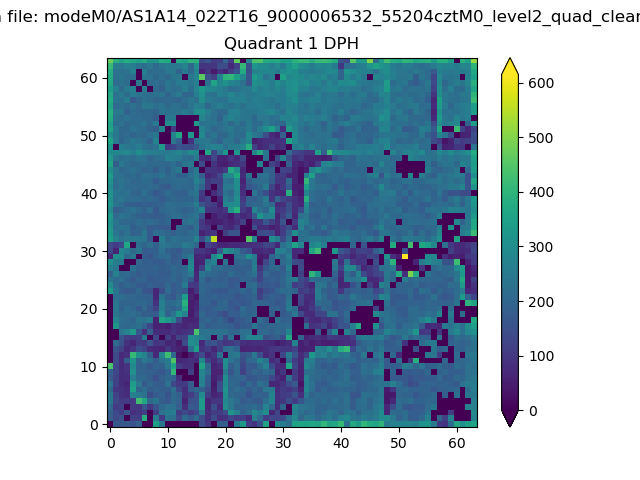 |
Quadrant B |
|---|---|---|---|
| Quadrant D | 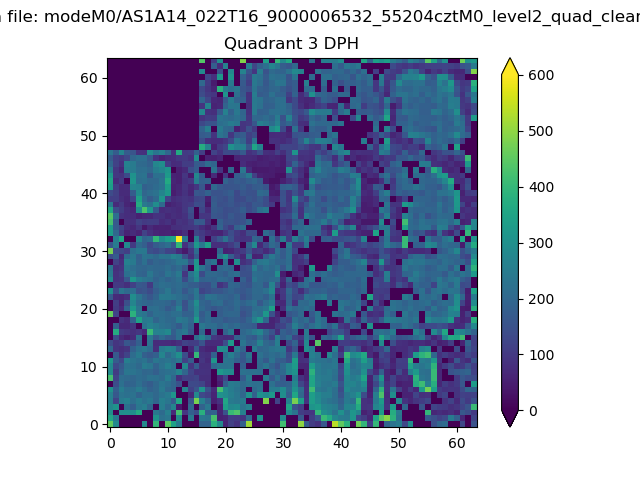 |
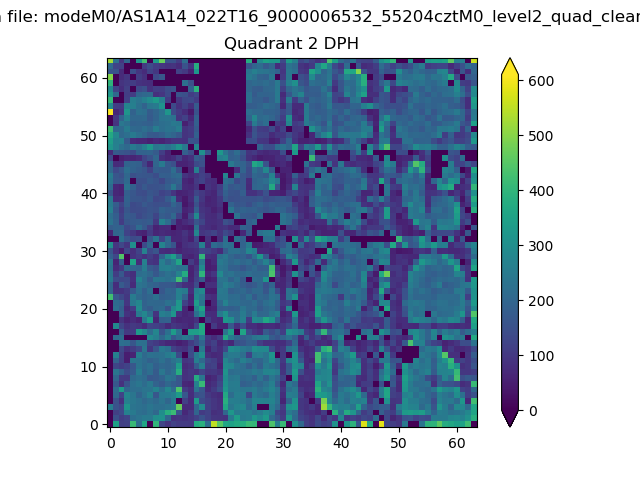 |
Quadrant C |
| Plot type | Count rate plots | Images |
|---|---|---|
| Comparison with Poisson distribution Blue bars denote a histogram of data divided into 1 sec bins. Red curve is a Poisson curve with rate = median count rate of data. |
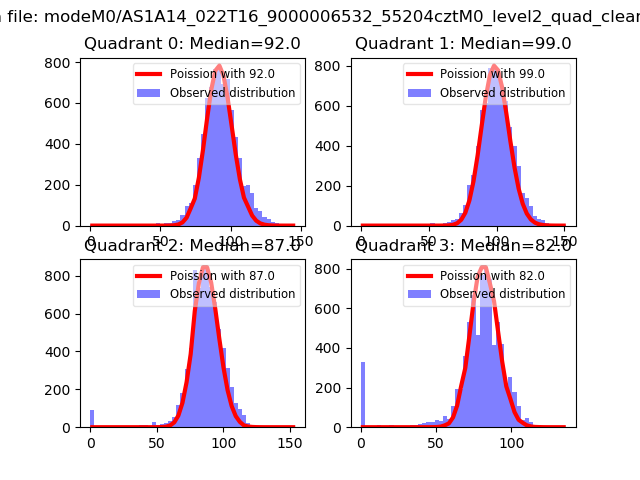 |
 |
| Quadrant-wise count rates Data is divided into 100 sec bins |
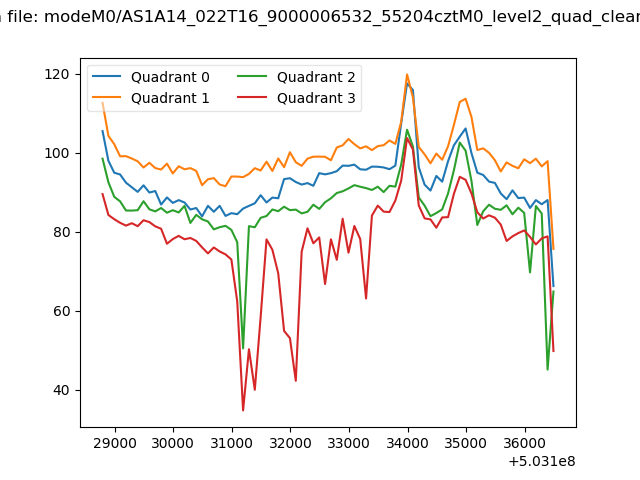 |
|
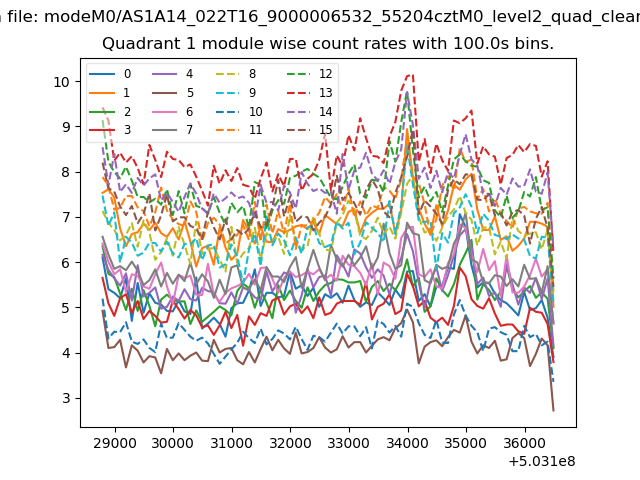
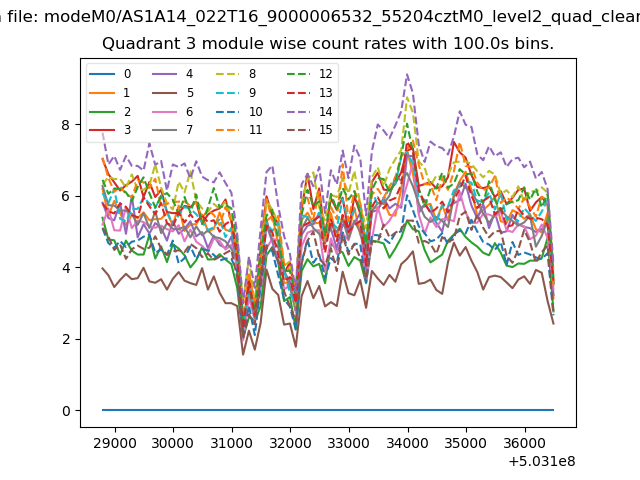
| Module-wise count rates for Quadrant A Data is divided into 100 sec bins |
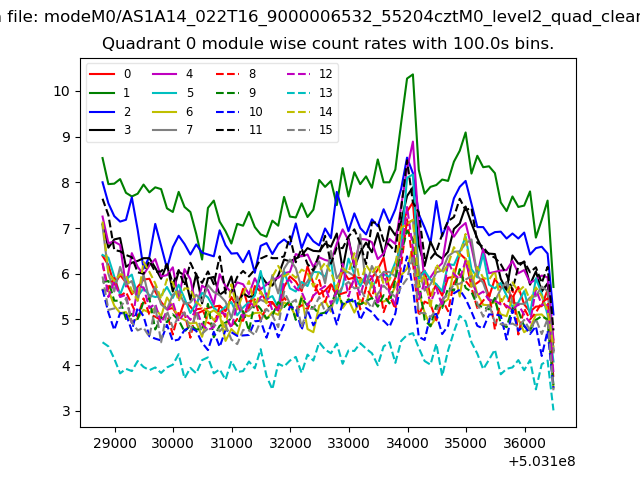 |
 |
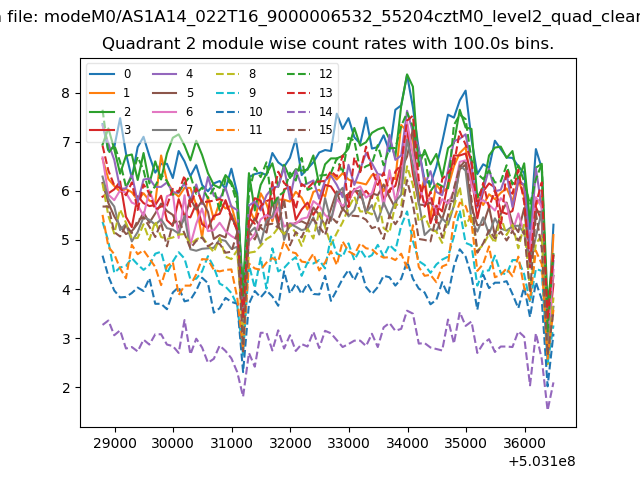
| Module-wise count rates for Quadrant B Data is divided into 100 sec bins |
 |
 |
| Module-wise count rates for Quadrant C Data is divided into 100 sec bins |
 |
 |
| Module-wise count rates for Quadrant D Data is divided into 100 sec bins |
 |
 |
| Parameter | Plot |
|---|---|
| CZT HV Monitor | 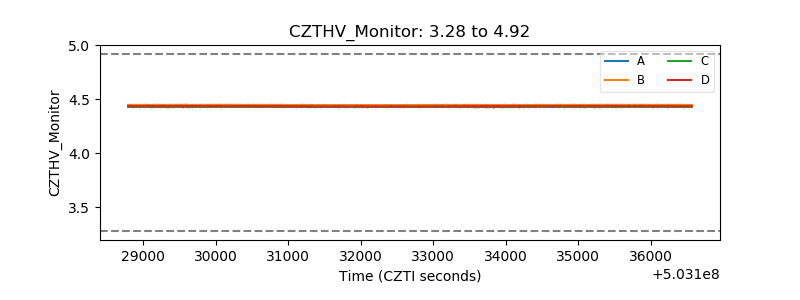 |
| D_VDD | 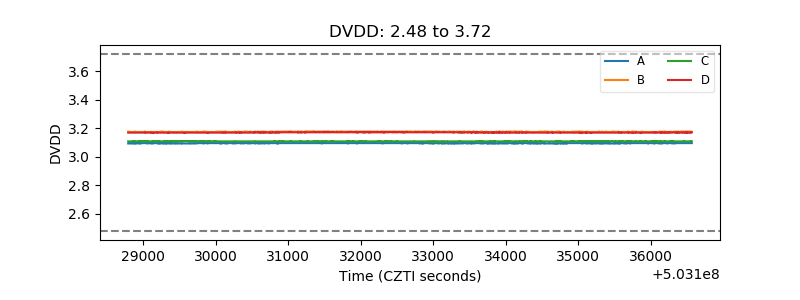 |
| Temperature 1 | 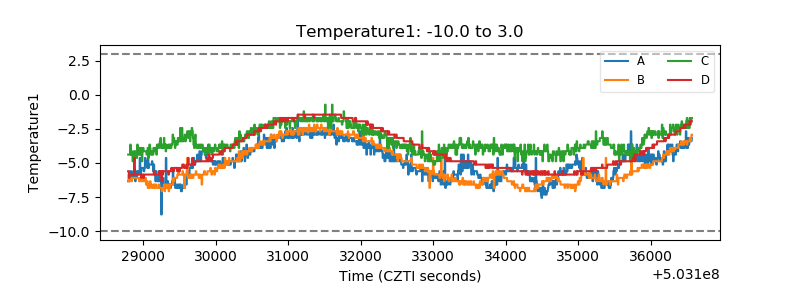 |
| Veto HV Monitor | 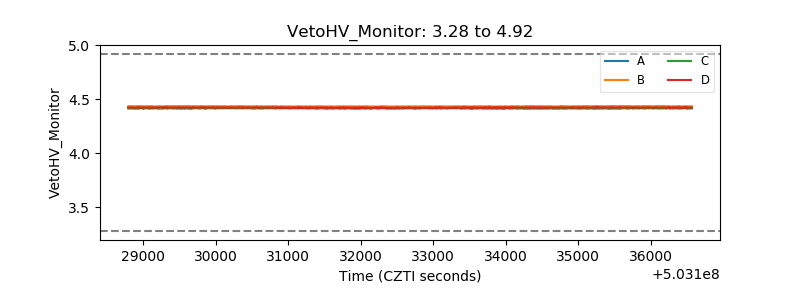 |
| Veto LLD | 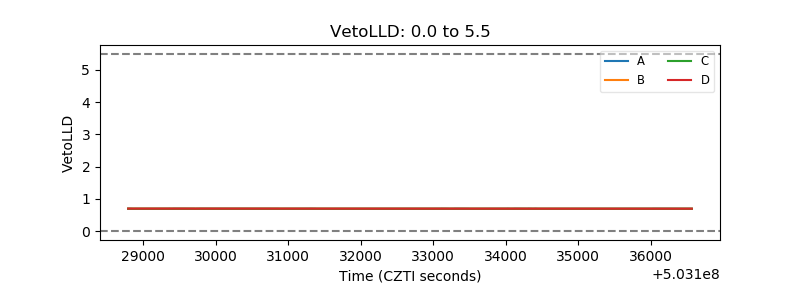 |
| Alpha Counter | 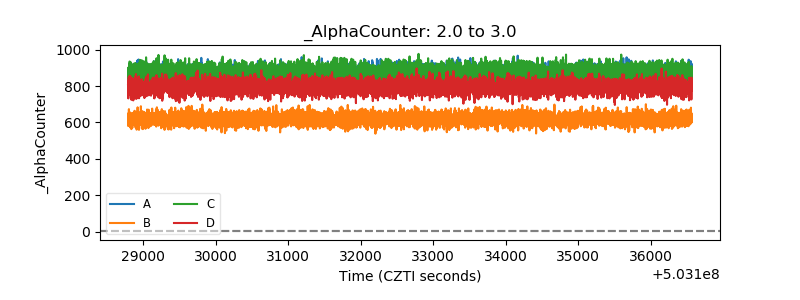 |
| _CPM_Rate | 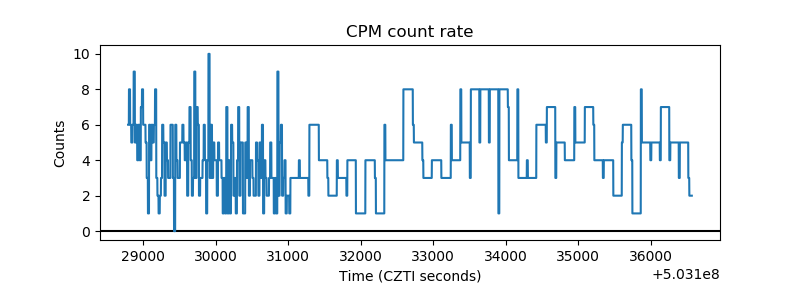 |
| CZT Counter | 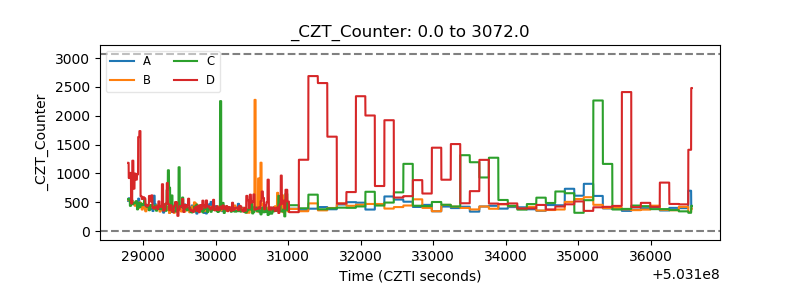 |
| +2.5 Volts monitor |  |
| +5 Volts monitor | 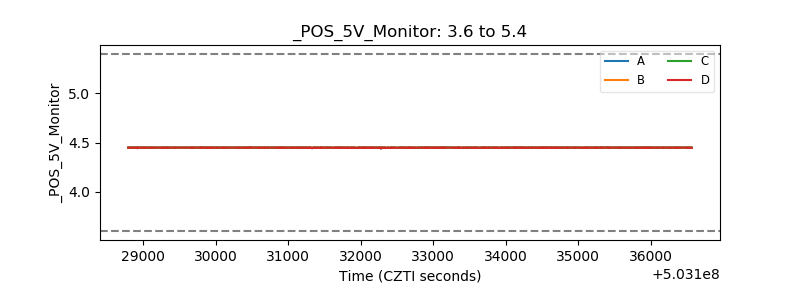 |
| _ROLL_ROT | 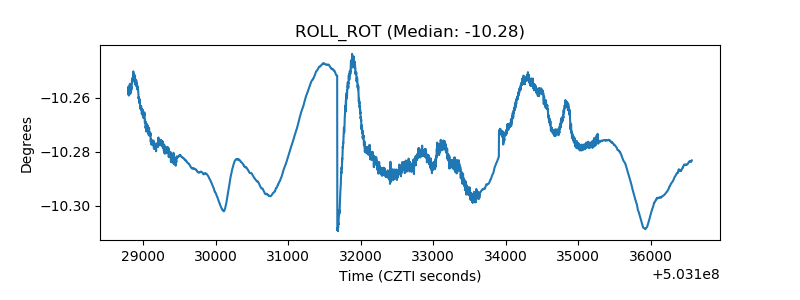 |
| _Roll_DEC | 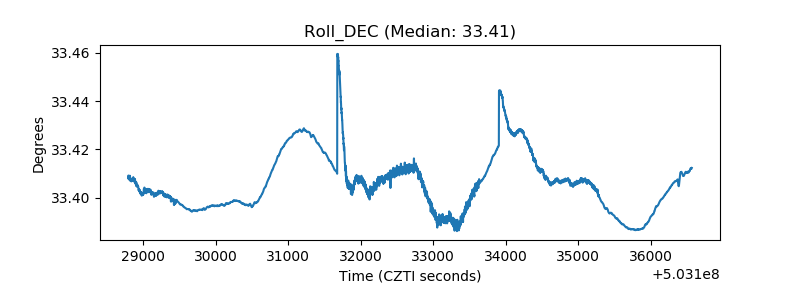 |
| _Roll_RA | 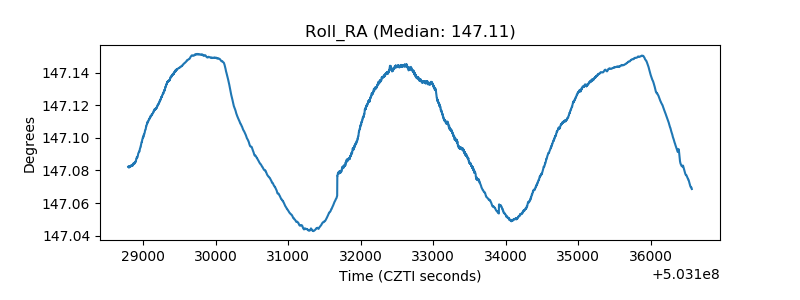 |
| Veto Counter | 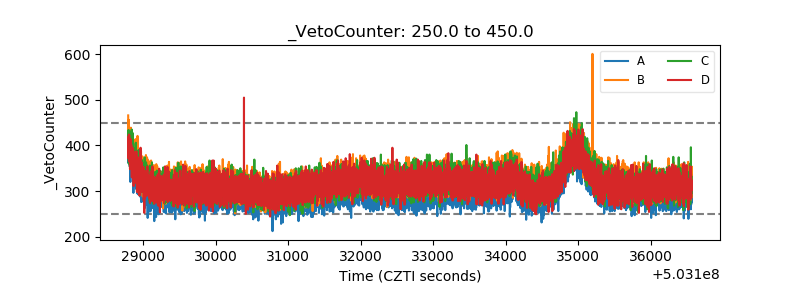 |