| Param | Original file | Final file |
|---|---|---|
| Filename | modeM0/AS1A14_022T16_9000006532_55208cztM0_level2.fits | modeM0/AS1A14_022T16_9000006532_55208cztM0_level2_quad_clean.evt |
| Size (bytes) | 1,902,827,520 | 339,289,920 |
| Size | 1.8 GB | 323.6 MB |
| Events in quadrant A | 12,275,211 | 2,288,505 |
| Events in quadrant B | 11,186,024 | 2,460,231 |
| Events in quadrant C | 18,766,086 | 2,043,830 |
| Events in quadrant D | 26,269,804 | 1,754,069 |
| Mode SS | |||
|---|---|---|---|
| Quadrant | BADHDUFLAG | Total packets | Discarded packets |
| A | 0 | 510 | 0 |
| B | 0 | 510 | 0 |
| C | 0 | 510 | 0 |
| D | 0 | 510 | 0 |
| Mode M0 | |||
|---|---|---|---|
| Quadrant | BADHDUFLAG | Total packets | Discarded packets |
| A | 0 | 54882 | 4 |
| B | 0 | 52671 | 4 |
| C | 0 | 74065 | 5 |
| D | 0 | 95634 | 4 |
| Mode M9 | |||
|---|---|---|---|
| Quadrant | BADHDUFLAG | Total packets | Discarded packets |
| A | 0 | 11 | 0 |
| B | 0 | 11 | 0 |
| C | 0 | 11 | 0 |
| D | 0 | 11 | 0 |
| Quadrant | Total seconds | Saturated seconds | Saturation percentage |
|---|---|---|---|
| A | 25067 | 625 | 2.493318% |
| B | 25067 | 522 | 2.082419% |
| C | 25067 | 2292 | 9.143495% |
| D | 25067 | 4838 | 19.300275% |
Noise dominated data is calculated using 1-second bins in cleaned event files. If a bin has >2000 counts, and if more than 50% of those come from <1% of pixels, then it is considered to be noise-dominated and hence unusable.
| Quadrant | # 1 sec bins | Bins with >0 counts | Bins with >2000 counts | High rate bins dominated by noise | Noise dominated (total time) | Noise dominated (detector-on time) | Marked lightcurve |
|---|---|---|---|---|---|---|---|
| A | 26347 | 25070 | 200 | 200 | 0.76% | 0.80% | 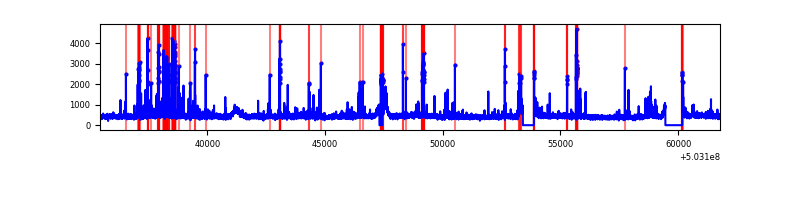 |
| B | 26347 | 25070 | 76 | 76 | 0.29% | 0.30% | 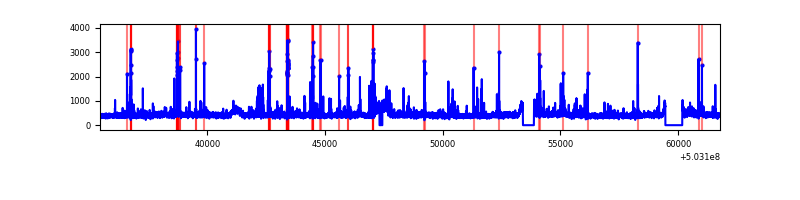 |
| C | 26347 | 25070 | 1649 | 1649 | 6.26% | 6.58% | 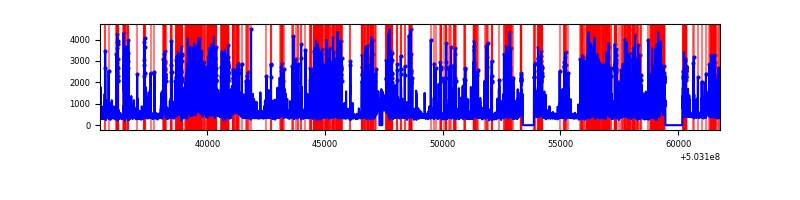 |
| D | 26347 | 25070 | 4084 | 4084 | 15.50% | 16.29% | 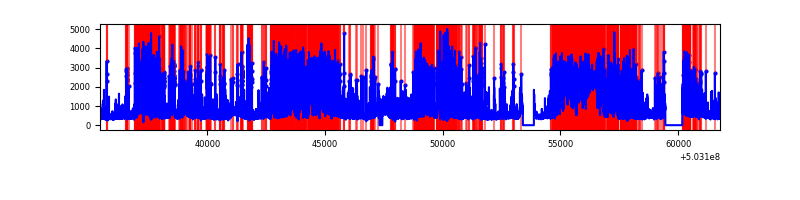 |
Top three noisy pixels from each quadrant. If the there are fewer than three noisy pixels in the level2.evt file, extra rows are filled as -1
| Pixel properties | Quadrant properties | ||||||
|---|---|---|---|---|---|---|---|
| Quadrant | DetID | PixID | Counts | Sigma | Mean | Median | Sigma |
| A | 0 | 8 | 590938 | 894.16 | 2664 | 2595 | 658.0 |
| A | 3 | 45 | 345242 | 520.75 | 2664 | 2595 | 658.0 |
| A | 3 | 14 | 226677 | 340.56 | 2664 | 2595 | 658.0 |
| B | 2 | 249 | 232217 | 405.77 | 2633 | 2528 | 566.1 |
| B | 10 | 247 | 158550 | 275.63 | 2633 | 2528 | 566.1 |
| B | 0 | 182 | 124058 | 214.7 | 2633 | 2528 | 566.1 |
| C | 12 | 254 | 5290451 | 7775.8 | 2512 | 2493 | 680.1 |
| C | 14 | 254 | 1400368 | 2055.54 | 2512 | 2493 | 680.1 |
| C | 13 | 3 | 722777 | 1059.16 | 2512 | 2493 | 680.1 |
| D | 2 | 249 | 8573609 | 12893.46 | 2390 | 2285 | 664.8 |
| D | 11 | 129 | 4911953 | 7385.4 | 2390 | 2285 | 664.8 |
| D | 15 | 42 | 1507136 | 2263.68 | 2390 | 2285 | 664.8 |
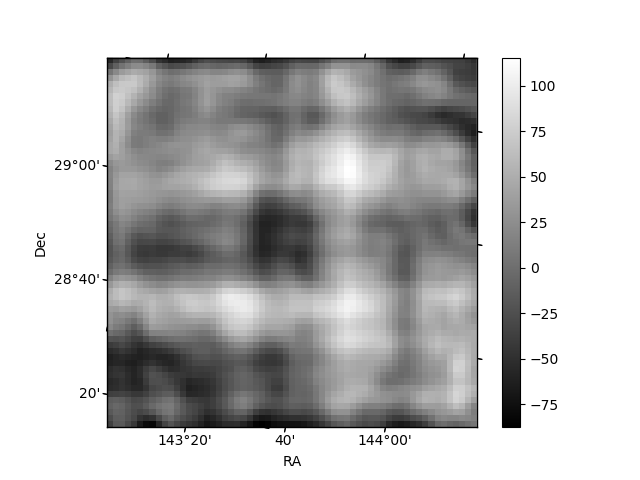
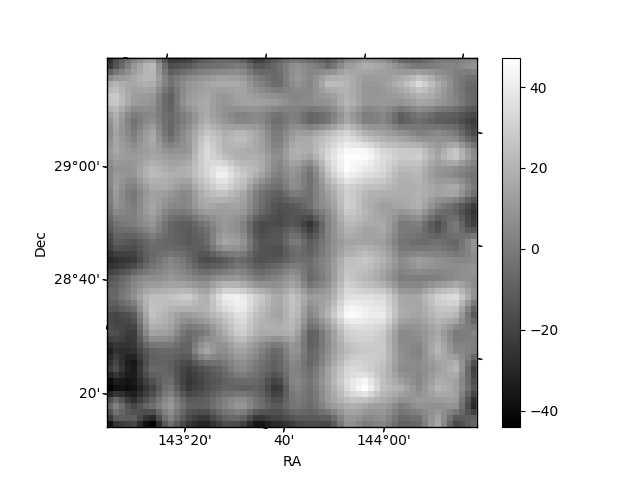
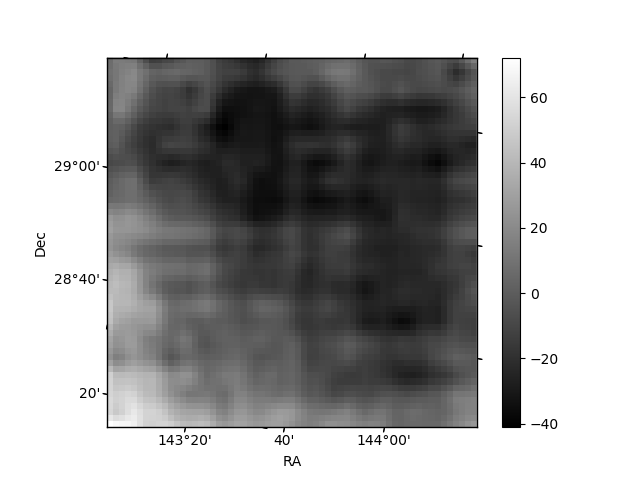
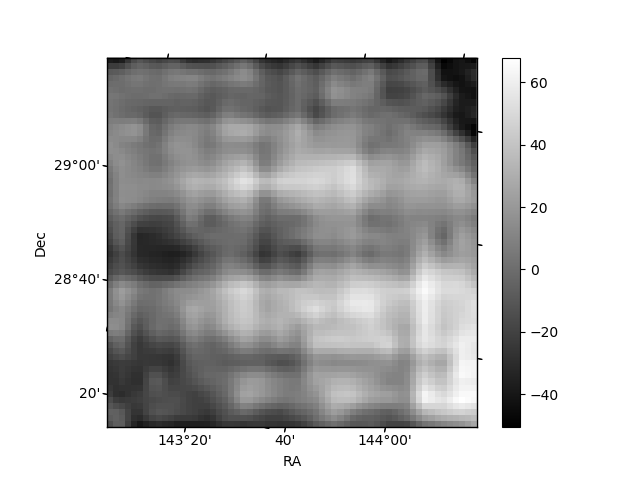
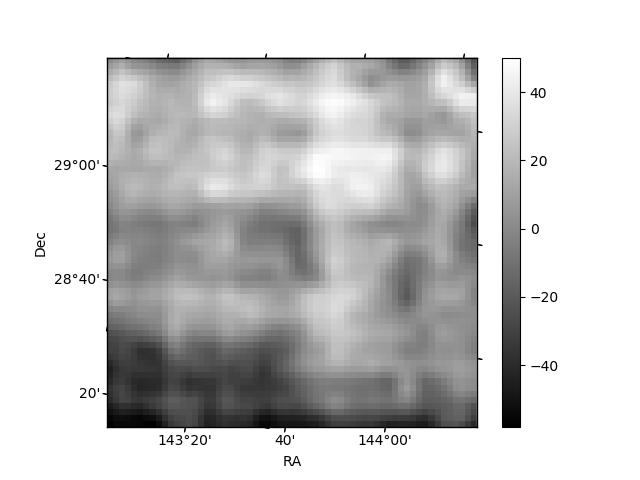
Histogram calculated using DETX and DETY for each event in the final _common_clean file
| Quadrant A | 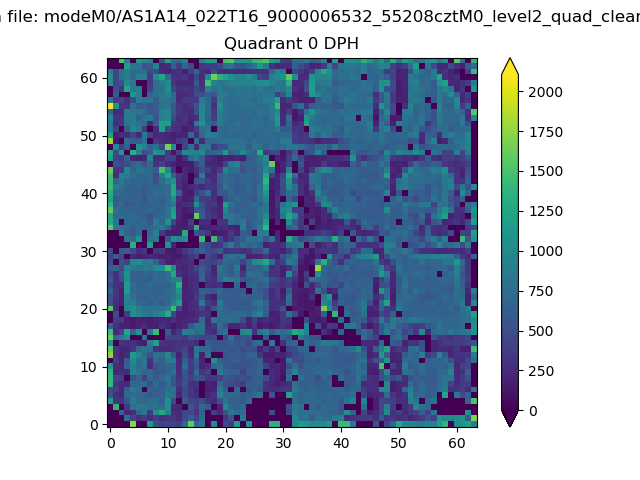 |
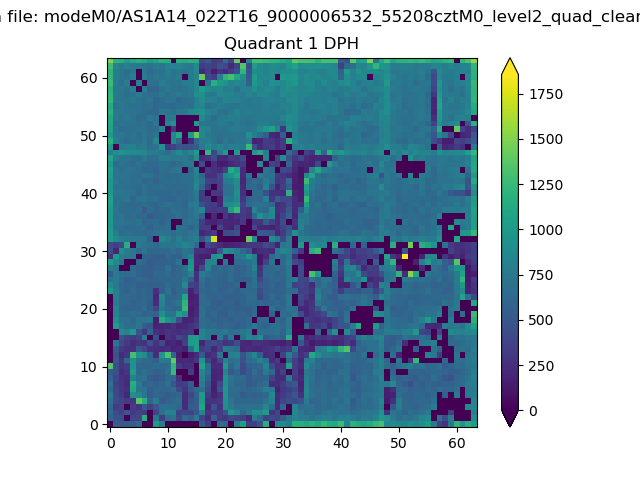 |
Quadrant B |
|---|---|---|---|
| Quadrant D | 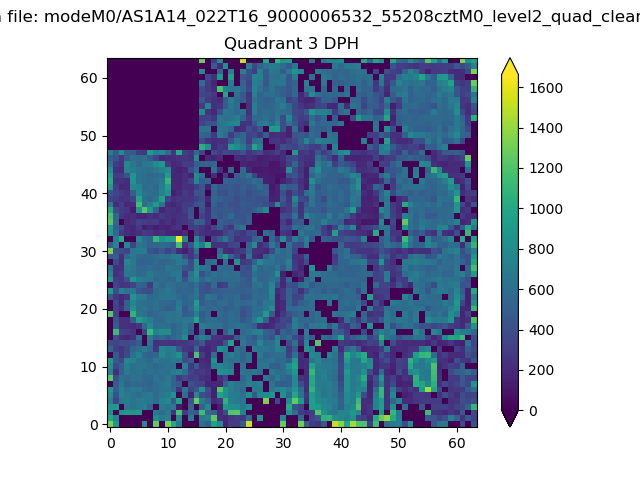 |
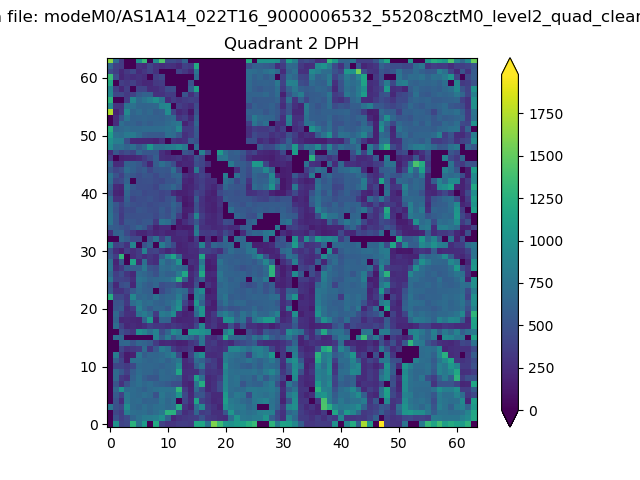 |
Quadrant C |
| Plot type | Count rate plots | Images |
|---|---|---|
| Comparison with Poisson distribution Blue bars denote a histogram of data divided into 1 sec bins. Red curve is a Poisson curve with rate = median count rate of data. |
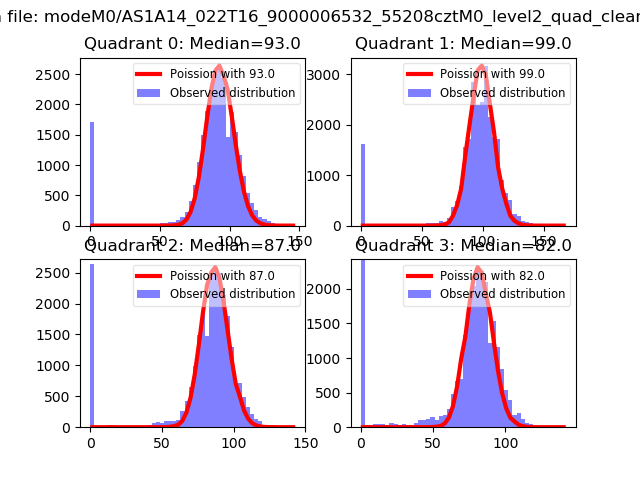 |
 |
| Quadrant-wise count rates Data is divided into 100 sec bins |
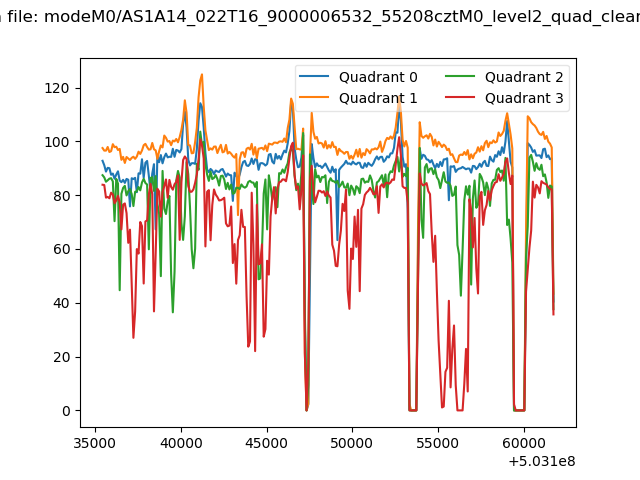 |
|
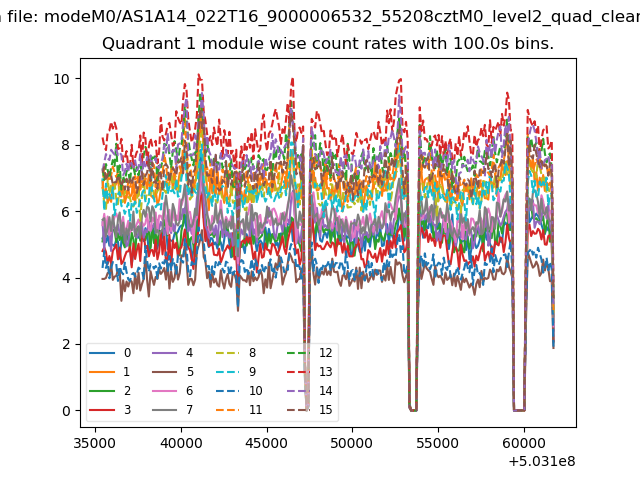
| Module-wise count rates for Quadrant A Data is divided into 100 sec bins |
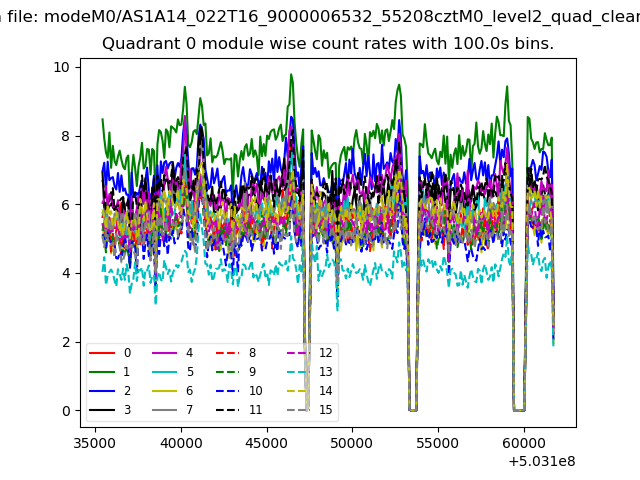 |
 |
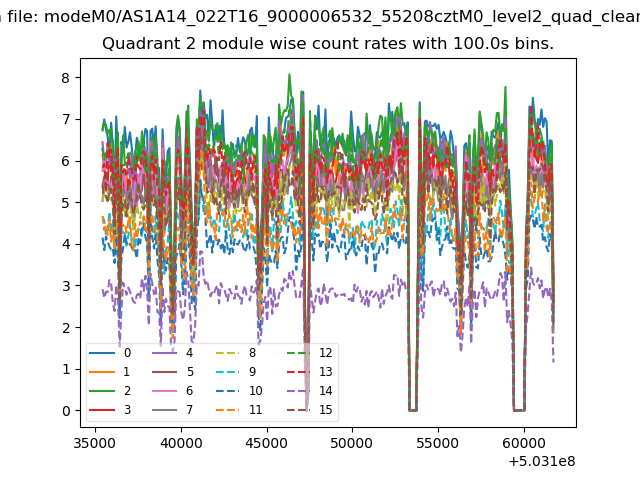
| Module-wise count rates for Quadrant B Data is divided into 100 sec bins |
 |
 |
| Module-wise count rates for Quadrant C Data is divided into 100 sec bins |
 |
 |
| Module-wise count rates for Quadrant D Data is divided into 100 sec bins |
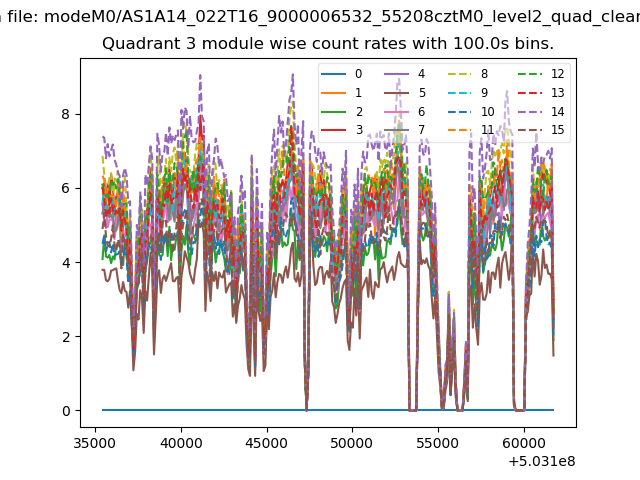 |
 |
| Parameter | Plot |
|---|---|
| CZT HV Monitor | 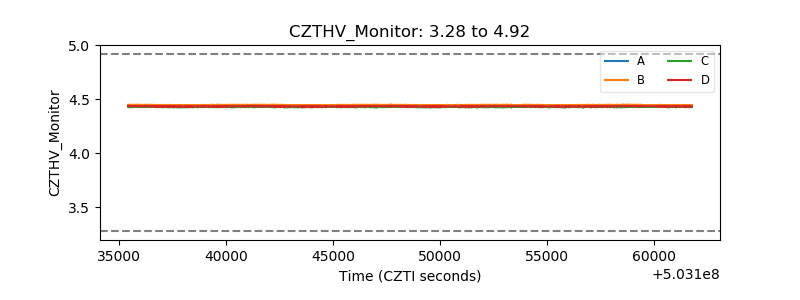 |
| D_VDD | 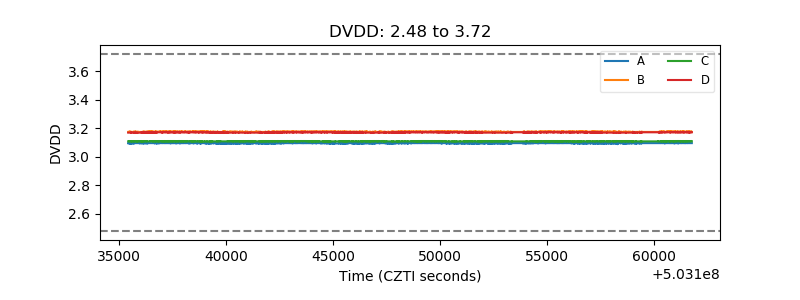 |
| Temperature 1 | 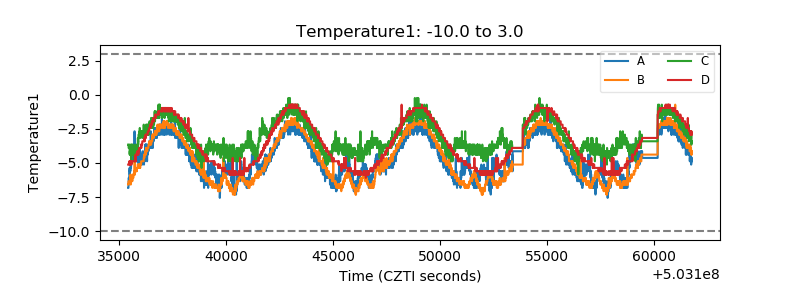 |
| Veto HV Monitor | 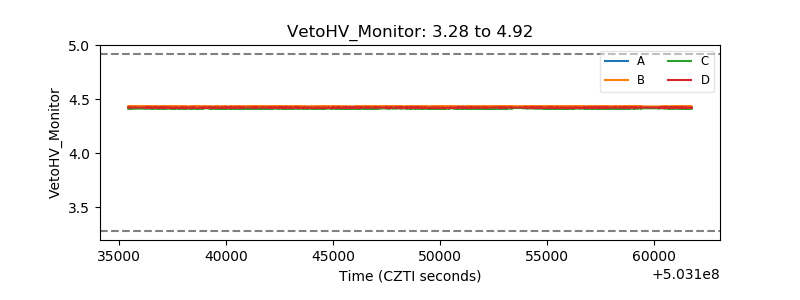 |
| Veto LLD | 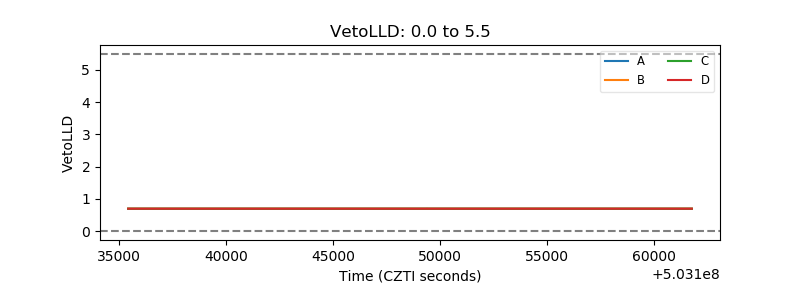 |
| Alpha Counter | 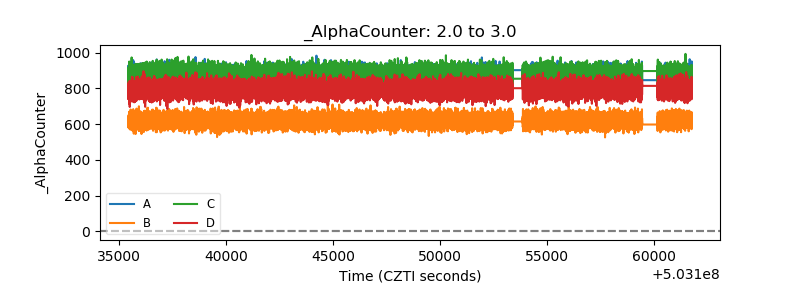 |
| _CPM_Rate | 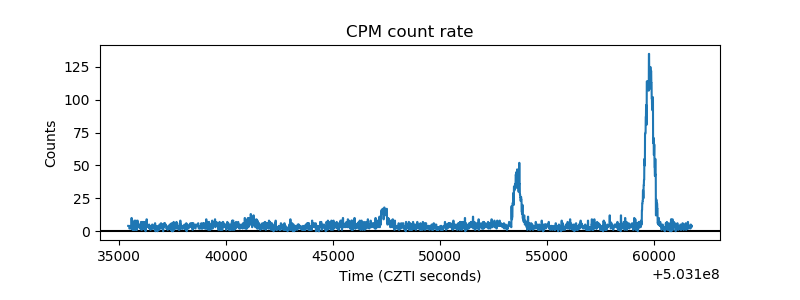 |
| CZT Counter | 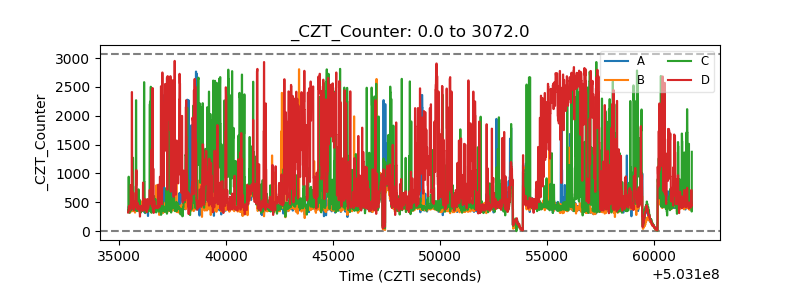 |
| +2.5 Volts monitor | 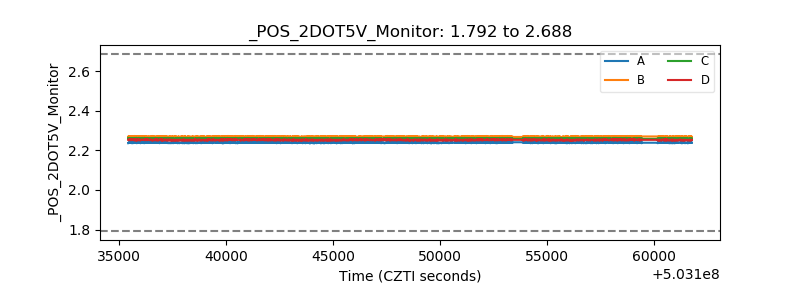 |
| +5 Volts monitor |  |
| _ROLL_ROT | 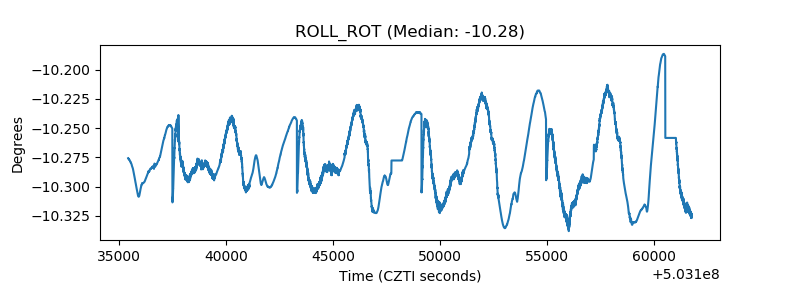 |
| _Roll_DEC | 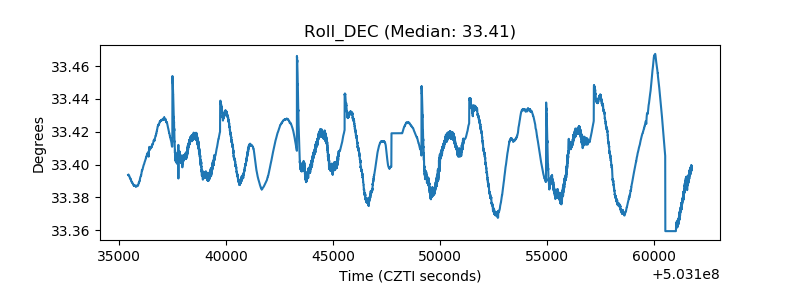 |
| _Roll_RA | 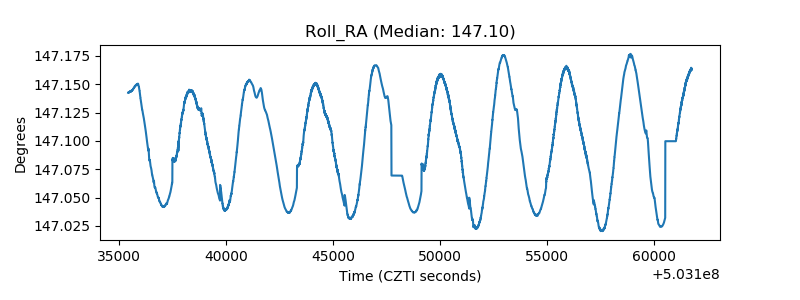 |
| Veto Counter | 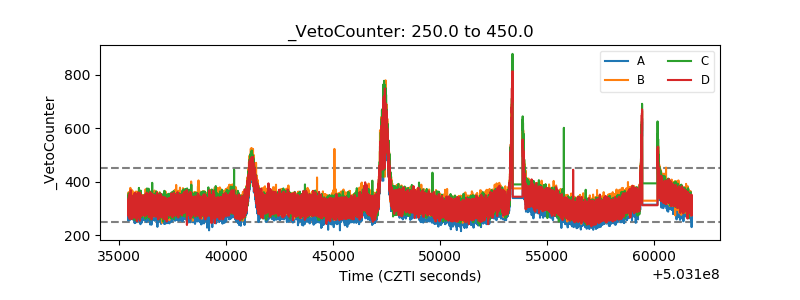 |