| Param | Original file | Final file |
|---|---|---|
| Filename | modeM0/AS1A14_022T16_9000006532_55209cztM0_level2.fits | modeM0/AS1A14_022T16_9000006532_55209cztM0_level2_quad_clean.evt |
| Size (bytes) | 501,451,200 | 94,665,600 |
| Size | 478.2 MB | 90.3 MB |
| Events in quadrant A | 3,065,610 | 644,785 |
| Events in quadrant B | 3,070,937 | 681,054 |
| Events in quadrant C | 6,346,625 | 537,736 |
| Events in quadrant D | 5,558,522 | 536,329 |
| Mode SS | |||
|---|---|---|---|
| Quadrant | BADHDUFLAG | Total packets | Discarded packets |
| A | 0 | 134 | 0 |
| B | 0 | 134 | 0 |
| C | 0 | 134 | 0 |
| D | 0 | 134 | 0 |
| Mode M0 | |||
|---|---|---|---|
| Quadrant | BADHDUFLAG | Total packets | Discarded packets |
| A | 0 | 13959 | 1 |
| B | 0 | 14139 | 1 |
| C | 0 | 23503 | 1 |
| D | 0 | 21254 | 1 |
| Mode M9 | |||
|---|---|---|---|
| Quadrant | BADHDUFLAG | Total packets | Discarded packets |
| A | 0 | 9 | 0 |
| B | 0 | 9 | 0 |
| C | 0 | 9 | 0 |
| D | 0 | 9 | 0 |
| Quadrant | Total seconds | Saturated seconds | Saturation percentage |
|---|---|---|---|
| A | 6695 | 43 | 0.642270% |
| B | 6696 | 72 | 1.075269% |
| C | 6696 | 941 | 14.053166% |
| D | 6696 | 600 | 8.960573% |
Noise dominated data is calculated using 1-second bins in cleaned event files. If a bin has >2000 counts, and if more than 50% of those come from <1% of pixels, then it is considered to be noise-dominated and hence unusable.
| Quadrant | # 1 sec bins | Bins with >0 counts | Bins with >2000 counts | High rate bins dominated by noise | Noise dominated (total time) | Noise dominated (detector-on time) | Marked lightcurve |
|---|---|---|---|---|---|---|---|
| A | 7575 | 6696 | 8 | 8 | 0.11% | 0.12% | 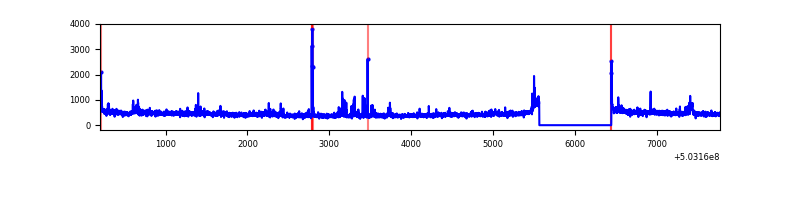 |
| B | 7576 | 6696 | 21 | 21 | 0.28% | 0.31% | 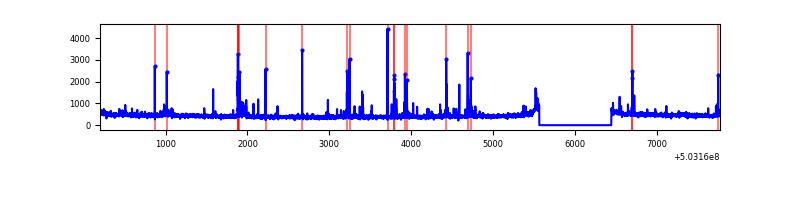 |
| C | 7576 | 6697 | 822 | 822 | 10.85% | 12.27% | 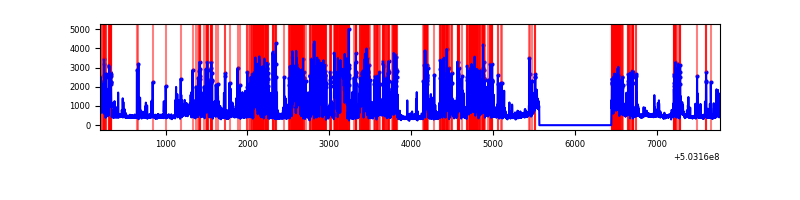 |
| D | 7576 | 6697 | 460 | 460 | 6.07% | 6.87% | 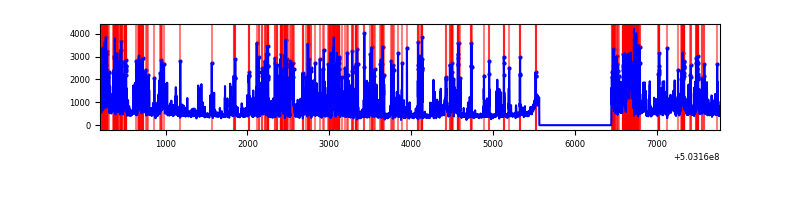 |
Top three noisy pixels from each quadrant. If the there are fewer than three noisy pixels in the level2.evt file, extra rows are filled as -1
| Pixel properties | Quadrant properties | ||||||
|---|---|---|---|---|---|---|---|
| Quadrant | DetID | PixID | Counts | Sigma | Mean | Median | Sigma |
| A | 0 | 8 | 111704 | 622.62 | 722 | 707 | 178.3 |
| A | 12 | 115 | 56065 | 310.52 | 722 | 707 | 178.3 |
| A | 4 | 3 | 31772 | 174.25 | 722 | 707 | 178.3 |
| B | 10 | 247 | 114666 | 743.7 | 710 | 684 | 153.3 |
| B | 2 | 249 | 57226 | 368.92 | 710 | 684 | 153.3 |
| B | 4 | 81 | 42458 | 272.56 | 710 | 684 | 153.3 |
| C | 12 | 254 | 2274655 | 12515.02 | 658 | 650 | 181.7 |
| C | 6 | 13 | 689483 | 3791.0 | 658 | 650 | 181.7 |
| C | 14 | 254 | 409113 | 2247.98 | 658 | 650 | 181.7 |
| D | 2 | 249 | 1213238 | 6314.85 | 675 | 645 | 192.0 |
| D | 11 | 129 | 1187614 | 6181.41 | 675 | 645 | 192.0 |
| D | 7 | 96 | 187268 | 971.88 | 675 | 645 | 192.0 |
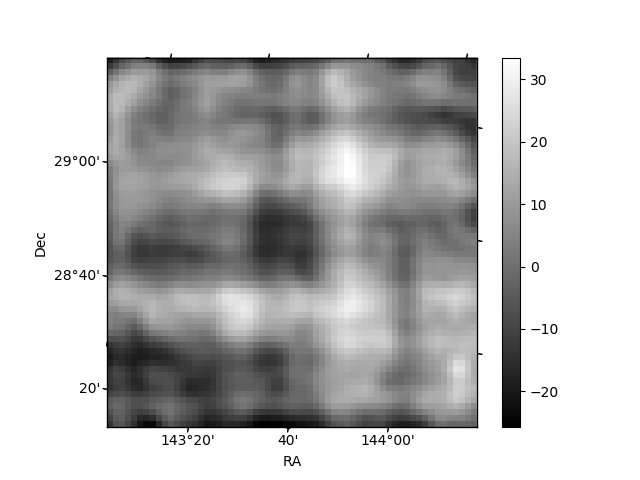
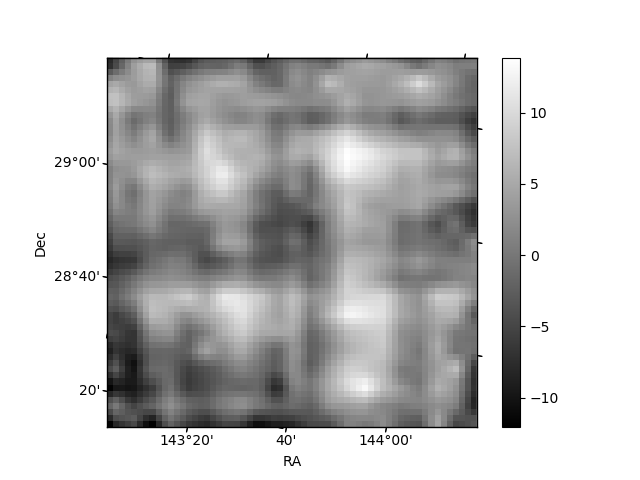
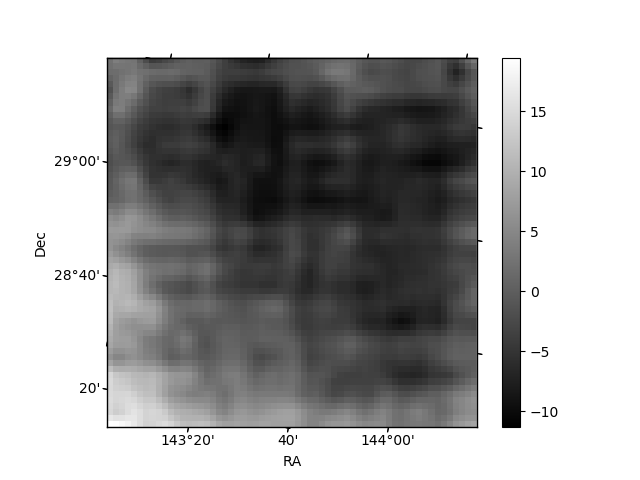
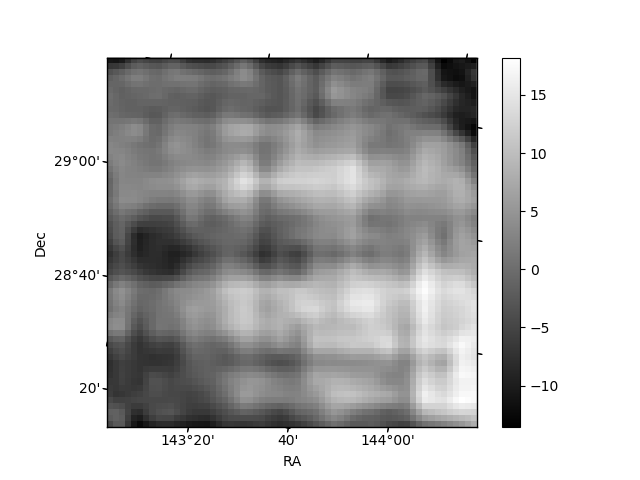
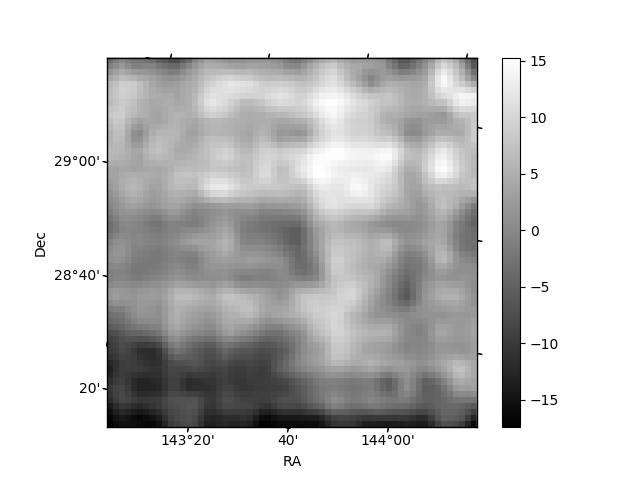
Histogram calculated using DETX and DETY for each event in the final _common_clean file
| Quadrant A | 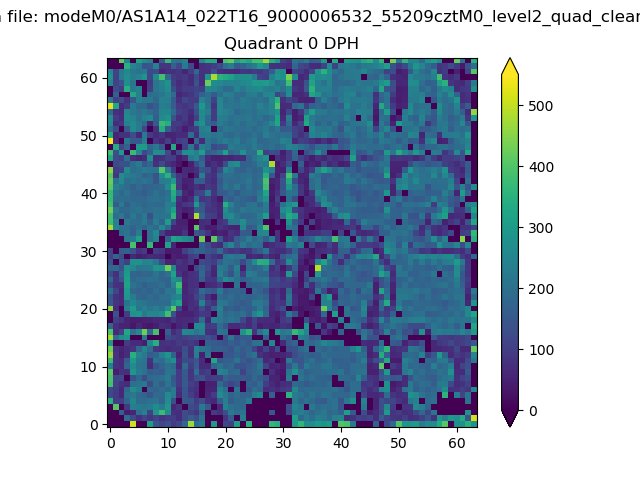 |
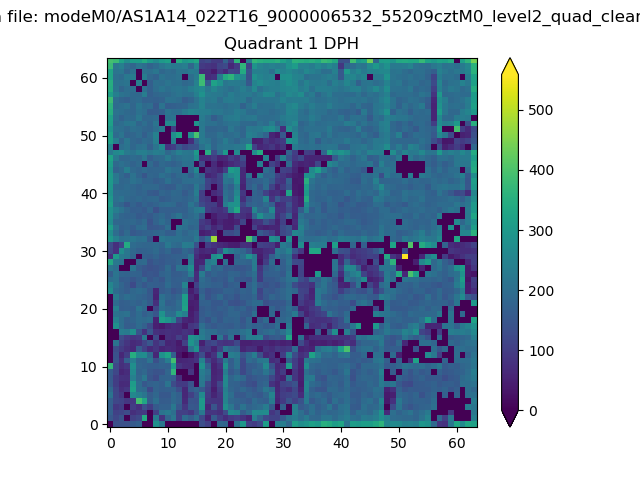 |
Quadrant B |
|---|---|---|---|
| Quadrant D | 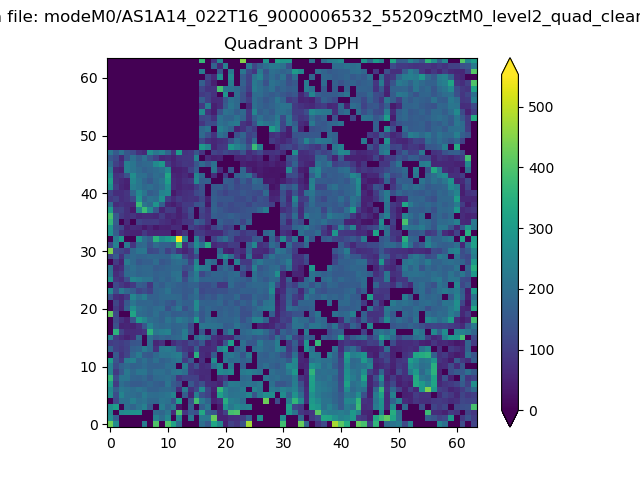 |
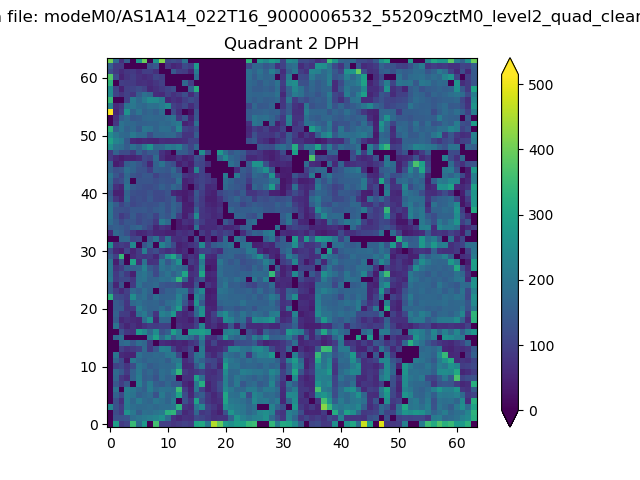 |
Quadrant C |
| Plot type | Count rate plots | Images |
|---|---|---|
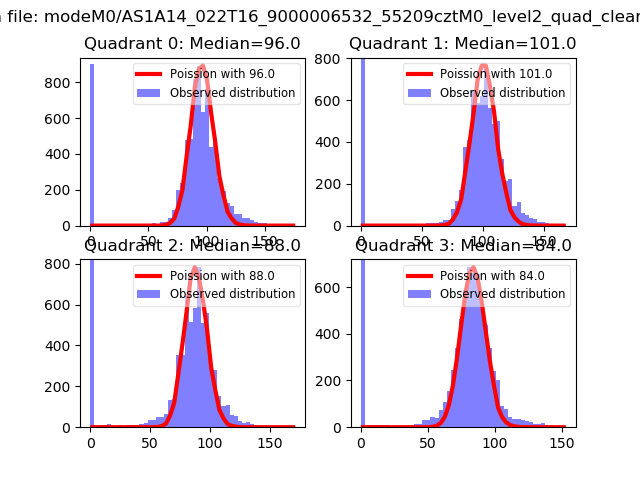
| Comparison with Poisson distribution Blue bars denote a histogram of data divided into 1 sec bins. Red curve is a Poisson curve with rate = median count rate of data. |
 |
 |
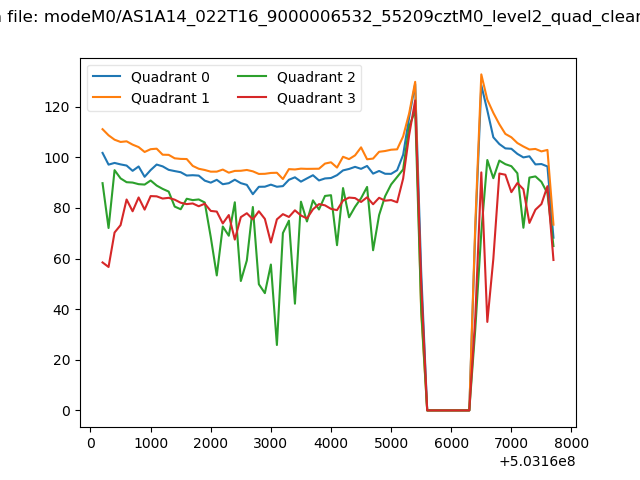
| Quadrant-wise count rates Data is divided into 100 sec bins |
 |
|
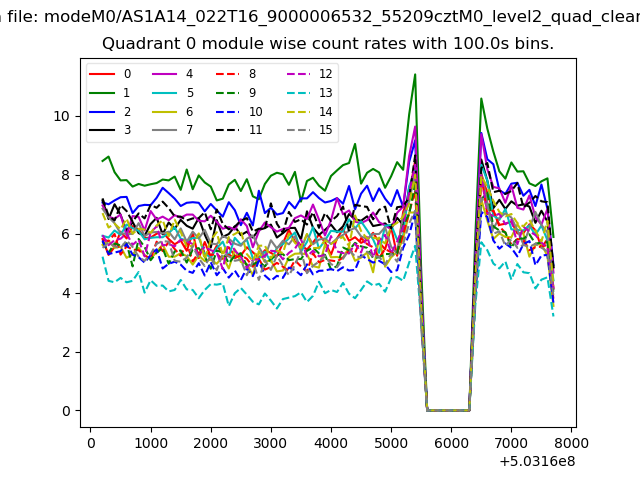
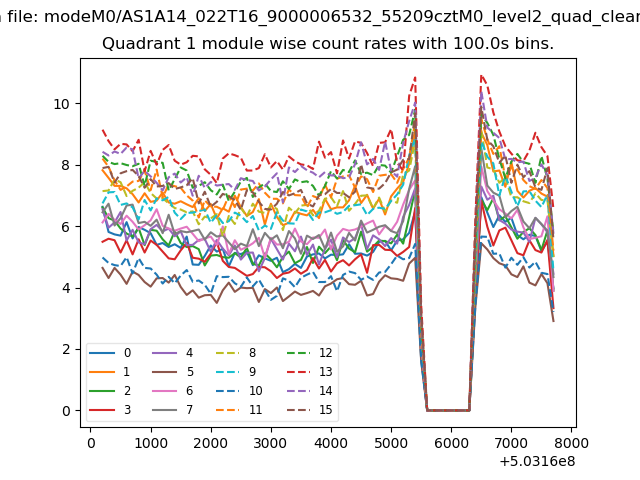
| Module-wise count rates for Quadrant A Data is divided into 100 sec bins |
 |
 |
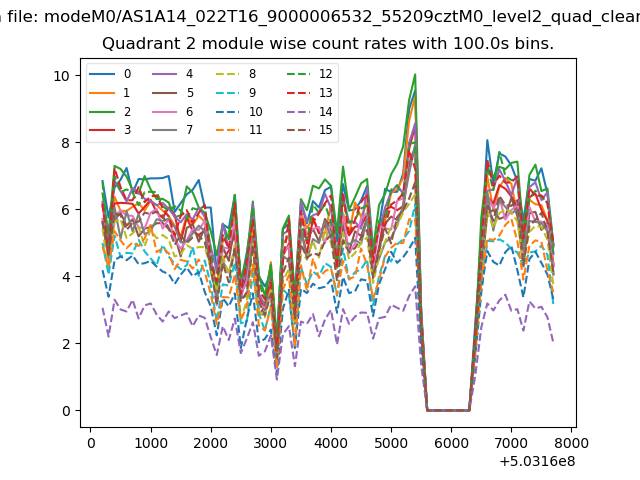
| Module-wise count rates for Quadrant B Data is divided into 100 sec bins |
 |
 |
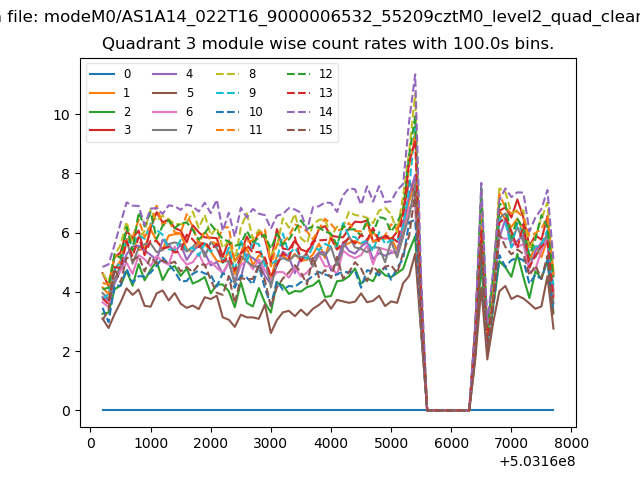
| Module-wise count rates for Quadrant C Data is divided into 100 sec bins |
 |
 |
| Module-wise count rates for Quadrant D Data is divided into 100 sec bins |
 |
 |
| Parameter | Plot |
|---|---|
| CZT HV Monitor | 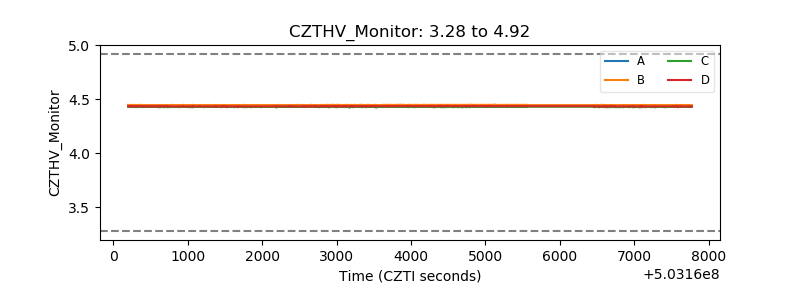 |
| D_VDD | 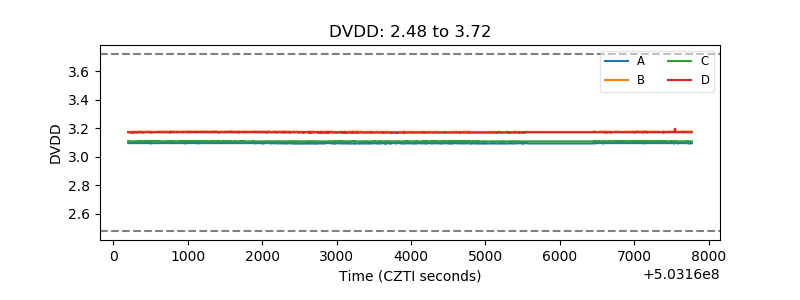 |
| Temperature 1 | 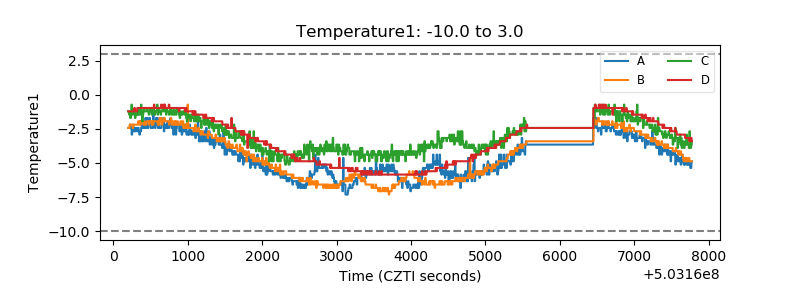 |
| Veto HV Monitor | 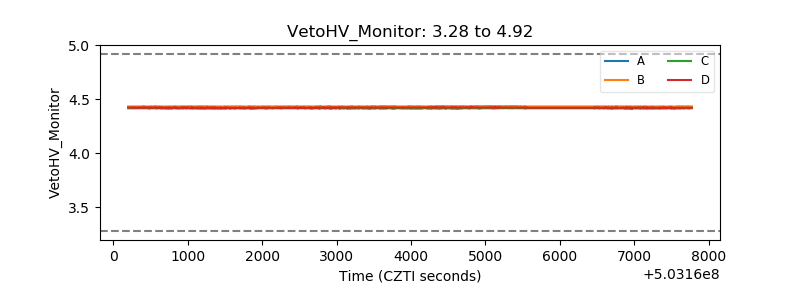 |
| Veto LLD | 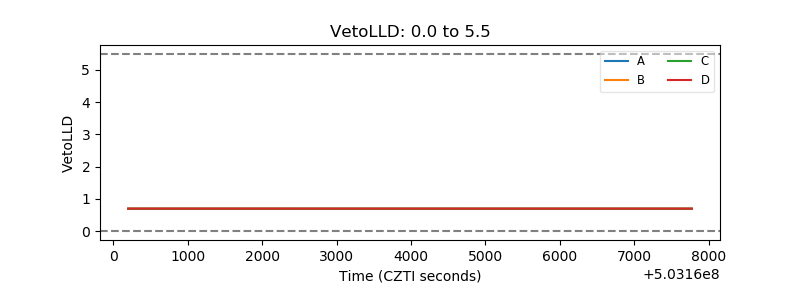 |
| Alpha Counter | 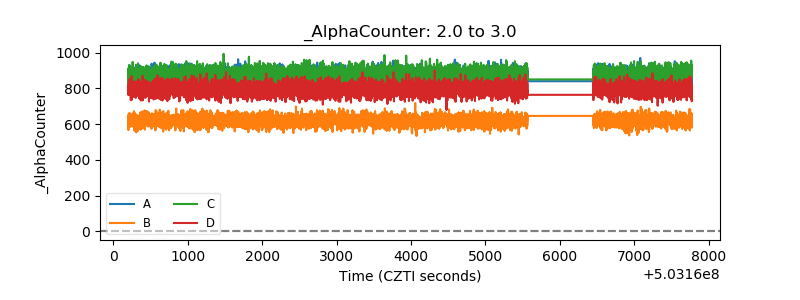 |
| _CPM_Rate | 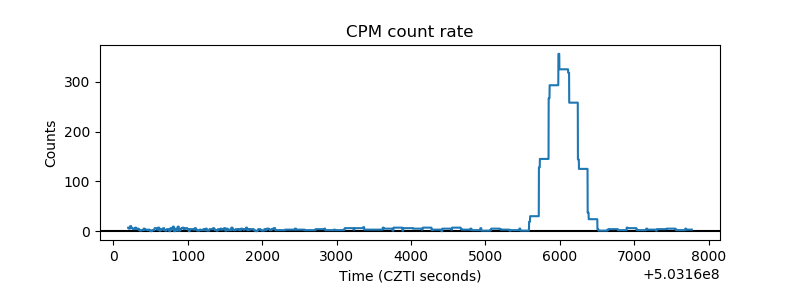 |
| CZT Counter | 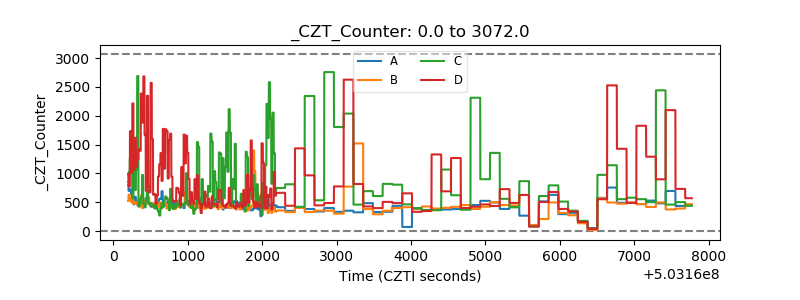 |
| +2.5 Volts monitor |  |
| +5 Volts monitor |  |
| _ROLL_ROT | 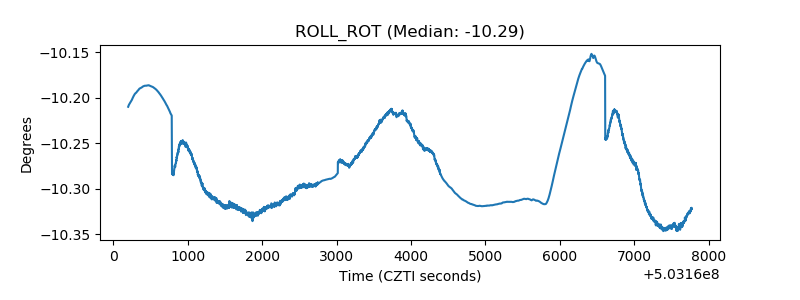 |
| _Roll_DEC | 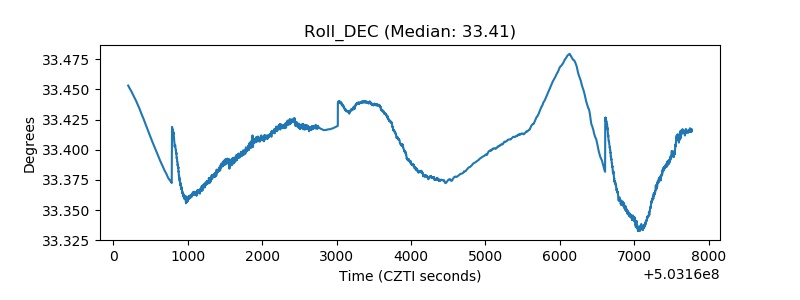 |
| _Roll_RA | 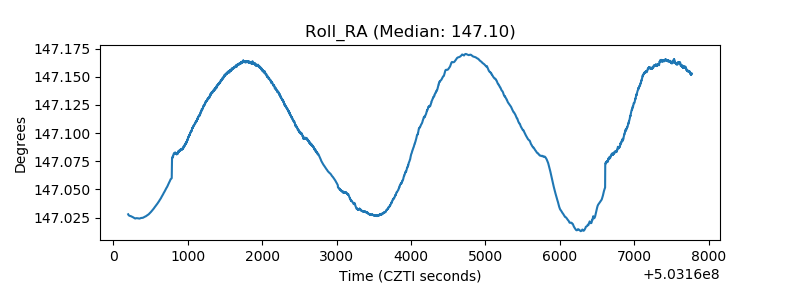 |
| Veto Counter | 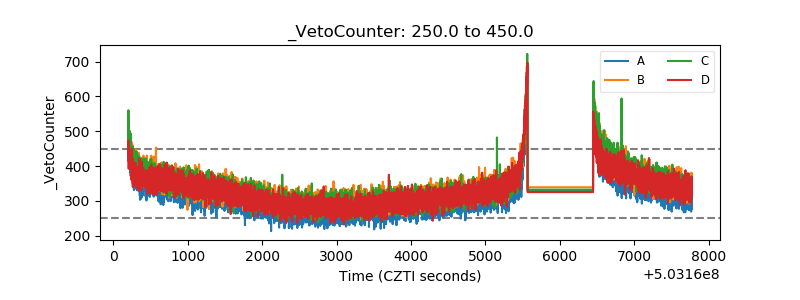 |