| Param | Original file | Final file |
|---|---|---|
| Filename | modeM0/AS1A14_022T16_9000006532_55211cztM0_level2.fits | modeM0/AS1A14_022T16_9000006532_55211cztM0_level2_quad_clean.evt |
| Size (bytes) | 467,403,840 | 99,745,920 |
| Size | 445.8 MB | 95.1 MB |
| Events in quadrant A | 3,217,790 | 669,880 |
| Events in quadrant B | 3,284,786 | 704,985 |
| Events in quadrant C | 5,015,535 | 594,682 |
| Events in quadrant D | 5,252,215 | 574,792 |
| Mode SS | |||
|---|---|---|---|
| Quadrant | BADHDUFLAG | Total packets | Discarded packets |
| A | 0 | 138 | 0 |
| B | 0 | 138 | 0 |
| C | 0 | 138 | 0 |
| D | 0 | 138 | 0 |
| Mode M0 | |||
|---|---|---|---|
| Quadrant | BADHDUFLAG | Total packets | Discarded packets |
| A | 0 | 14620 | 2 |
| B | 0 | 14833 | 2 |
| C | 0 | 19891 | 2 |
| D | 0 | 20446 | 2 |
| Mode M9 | |||
|---|---|---|---|
| Quadrant | BADHDUFLAG | Total packets | Discarded packets |
| A | 0 | 20 | 0 |
| B | 0 | 20 | 0 |
| C | 0 | 20 | 0 |
| D | 0 | 20 | 0 |
| Quadrant | Total seconds | Saturated seconds | Saturation percentage |
|---|---|---|---|
| A | 6837 | 80 | 1.170104% |
| B | 6838 | 121 | 1.769523% |
| C | 6838 | 569 | 8.321147% |
| D | 6838 | 439 | 6.420006% |
Noise dominated data is calculated using 1-second bins in cleaned event files. If a bin has >2000 counts, and if more than 50% of those come from <1% of pixels, then it is considered to be noise-dominated and hence unusable.
| Quadrant | # 1 sec bins | Bins with >0 counts | Bins with >2000 counts | High rate bins dominated by noise | Noise dominated (total time) | Noise dominated (detector-on time) | Marked lightcurve |
|---|---|---|---|---|---|---|---|
| A | 8747 | 6839 | 16 | 16 | 0.18% | 0.23% | 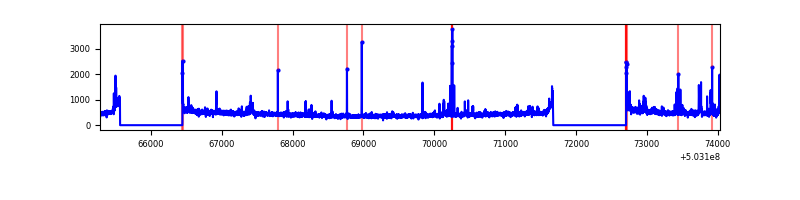 |
| B | 8748 | 6839 | 37 | 37 | 0.42% | 0.54% | 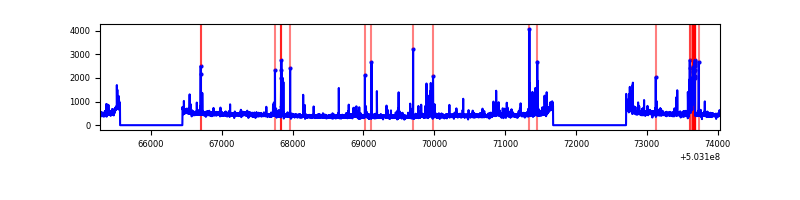 |
| C | 8748 | 6840 | 449 | 449 | 5.13% | 6.56% | 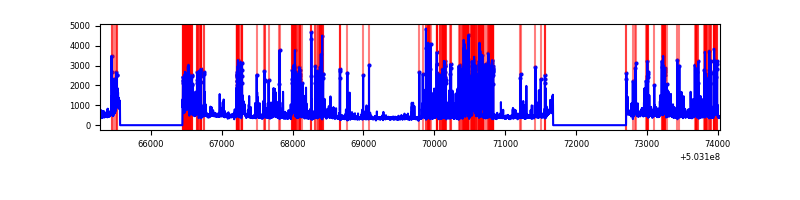 |
| D | 8747 | 6838 | 365 | 365 | 4.17% | 5.34% | 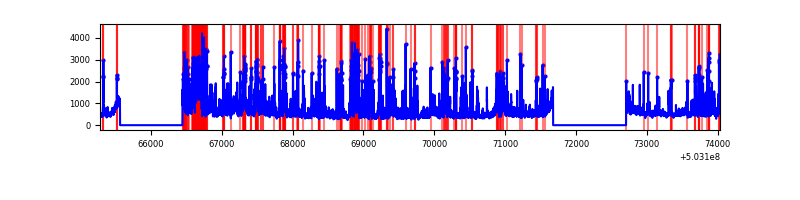 |
Top three noisy pixels from each quadrant. If the there are fewer than three noisy pixels in the level2.evt file, extra rows are filled as -1
| Pixel properties | Quadrant properties | ||||||
|---|---|---|---|---|---|---|---|
| Quadrant | DetID | PixID | Counts | Sigma | Mean | Median | Sigma |
| A | 12 | 115 | 103690 | 555.89 | 750 | 732 | 185.2 |
| A | 0 | 8 | 72960 | 389.97 | 750 | 732 | 185.2 |
| A | 11 | 191 | 39528 | 209.47 | 750 | 732 | 185.2 |
| B | 2 | 249 | 136635 | 854.74 | 738 | 710 | 159.0 |
| B | 10 | 247 | 84946 | 529.7 | 738 | 710 | 159.0 |
| B | 5 | 172 | 62813 | 390.52 | 738 | 710 | 159.0 |
| C | 12 | 254 | 1164330 | 5943.53 | 707 | 699 | 195.8 |
| C | 14 | 254 | 561180 | 2862.79 | 707 | 699 | 195.8 |
| C | 13 | 3 | 358862 | 1829.4 | 707 | 699 | 195.8 |
| D | 11 | 129 | 1016778 | 5047.79 | 712 | 682 | 201.3 |
| D | 2 | 249 | 932112 | 4627.19 | 712 | 682 | 201.3 |
| D | 3 | 12 | 124811 | 616.65 | 712 | 682 | 201.3 |
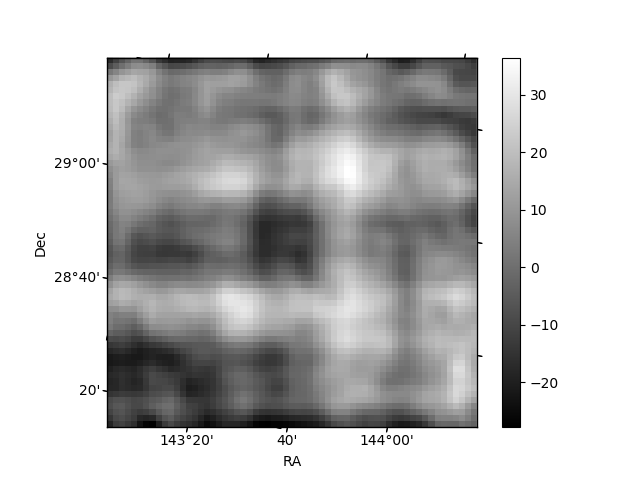
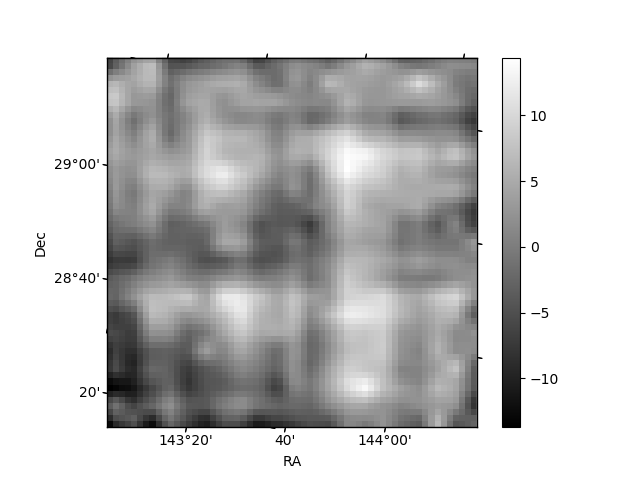
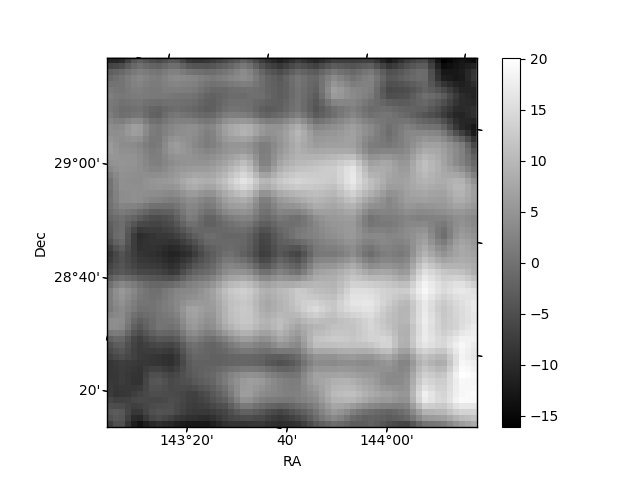
Histogram calculated using DETX and DETY for each event in the final _common_clean file
| Quadrant A | 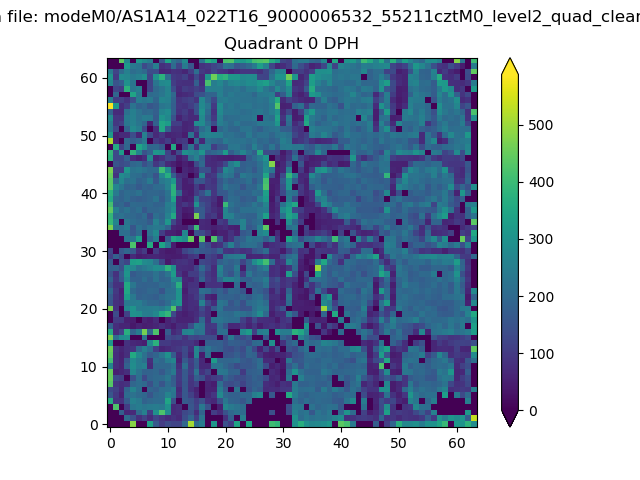 |
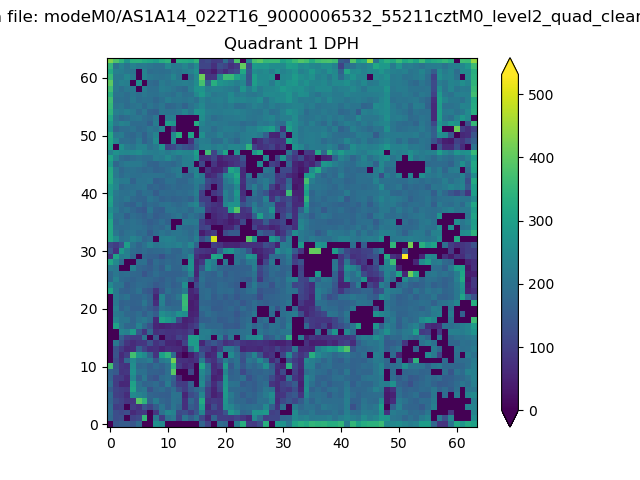 |
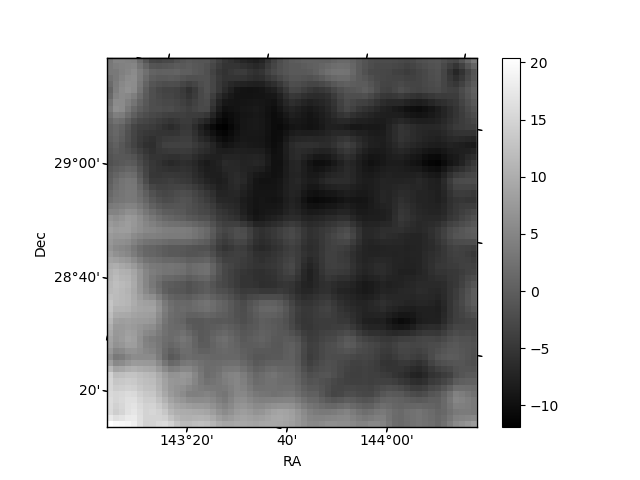
Quadrant B |
|---|---|---|---|
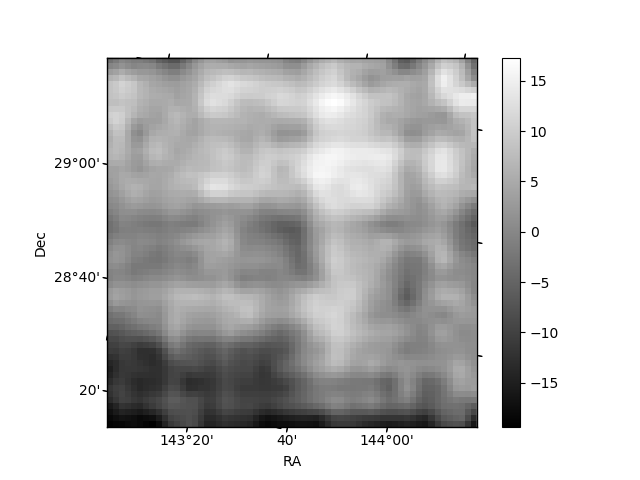
| Quadrant D | 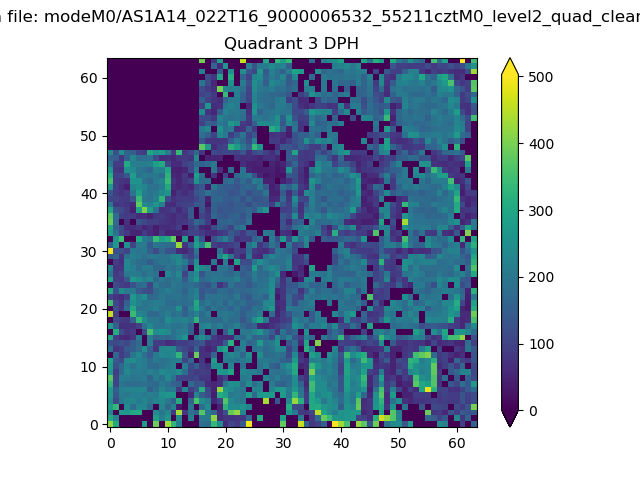 |
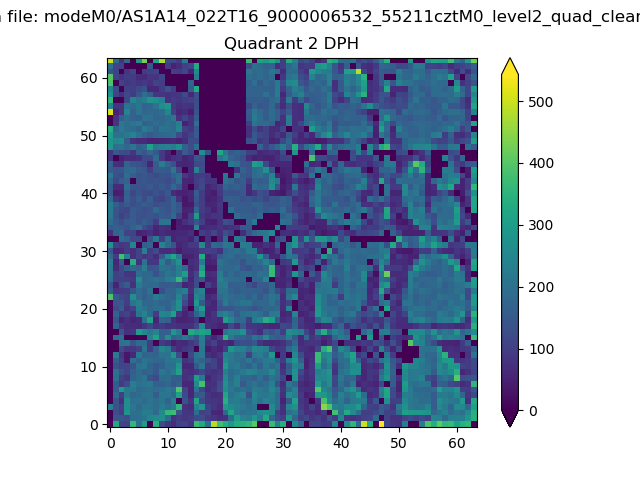 |
Quadrant C |
| Plot type | Count rate plots | Images |
|---|---|---|
| Comparison with Poisson distribution Blue bars denote a histogram of data divided into 1 sec bins. Red curve is a Poisson curve with rate = median count rate of data. |
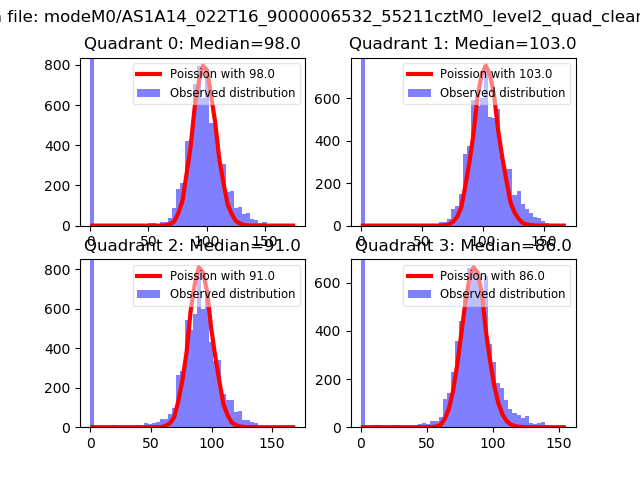 |
 |
| Quadrant-wise count rates Data is divided into 100 sec bins |
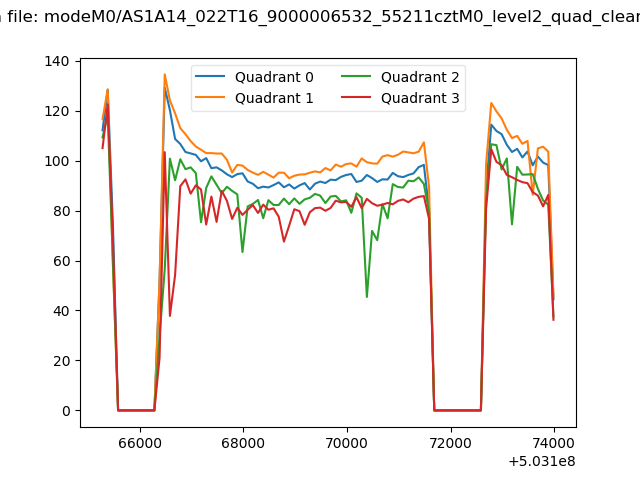 |
|
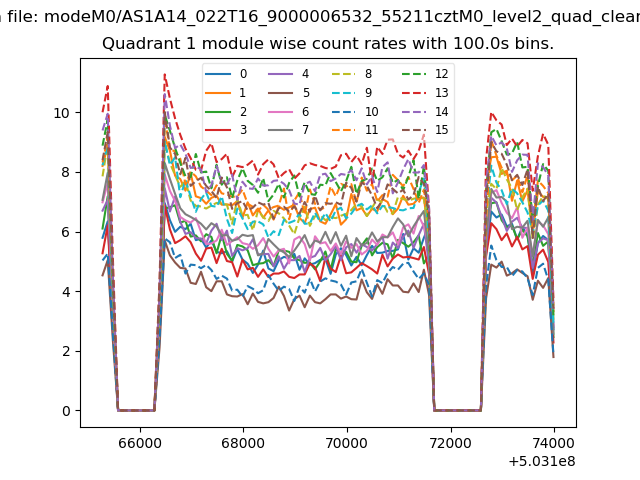
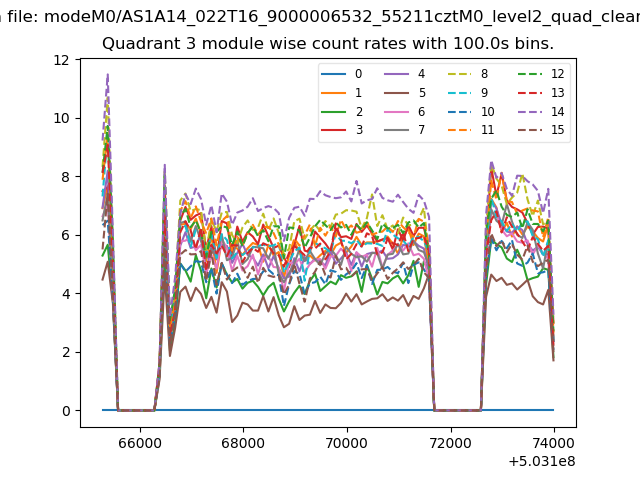
| Module-wise count rates for Quadrant A Data is divided into 100 sec bins |
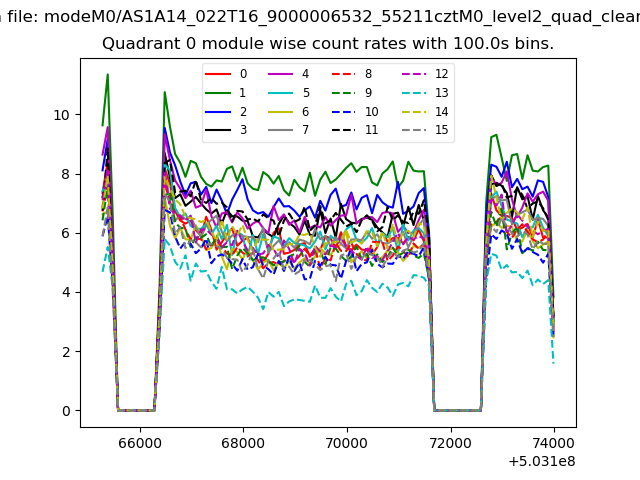 |
 |
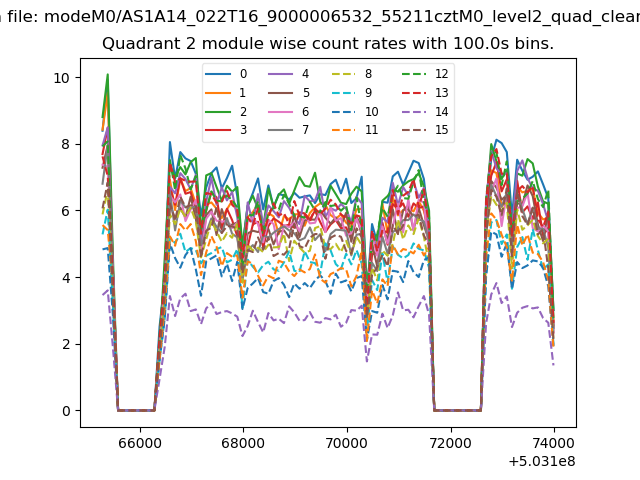
| Module-wise count rates for Quadrant B Data is divided into 100 sec bins |
 |
 |
| Module-wise count rates for Quadrant C Data is divided into 100 sec bins |
 |
 |
| Module-wise count rates for Quadrant D Data is divided into 100 sec bins |
 |
 |
| Parameter | Plot |
|---|---|
| CZT HV Monitor | 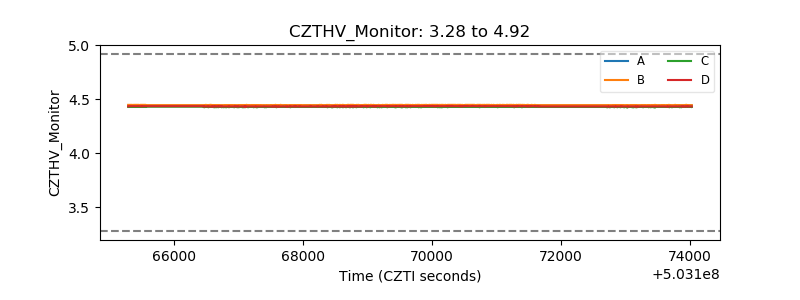 |
| D_VDD | 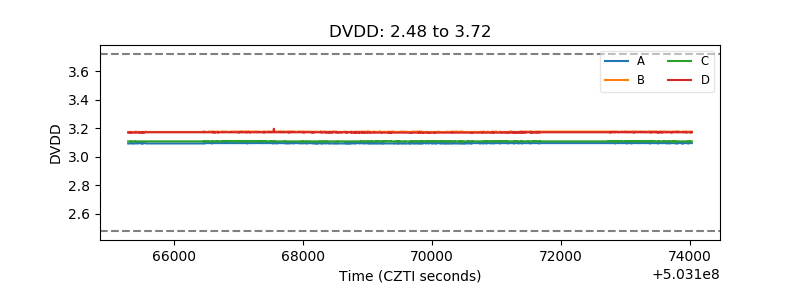 |
| Temperature 1 | 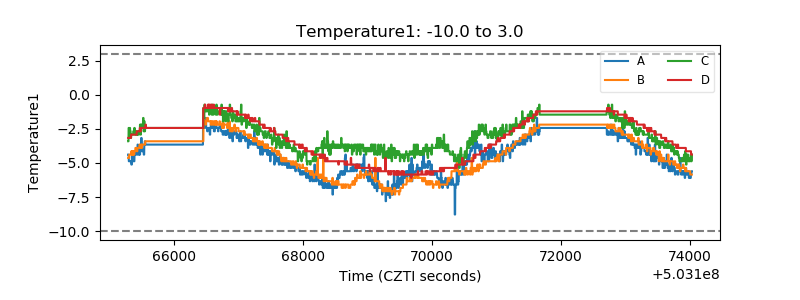 |
| Veto HV Monitor |  |
| Veto LLD | 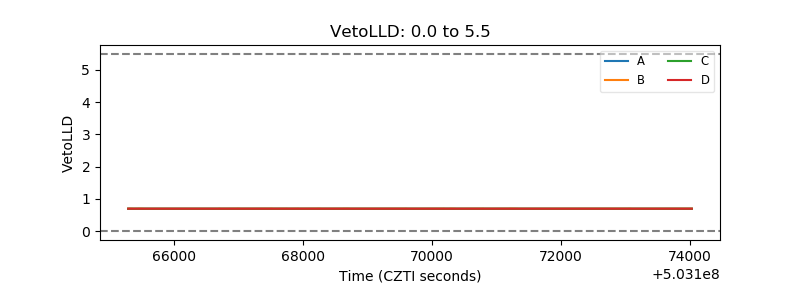 |
| Alpha Counter | 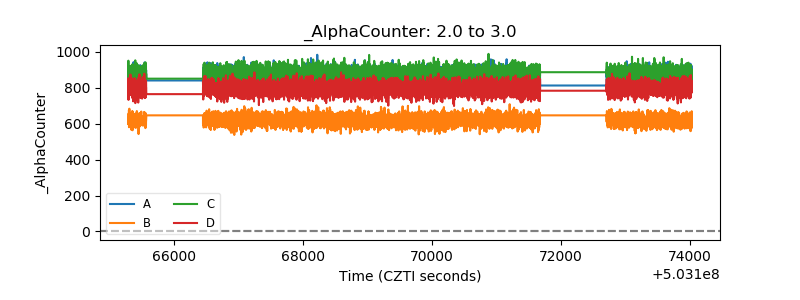 |
| _CPM_Rate | 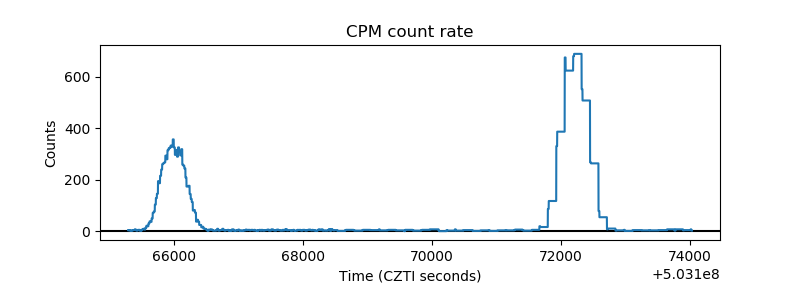 |
| CZT Counter | 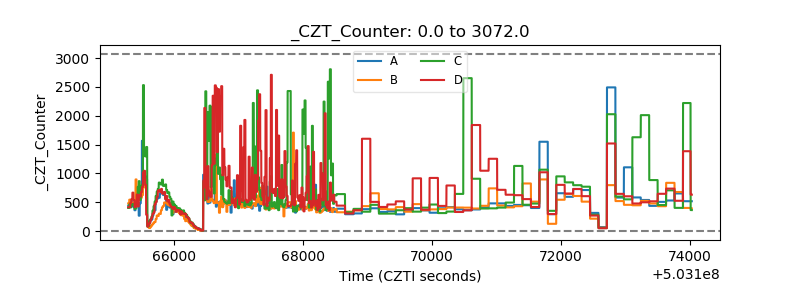 |
| +2.5 Volts monitor |  |
| +5 Volts monitor |  |
| _ROLL_ROT | 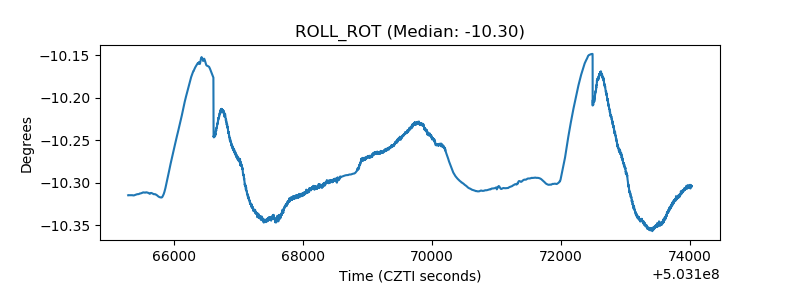 |
| _Roll_DEC | 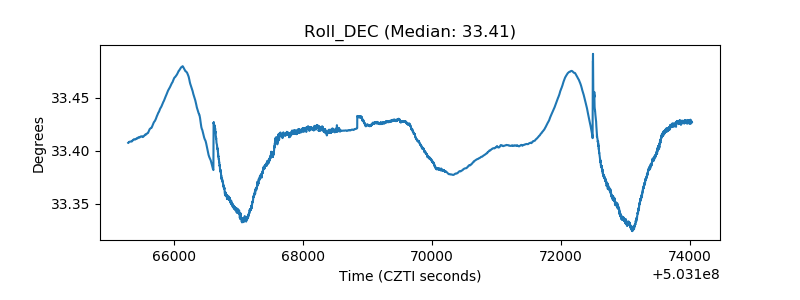 |
| _Roll_RA | 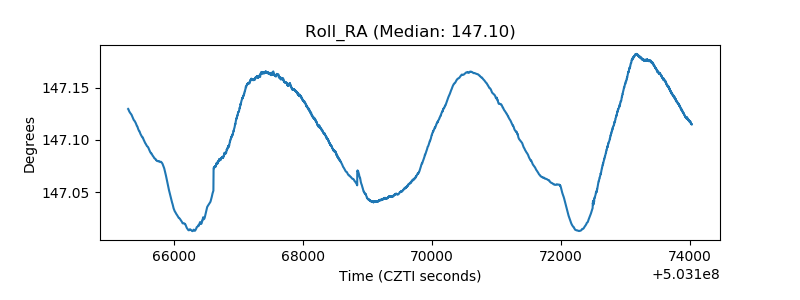 |
| Veto Counter | 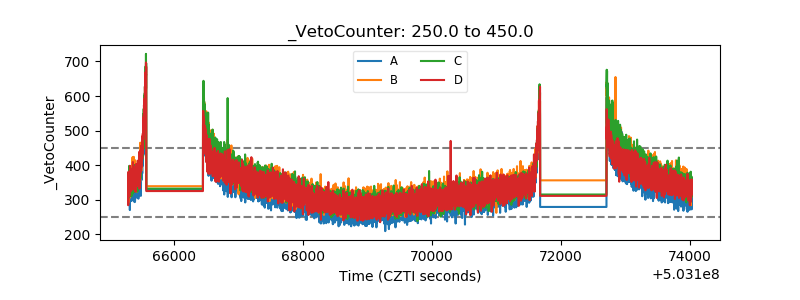 |