| Param | Original file | Final file |
|---|---|---|
| Filename | modeM0/AS1A14_022T16_9000006532_55212cztM0_level2.fits | modeM0/AS1A14_022T16_9000006532_55212cztM0_level2_quad_clean.evt |
| Size (bytes) | 398,404,800 | 98,078,400 |
| Size | 379.9 MB | 93.5 MB |
| Events in quadrant A | 3,256,361 | 646,048 |
| Events in quadrant B | 3,026,964 | 690,777 |
| Events in quadrant C | 3,973,063 | 600,941 |
| Events in quadrant D | 3,986,150 | 579,544 |
| Mode SS | |||
|---|---|---|---|
| Quadrant | BADHDUFLAG | Total packets | Discarded packets |
| A | 0 | 134 | 0 |
| B | 0 | 134 | 0 |
| C | 0 | 134 | 0 |
| D | 0 | 134 | 0 |
| Mode M0 | |||
|---|---|---|---|
| Quadrant | BADHDUFLAG | Total packets | Discarded packets |
| A | 0 | 14485 | 2 |
| B | 0 | 13834 | 2 |
| C | 0 | 16485 | 2 |
| D | 0 | 16469 | 2 |
| Mode M9 | |||
|---|---|---|---|
| Quadrant | BADHDUFLAG | Total packets | Discarded packets |
| A | 0 | 22 | 0 |
| B | 0 | 22 | 0 |
| C | 0 | 22 | 0 |
| D | 0 | 22 | 0 |
| Quadrant | Total seconds | Saturated seconds | Saturation percentage |
|---|---|---|---|
| A | 6488 | 116 | 1.787916% |
| B | 6488 | 76 | 1.171393% |
| C | 6489 | 250 | 3.852674% |
| D | 6489 | 141 | 2.172908% |
Noise dominated data is calculated using 1-second bins in cleaned event files. If a bin has >2000 counts, and if more than 50% of those come from <1% of pixels, then it is considered to be noise-dominated and hence unusable.
| Quadrant | # 1 sec bins | Bins with >0 counts | Bins with >2000 counts | High rate bins dominated by noise | Noise dominated (total time) | Noise dominated (detector-on time) | Marked lightcurve |
|---|---|---|---|---|---|---|---|
| A | 8638 | 6490 | 72 | 72 | 0.83% | 1.11% | 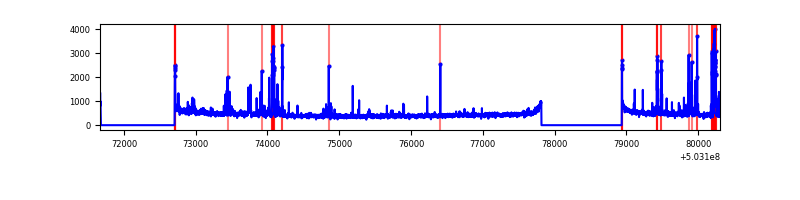 |
| B | 8638 | 6490 | 32 | 32 | 0.37% | 0.49% | 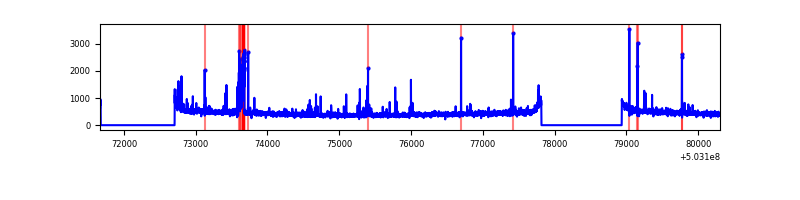 |
| C | 8639 | 6491 | 191 | 191 | 2.21% | 2.94% | 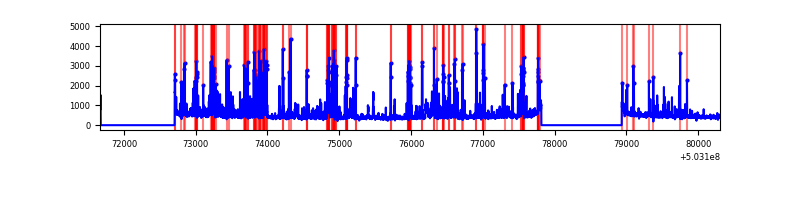 |
| D | 8639 | 6490 | 128 | 128 | 1.48% | 1.97% | 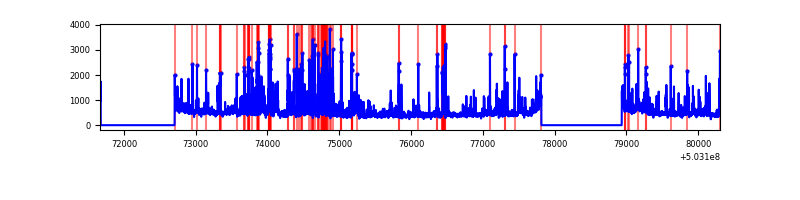 |
Top three noisy pixels from each quadrant. If the there are fewer than three noisy pixels in the level2.evt file, extra rows are filled as -1
| Pixel properties | Quadrant properties | ||||||
|---|---|---|---|---|---|---|---|
| Quadrant | DetID | PixID | Counts | Sigma | Mean | Median | Sigma |
| A | 0 | 8 | 312095 | 1783.62 | 701 | 687 | 174.6 |
| A | 12 | 115 | 84499 | 480.04 | 701 | 687 | 174.6 |
| A | 4 | 3 | 30099 | 168.46 | 701 | 687 | 174.6 |
| B | 2 | 249 | 104939 | 695.16 | 697 | 673 | 150.0 |
| B | 10 | 247 | 77918 | 515.01 | 697 | 673 | 150.0 |
| B | 5 | 172 | 23330 | 151.06 | 697 | 673 | 150.0 |
| C | 12 | 254 | 489870 | 2617.22 | 679 | 672 | 186.9 |
| C | 13 | 3 | 330186 | 1762.91 | 679 | 672 | 186.9 |
| C | 14 | 254 | 274891 | 1467.08 | 679 | 672 | 186.9 |
| D | 11 | 129 | 703114 | 3635.45 | 681 | 651 | 193.2 |
| D | 2 | 249 | 361431 | 1867.14 | 681 | 651 | 193.2 |
| D | 3 | 12 | 131480 | 677.08 | 681 | 651 | 193.2 |
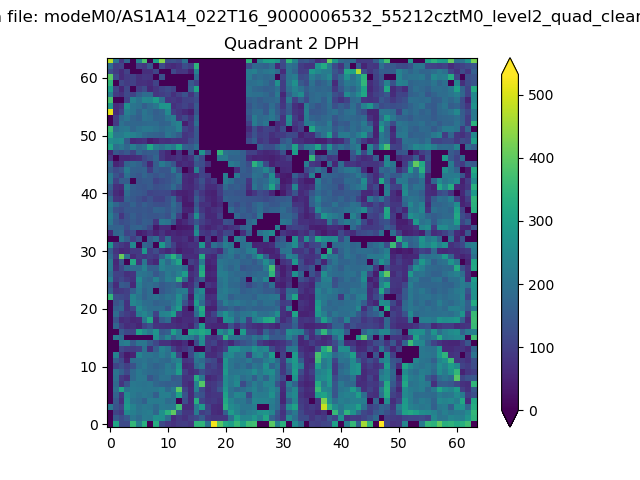
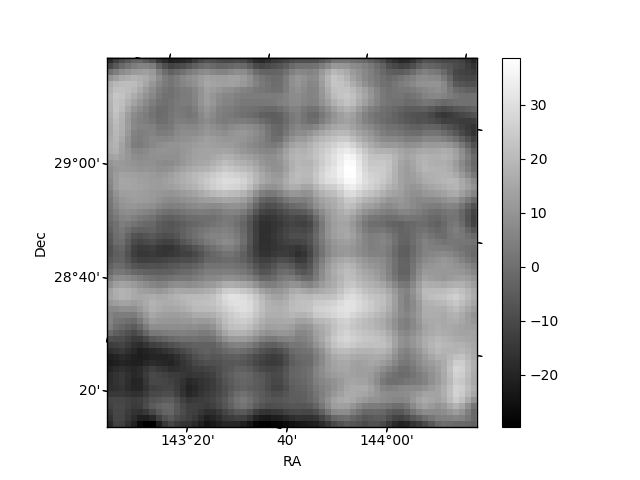
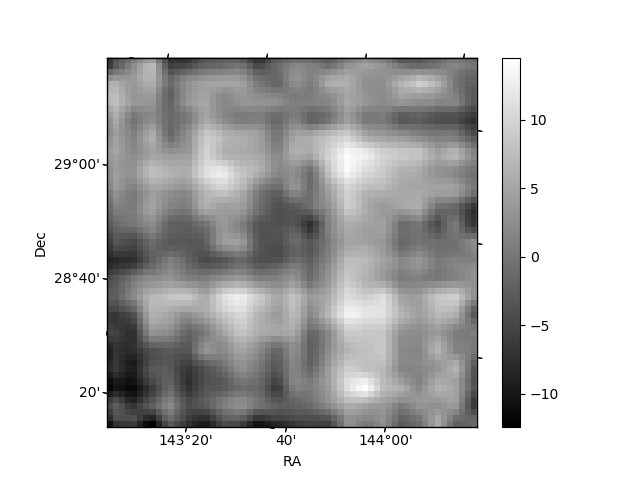
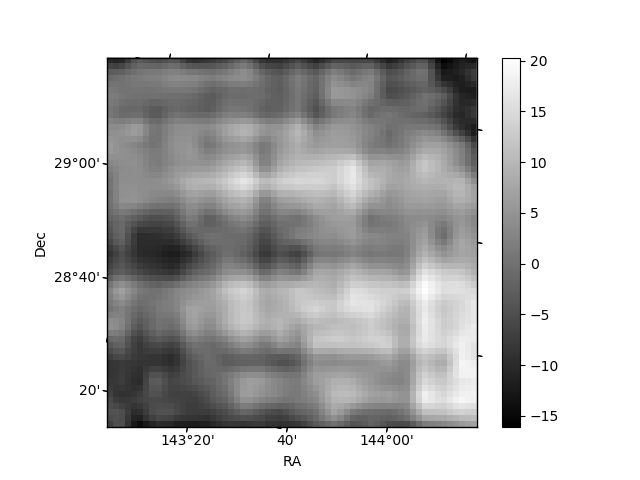
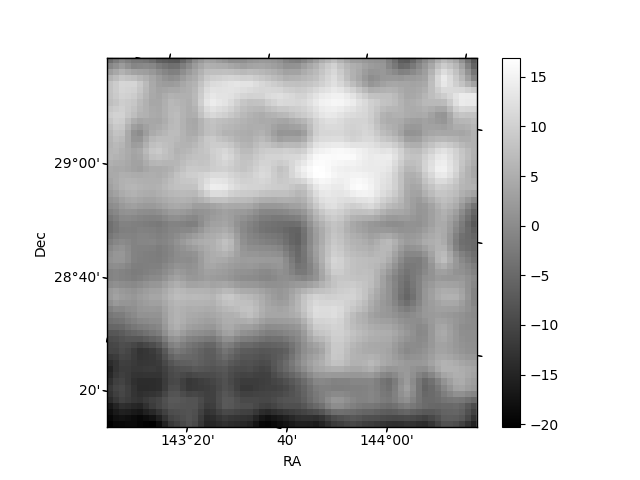
Histogram calculated using DETX and DETY for each event in the final _common_clean file
| Quadrant A | 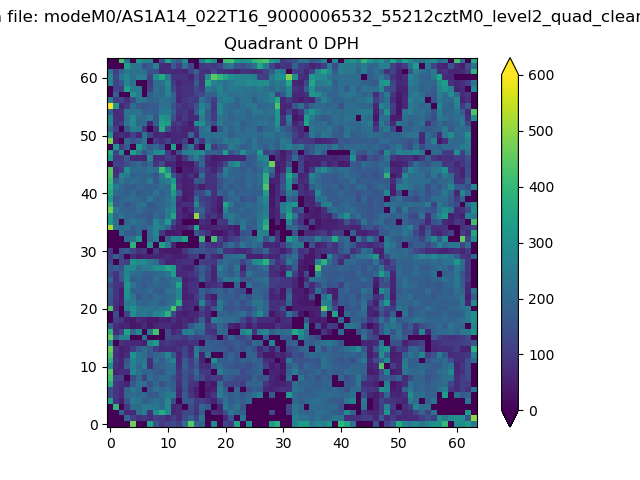 |
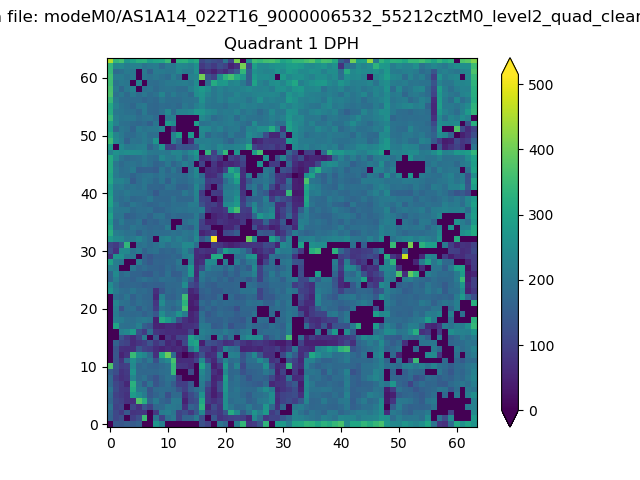 |
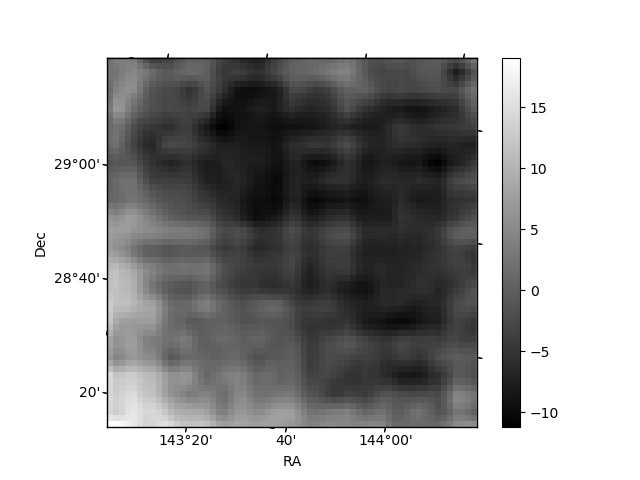
Quadrant B |
|---|---|---|---|
| Quadrant D | 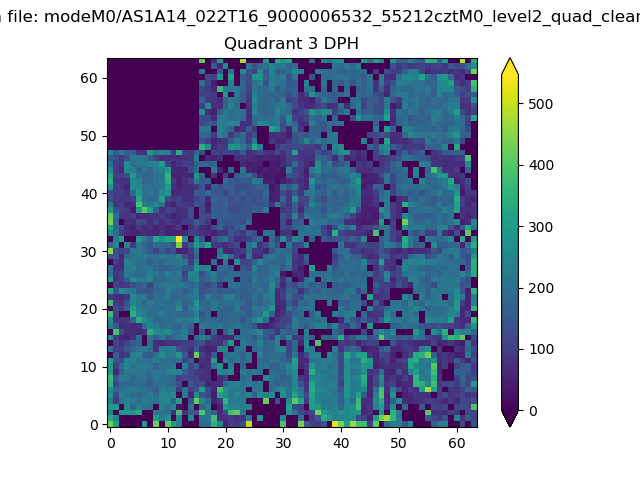 |
 |
Quadrant C |
| Plot type | Count rate plots | Images |
|---|---|---|
| Comparison with Poisson distribution Blue bars denote a histogram of data divided into 1 sec bins. Red curve is a Poisson curve with rate = median count rate of data. |
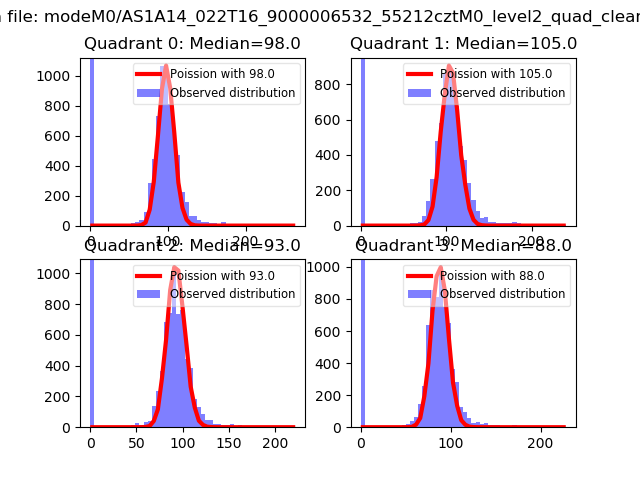 |
 |
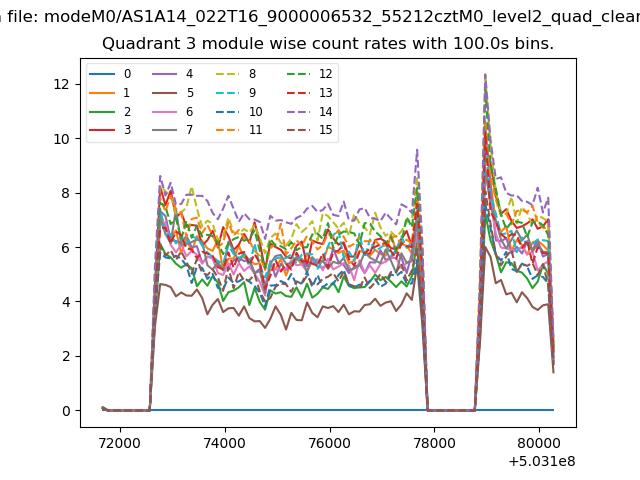
| Quadrant-wise count rates Data is divided into 100 sec bins |
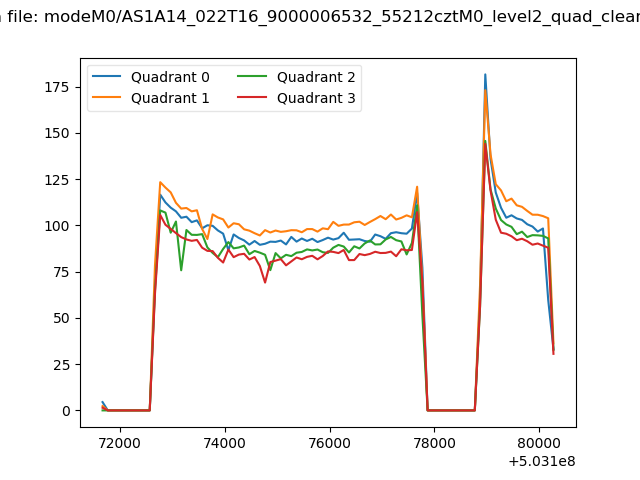 |
|
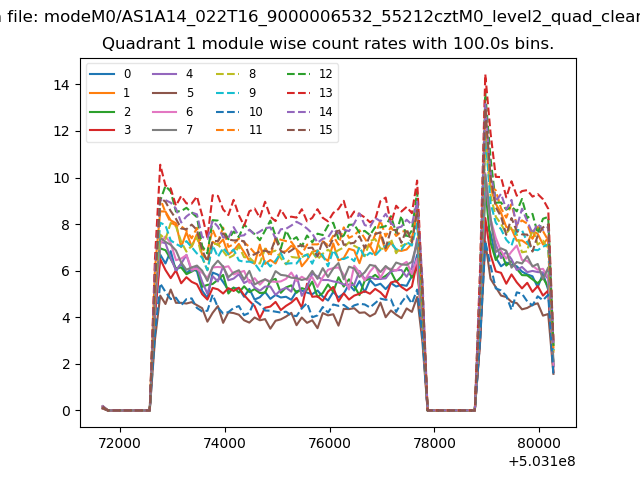
| Module-wise count rates for Quadrant A Data is divided into 100 sec bins |
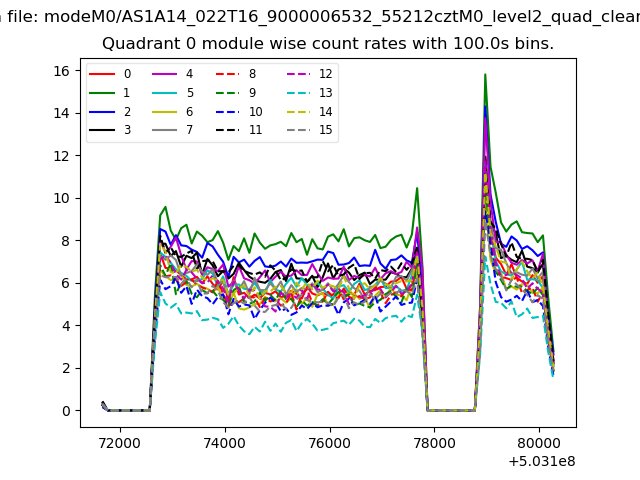 |
 |
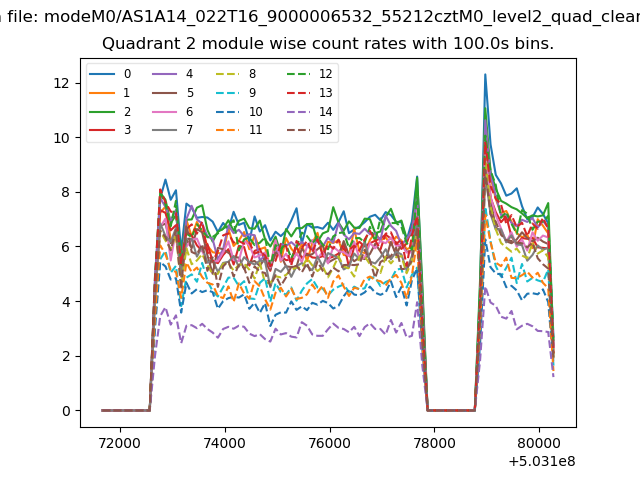
| Module-wise count rates for Quadrant B Data is divided into 100 sec bins |
 |
 |
| Module-wise count rates for Quadrant C Data is divided into 100 sec bins |
 |
 |
| Module-wise count rates for Quadrant D Data is divided into 100 sec bins |
 |
 |
| Parameter | Plot |
|---|---|
| CZT HV Monitor | 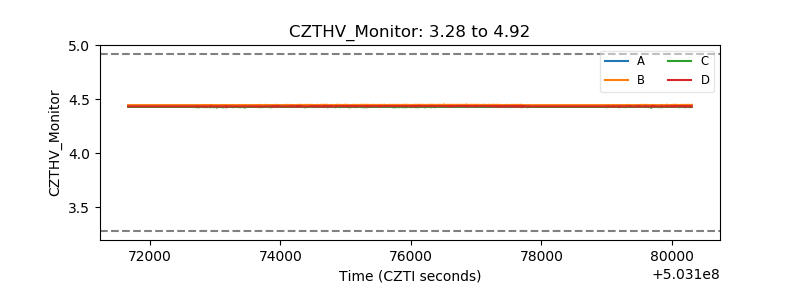 |
| D_VDD | 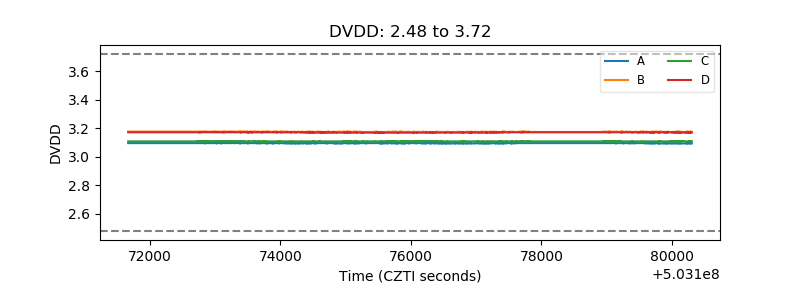 |
| Temperature 1 | 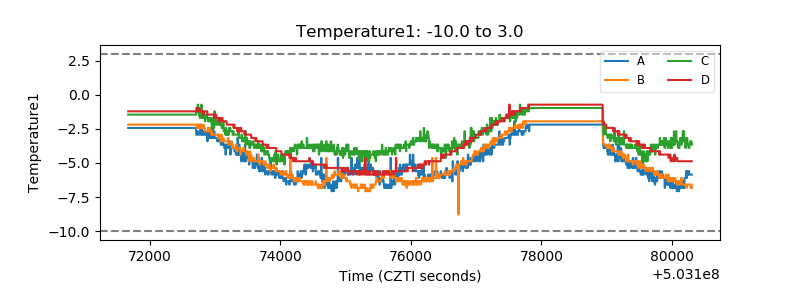 |
| Veto HV Monitor | 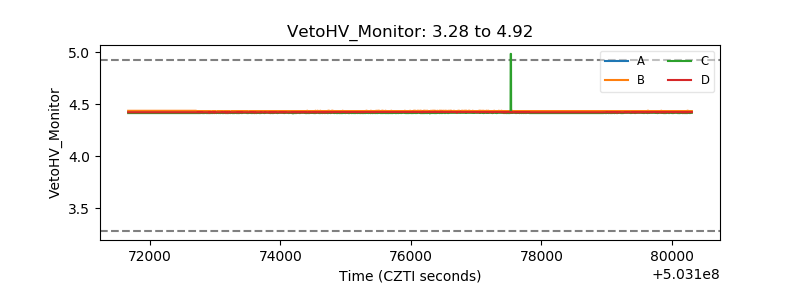 |
| Veto LLD | 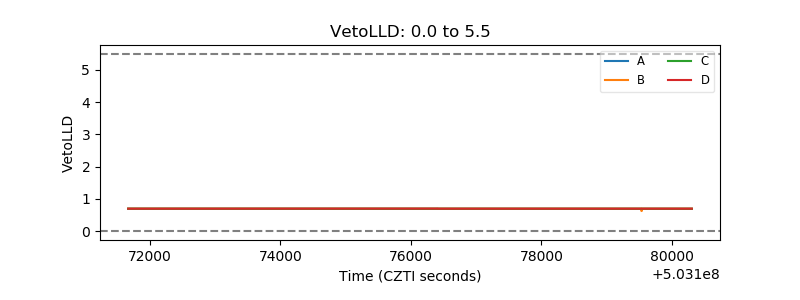 |
| Alpha Counter |  |
| _CPM_Rate | 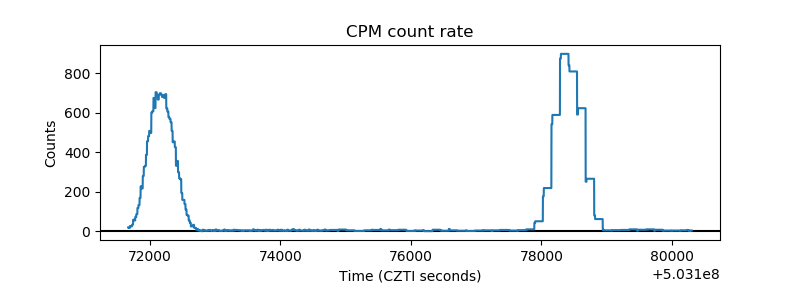 |
| CZT Counter | 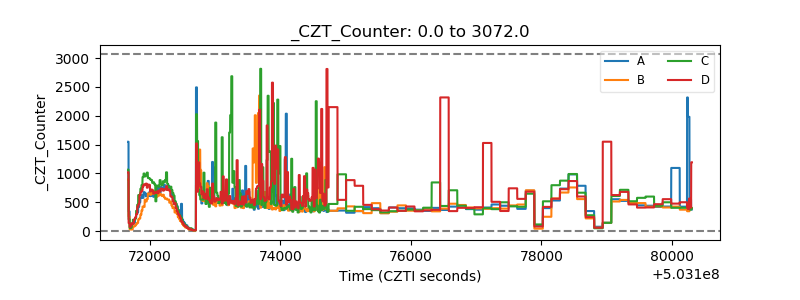 |
| +2.5 Volts monitor |  |
| +5 Volts monitor | 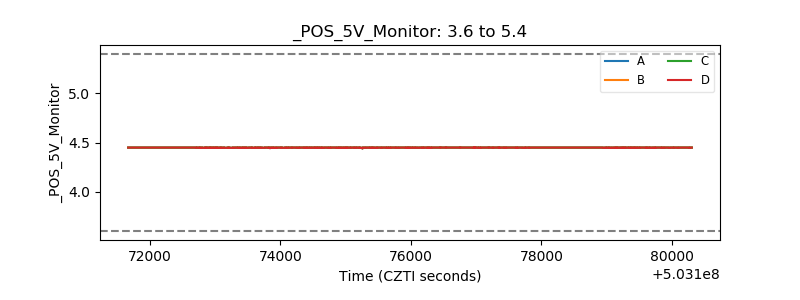 |
| _ROLL_ROT | 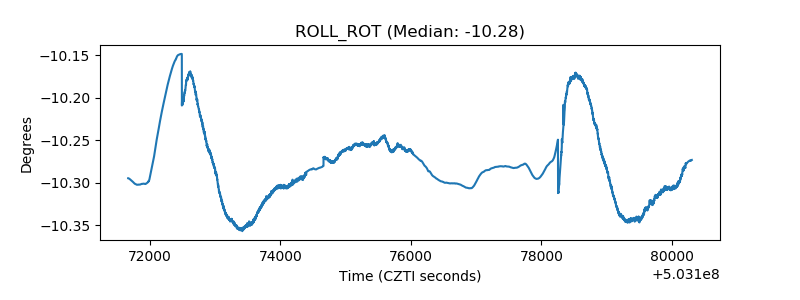 |
| _Roll_DEC | 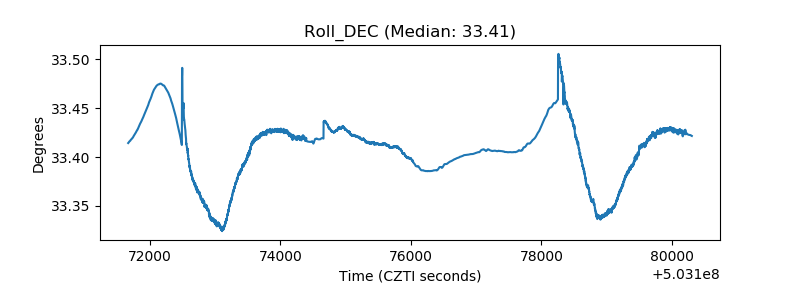 |
| _Roll_RA | 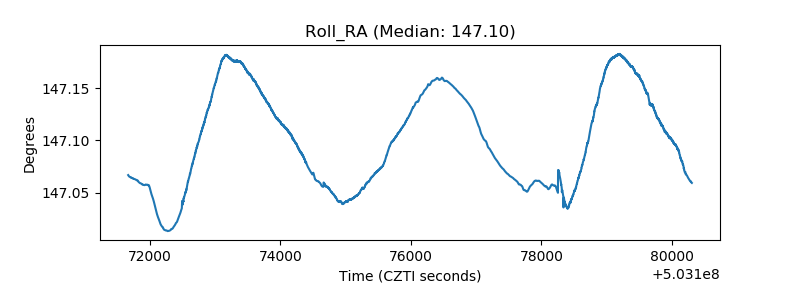 |
| Veto Counter | 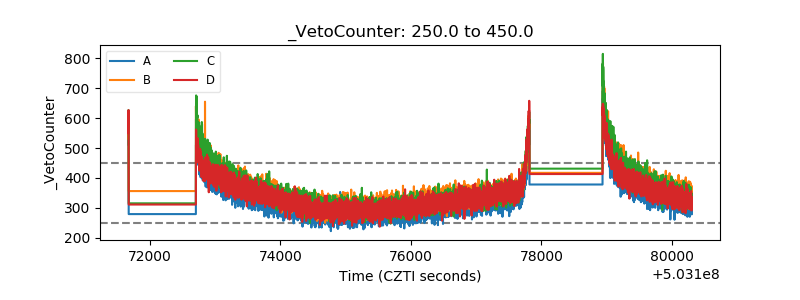 |