| Param | Original file | Final file |
|---|---|---|
| Filename | modeM0/AS1A14_022T16_9000006532_55213cztM0_level2.fits | modeM0/AS1A14_022T16_9000006532_55213cztM0_level2_quad_clean.evt |
| Size (bytes) | 422,876,160 | 102,283,200 |
| Size | 403.3 MB | 97.5 MB |
| Events in quadrant A | 3,598,390 | 671,806 |
| Events in quadrant B | 3,046,857 | 725,830 |
| Events in quadrant C | 4,442,420 | 625,021 |
| Events in quadrant D | 4,041,029 | 603,715 |
| Mode SS | |||
|---|---|---|---|
| Quadrant | BADHDUFLAG | Total packets | Discarded packets |
| A | 0 | 142 | 0 |
| B | 0 | 142 | 0 |
| C | 0 | 142 | 0 |
| D | 0 | 142 | 0 |
| Mode M0 | |||
|---|---|---|---|
| Quadrant | BADHDUFLAG | Total packets | Discarded packets |
| A | 0 | 15653 | 2 |
| B | 0 | 14134 | 2 |
| C | 0 | 18139 | 2 |
| D | 0 | 16887 | 2 |
| Mode M9 | |||
|---|---|---|---|
| Quadrant | BADHDUFLAG | Total packets | Discarded packets |
| A | 0 | 22 | 0 |
| B | 0 | 22 | 0 |
| C | 0 | 22 | 0 |
| D | 0 | 22 | 0 |
| Quadrant | Total seconds | Saturated seconds | Saturation percentage |
|---|---|---|---|
| A | 6745 | 177 | 2.624166% |
| B | 6745 | 66 | 0.978503% |
| C | 6746 | 299 | 4.432256% |
| D | 6746 | 121 | 1.793655% |
Noise dominated data is calculated using 1-second bins in cleaned event files. If a bin has >2000 counts, and if more than 50% of those come from <1% of pixels, then it is considered to be noise-dominated and hence unusable.
| Quadrant | # 1 sec bins | Bins with >0 counts | Bins with >2000 counts | High rate bins dominated by noise | Noise dominated (total time) | Noise dominated (detector-on time) | Marked lightcurve |
|---|---|---|---|---|---|---|---|
| A | 9030 | 6747 | 121 | 121 | 1.34% | 1.79% | 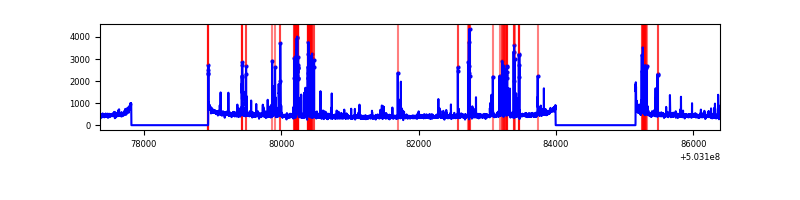 |
| B | 9030 | 6747 | 13 | 13 | 0.14% | 0.19% | 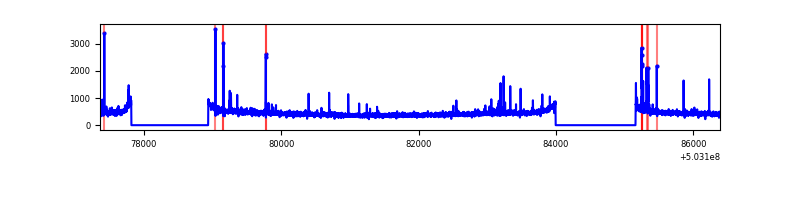 |
| C | 9031 | 6748 | 266 | 266 | 2.95% | 3.94% | 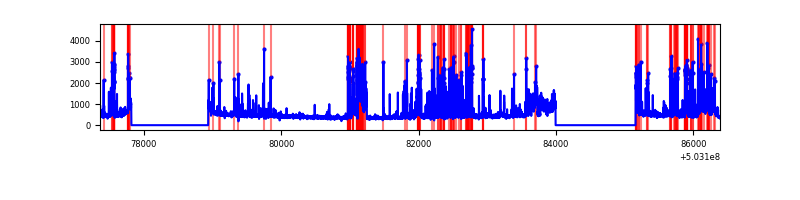 |
| D | 9031 | 6748 | 91 | 91 | 1.01% | 1.35% | 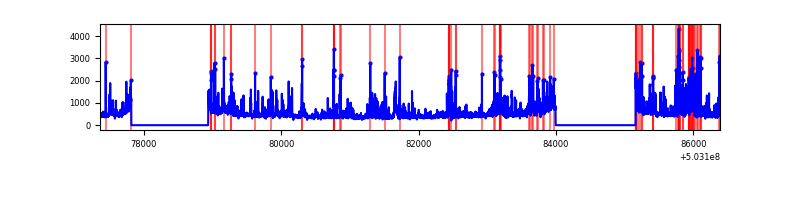 |
Top three noisy pixels from each quadrant. If the there are fewer than three noisy pixels in the level2.evt file, extra rows are filled as -1
| Pixel properties | Quadrant properties | ||||||
|---|---|---|---|---|---|---|---|
| Quadrant | DetID | PixID | Counts | Sigma | Mean | Median | Sigma |
| A | 0 | 8 | 554290 | 3032.59 | 735 | 716 | 182.5 |
| A | 4 | 205 | 58493 | 316.51 | 735 | 716 | 182.5 |
| A | 4 | 3 | 33968 | 182.16 | 735 | 716 | 182.5 |
| B | 10 | 247 | 36242 | 227.89 | 733 | 709 | 155.9 |
| B | 2 | 249 | 34253 | 215.13 | 733 | 709 | 155.9 |
| B | 5 | 172 | 24920 | 155.28 | 733 | 709 | 155.9 |
| C | 12 | 252 | 399081 | 2040.36 | 711 | 704 | 195.2 |
| C | 13 | 3 | 308780 | 1577.86 | 711 | 704 | 195.2 |
| C | 12 | 254 | 277243 | 1416.34 | 711 | 704 | 195.2 |
| D | 11 | 129 | 579677 | 2862.09 | 713 | 684 | 202.3 |
| D | 2 | 249 | 409149 | 2019.13 | 713 | 684 | 202.3 |
| D | 2 | 31 | 71253 | 348.84 | 713 | 684 | 202.3 |
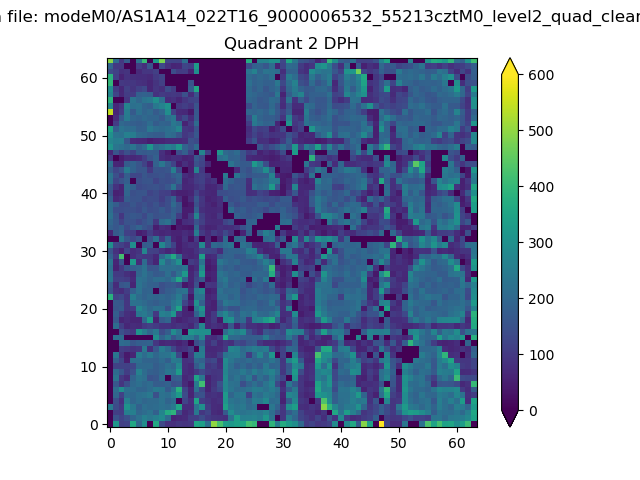
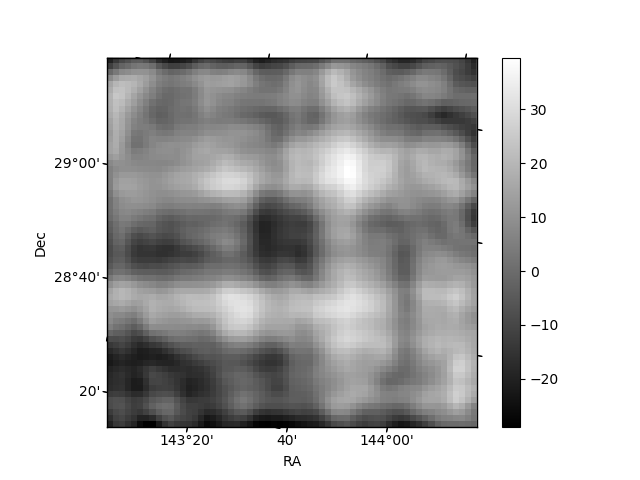
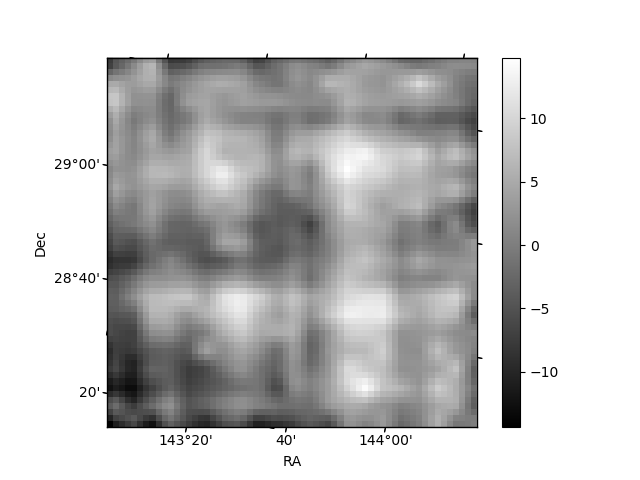
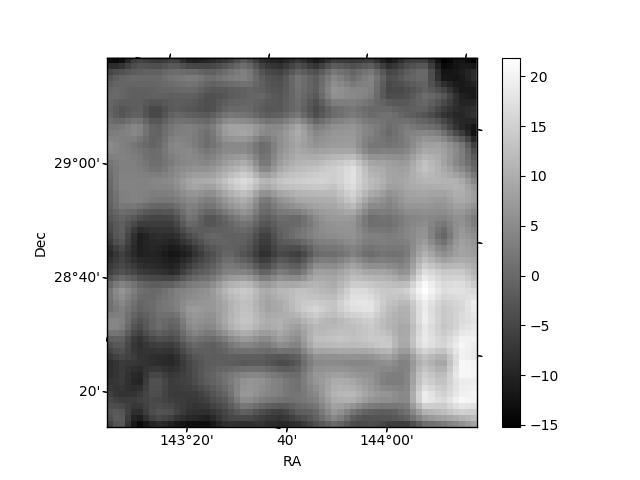
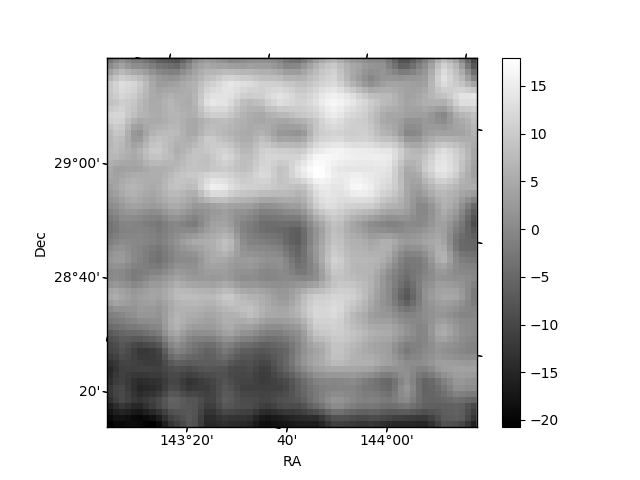
Histogram calculated using DETX and DETY for each event in the final _common_clean file
| Quadrant A | 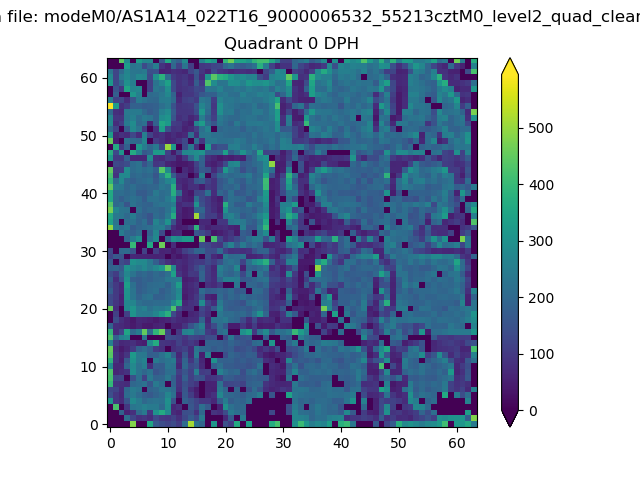 |
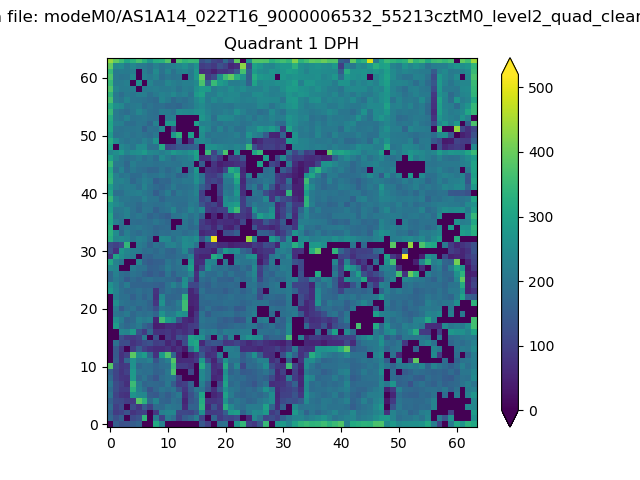 |
Quadrant B |
|---|---|---|---|
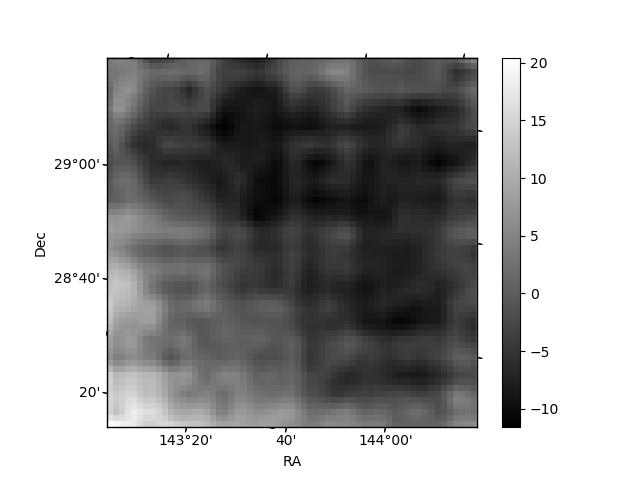
| Quadrant D | 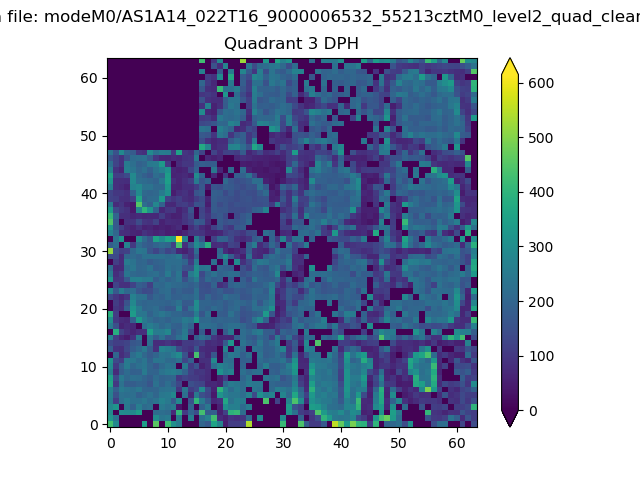 |
 |
Quadrant C |
| Plot type | Count rate plots | Images |
|---|---|---|
| Comparison with Poisson distribution Blue bars denote a histogram of data divided into 1 sec bins. Red curve is a Poisson curve with rate = median count rate of data. |
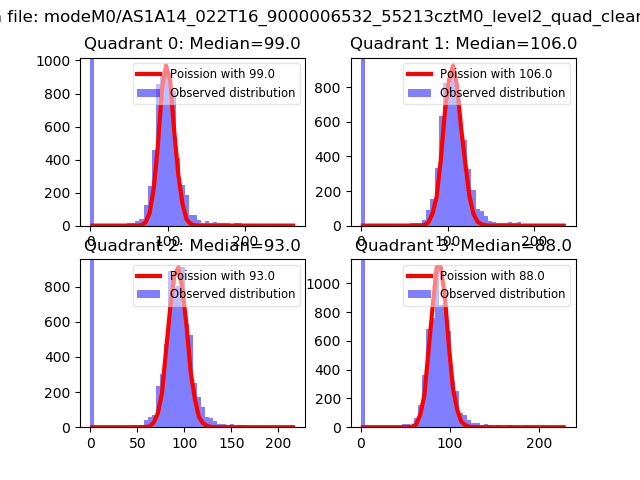 |
 |
| Quadrant-wise count rates Data is divided into 100 sec bins |
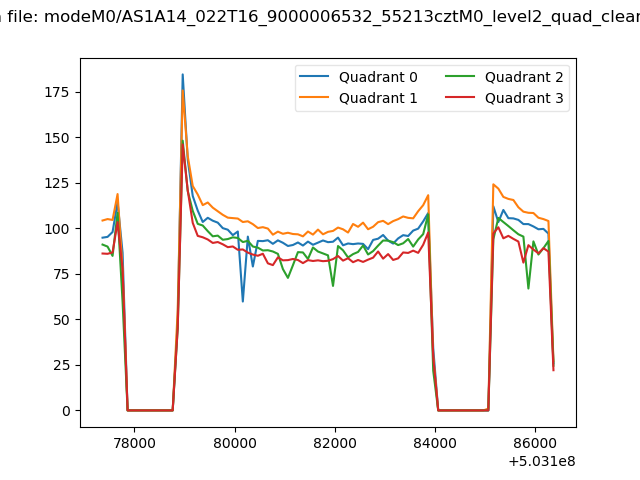 |
|
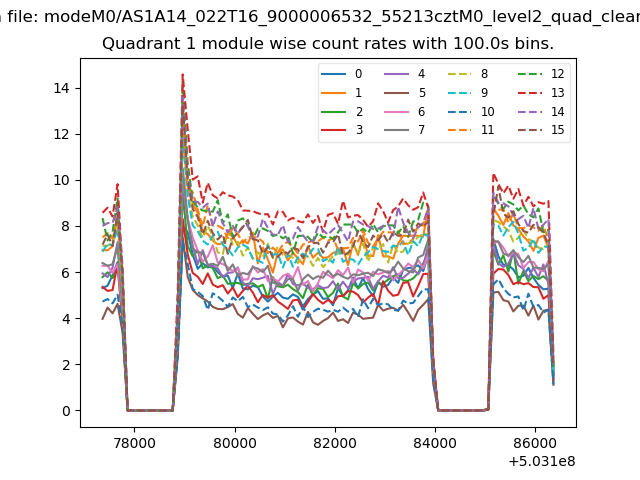
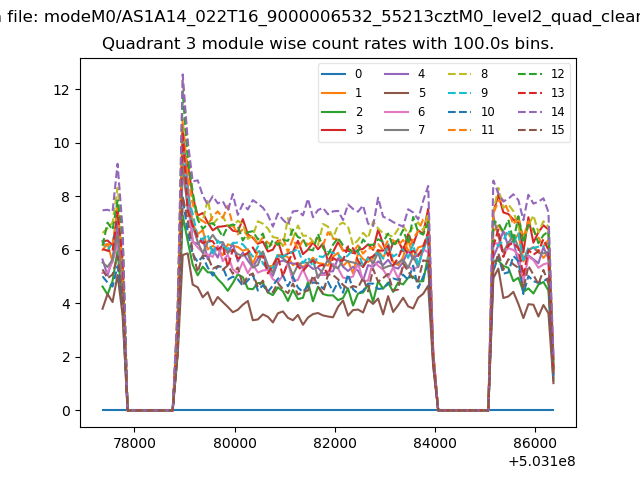
| Module-wise count rates for Quadrant A Data is divided into 100 sec bins |
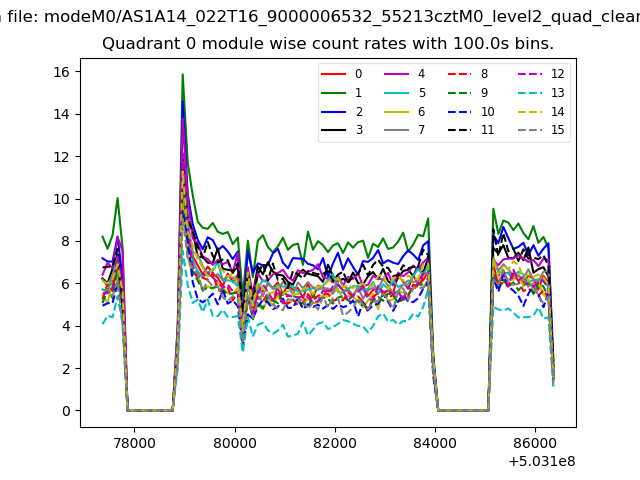 |
 |
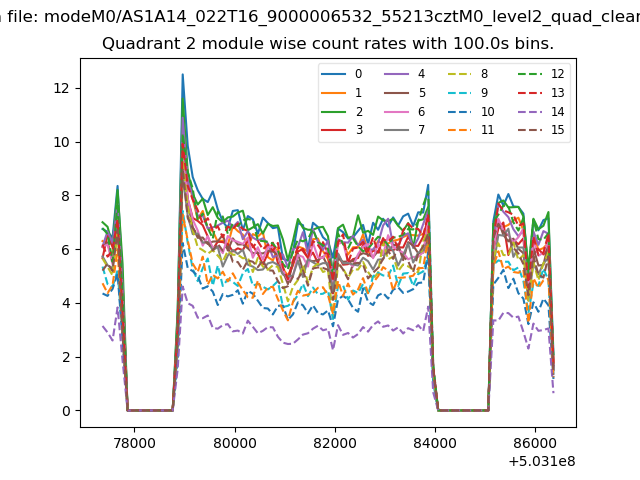
| Module-wise count rates for Quadrant B Data is divided into 100 sec bins |
 |
 |
| Module-wise count rates for Quadrant C Data is divided into 100 sec bins |
 |
 |
| Module-wise count rates for Quadrant D Data is divided into 100 sec bins |
 |
 |
| Parameter | Plot |
|---|---|
| CZT HV Monitor | 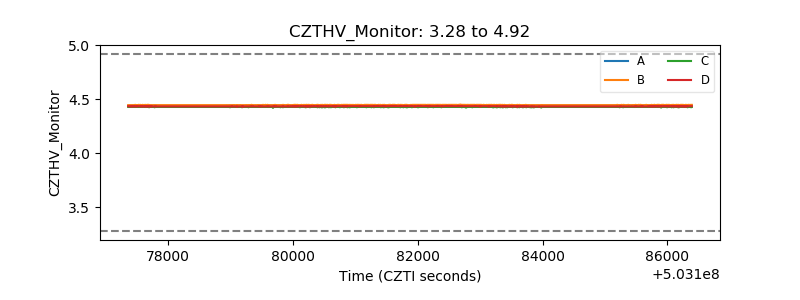 |
| D_VDD | 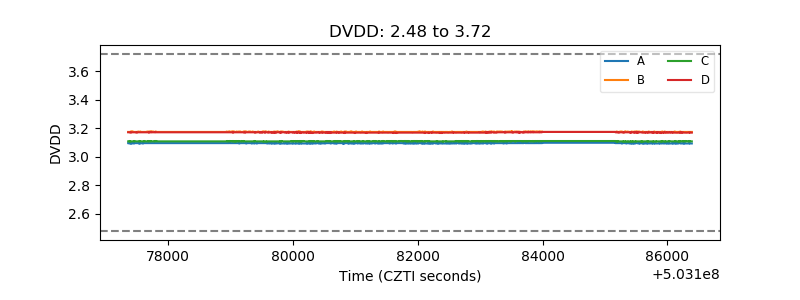 |
| Temperature 1 | 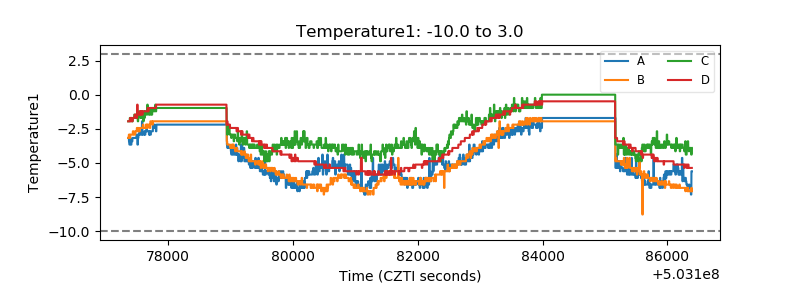 |
| Veto HV Monitor | 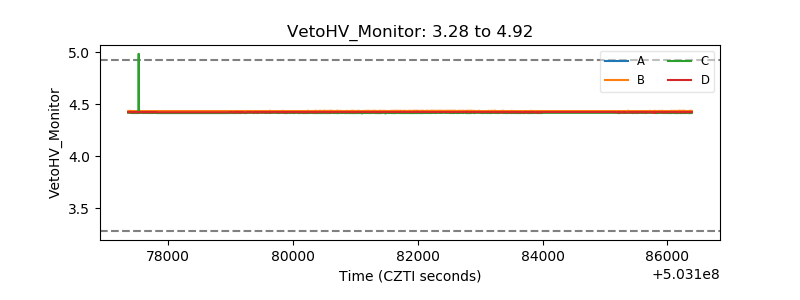 |
| Veto LLD | 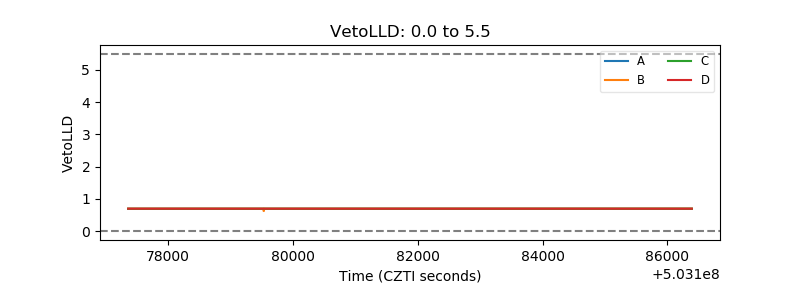 |
| Alpha Counter | 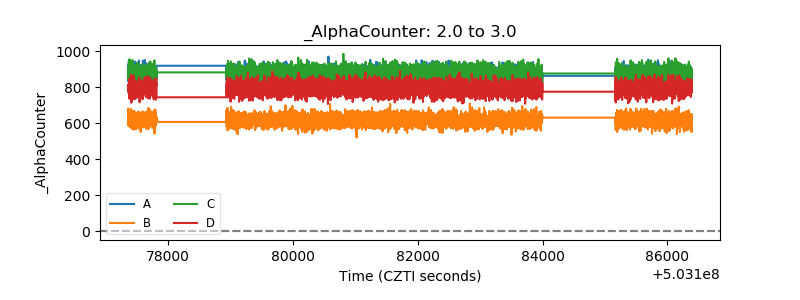 |
| _CPM_Rate | 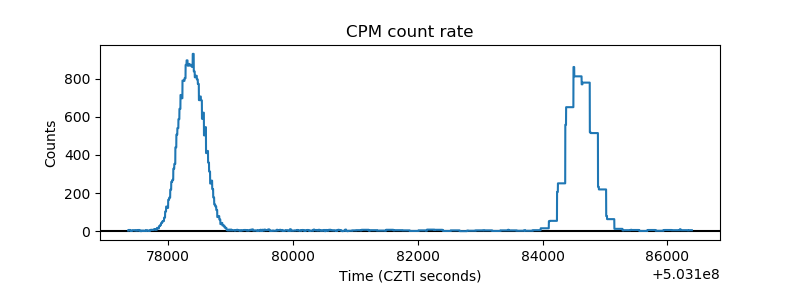 |
| CZT Counter | 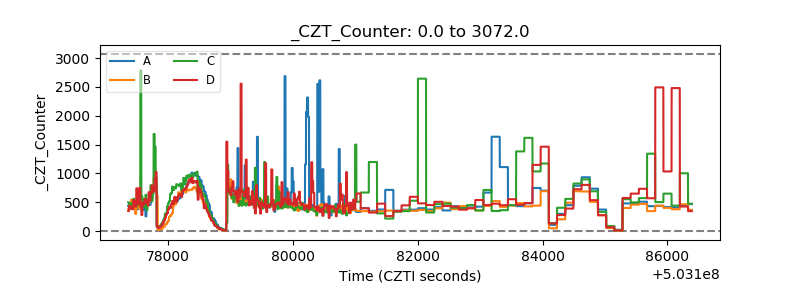 |
| +2.5 Volts monitor | 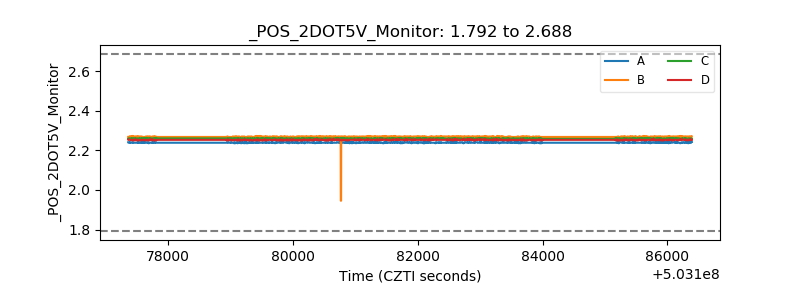 |
| +5 Volts monitor | 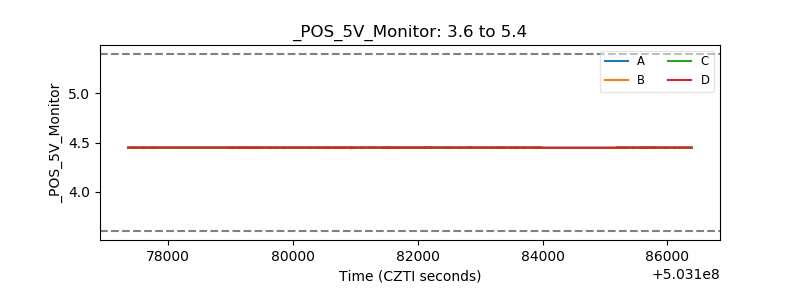 |
| _ROLL_ROT | 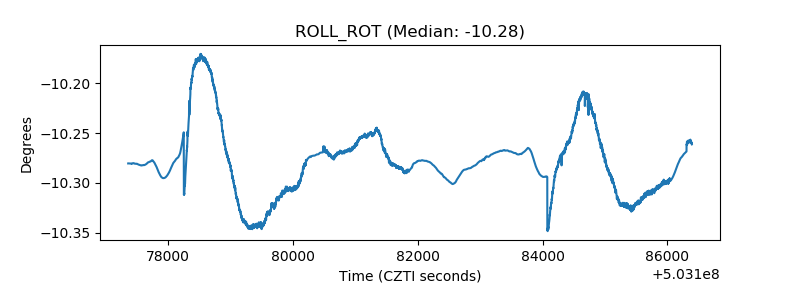 |
| _Roll_DEC | 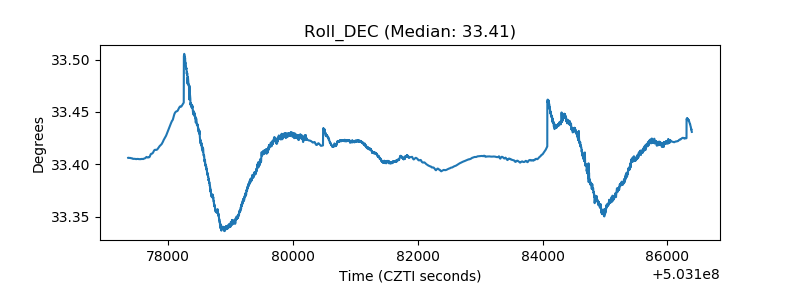 |
| _Roll_RA | 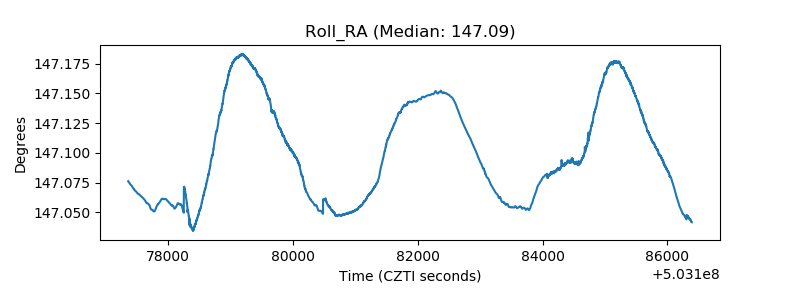 |
| Veto Counter | 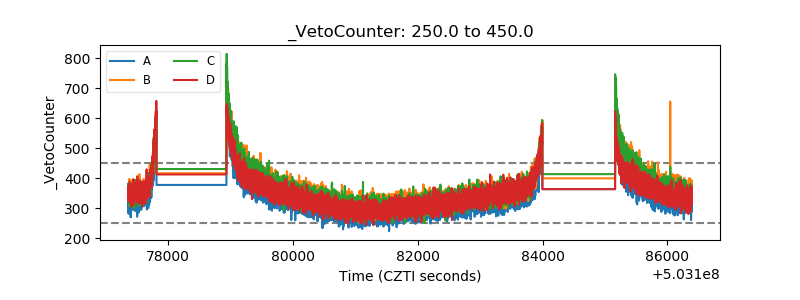 |