| Param | Original file | Final file |
|---|---|---|
| Filename | modeM0/AS1A14_022T16_9000006532_55215cztM0_level2.fits | modeM0/AS1A14_022T16_9000006532_55215cztM0_level2_quad_clean.evt |
| Size (bytes) | 499,973,760 | 97,335,360 |
| Size | 476.8 MB | 92.8 MB |
| Events in quadrant A | 3,324,341 | 651,005 |
| Events in quadrant B | 3,149,379 | 700,425 |
| Events in quadrant C | 6,377,489 | 555,597 |
| Events in quadrant D | 5,124,469 | 563,209 |
| Mode SS | |||
|---|---|---|---|
| Quadrant | BADHDUFLAG | Total packets | Discarded packets |
| A | 0 | 140 | 0 |
| B | 0 | 140 | 0 |
| C | 0 | 140 | 0 |
| D | 0 | 140 | 0 |
| Mode M0 | |||
|---|---|---|---|
| Quadrant | BADHDUFLAG | Total packets | Discarded packets |
| A | 0 | 15198 | 2 |
| B | 0 | 14719 | 2 |
| C | 0 | 23768 | 2 |
| D | 0 | 20328 | 2 |
| Mode M9 | |||
|---|---|---|---|
| Quadrant | BADHDUFLAG | Total packets | Discarded packets |
| A | 0 | 19 | 0 |
| B | 0 | 19 | 0 |
| C | 0 | 20 | 0 |
| D | 0 | 20 | 0 |
| Quadrant | Total seconds | Saturated seconds | Saturation percentage |
|---|---|---|---|
| A | 6845 | 83 | 1.212564% |
| B | 6845 | 98 | 1.431702% |
| C | 6845 | 936 | 13.674215% |
| D | 6844 | 365 | 5.333139% |
Noise dominated data is calculated using 1-second bins in cleaned event files. If a bin has >2000 counts, and if more than 50% of those come from <1% of pixels, then it is considered to be noise-dominated and hence unusable.
| Quadrant | # 1 sec bins | Bins with >0 counts | Bins with >2000 counts | High rate bins dominated by noise | Noise dominated (total time) | Noise dominated (detector-on time) | Marked lightcurve |
|---|---|---|---|---|---|---|---|
| A | 7895 | 6846 | 68 | 68 | 0.86% | 0.99% | 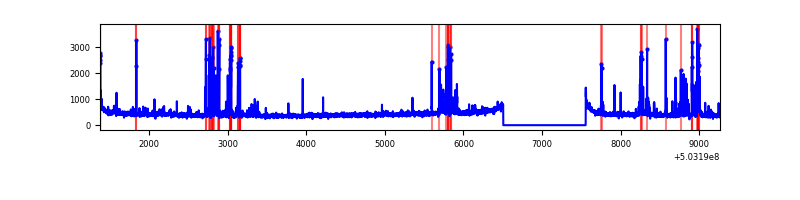 |
| B | 7895 | 6846 | 53 | 53 | 0.67% | 0.77% | 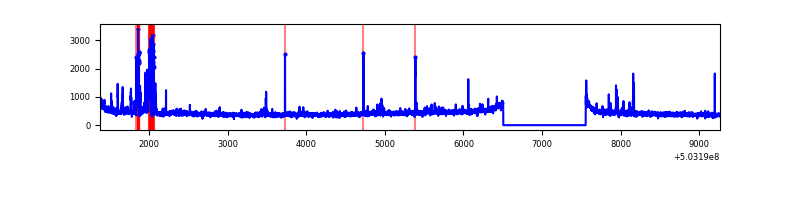 |
| C | 7895 | 6846 | 889 | 889 | 11.26% | 12.99% | 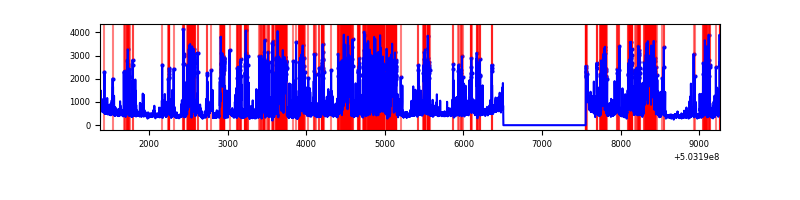 |
| D | 7894 | 6845 | 330 | 330 | 4.18% | 4.82% | 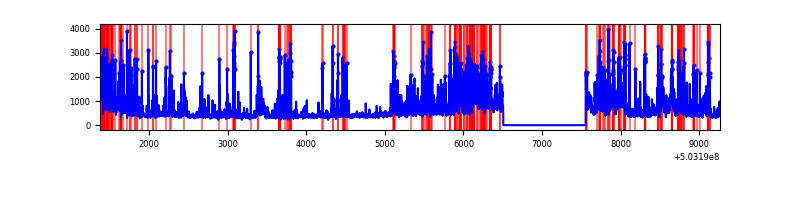 |
Top three noisy pixels from each quadrant. If the there are fewer than three noisy pixels in the level2.evt file, extra rows are filled as -1
| Pixel properties | Quadrant properties | ||||||
|---|---|---|---|---|---|---|---|
| Quadrant | DetID | PixID | Counts | Sigma | Mean | Median | Sigma |
| A | 0 | 8 | 311854 | 1757.82 | 714 | 698 | 177.0 |
| A | 5 | 241 | 84732 | 474.73 | 714 | 698 | 177.0 |
| A | 3 | 45 | 43604 | 242.39 | 714 | 698 | 177.0 |
| B | 5 | 172 | 189203 | 1218.4 | 713 | 686 | 154.7 |
| B | 4 | 81 | 56347 | 359.74 | 713 | 686 | 154.7 |
| B | 0 | 182 | 19731 | 123.09 | 713 | 686 | 154.7 |
| C | 12 | 254 | 2272969 | 12518.58 | 657 | 653 | 181.5 |
| C | 14 | 254 | 525960 | 2894.01 | 657 | 653 | 181.5 |
| C | 13 | 3 | 380666 | 2093.56 | 657 | 653 | 181.5 |
| D | 11 | 129 | 1782170 | 9267.17 | 674 | 643 | 192.2 |
| D | 2 | 249 | 412883 | 2144.39 | 674 | 643 | 192.2 |
| D | 12 | 6 | 69294 | 357.11 | 674 | 643 | 192.2 |
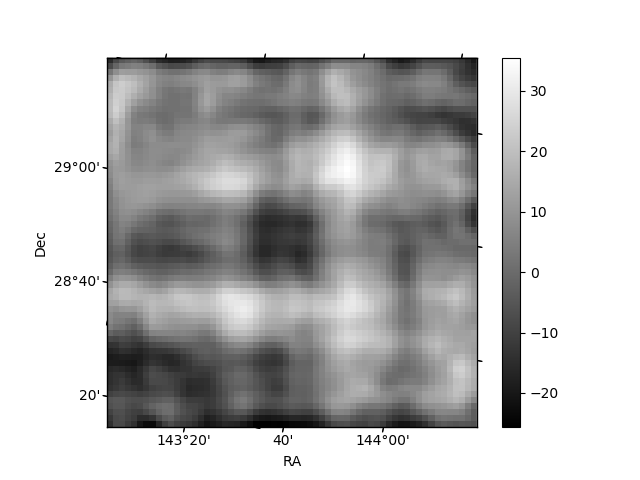
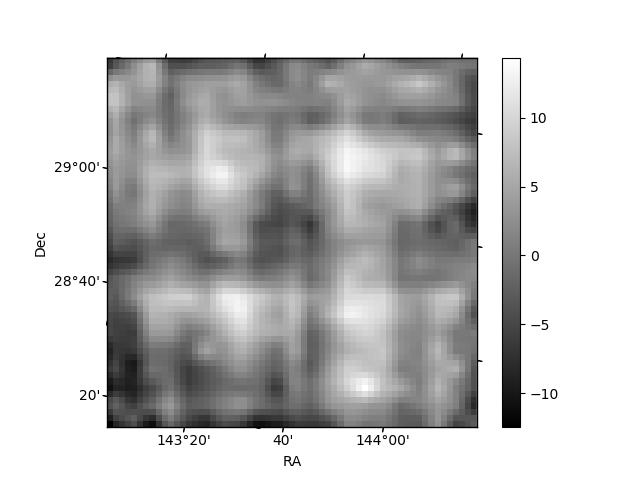
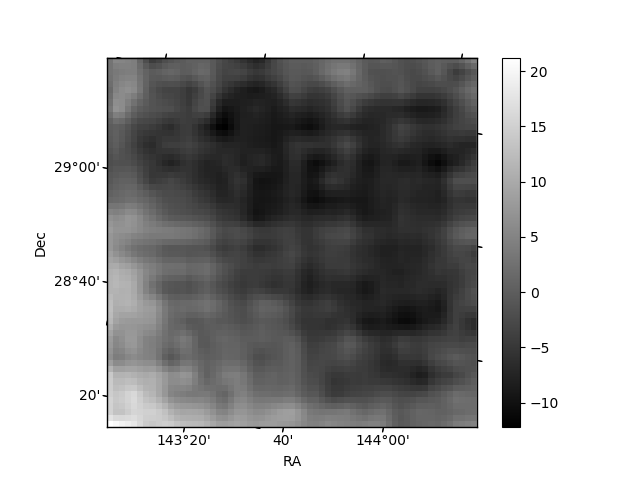
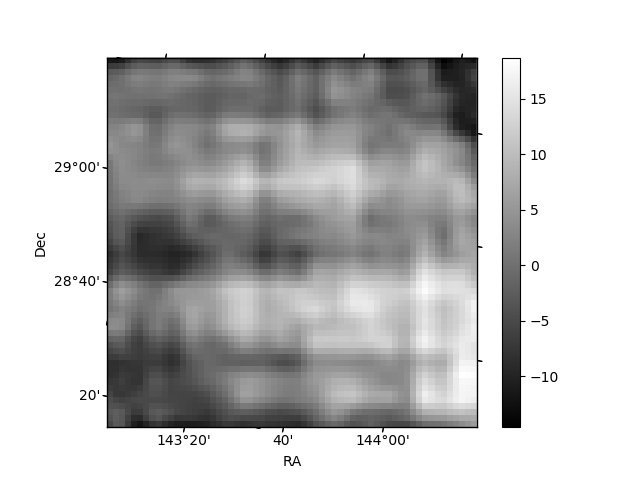
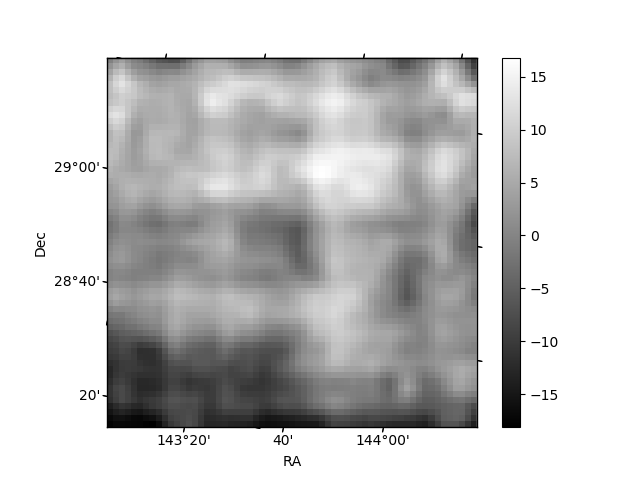
Histogram calculated using DETX and DETY for each event in the final _common_clean file
| Quadrant A | 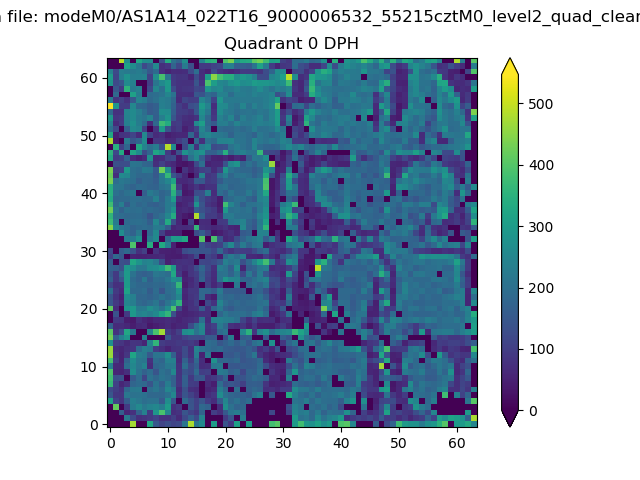 |
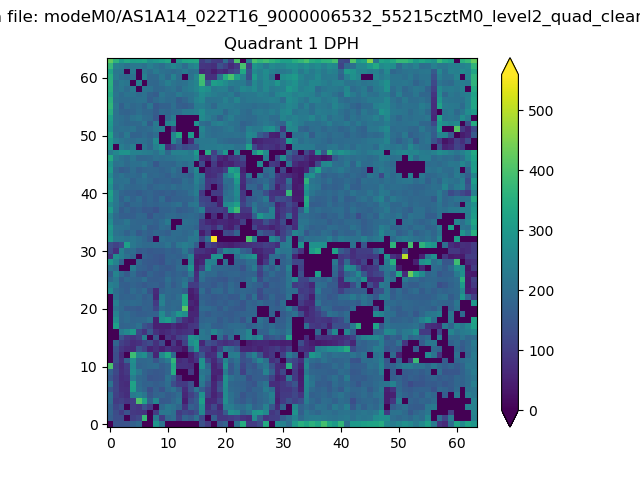 |
Quadrant B |
|---|---|---|---|
| Quadrant D |  |
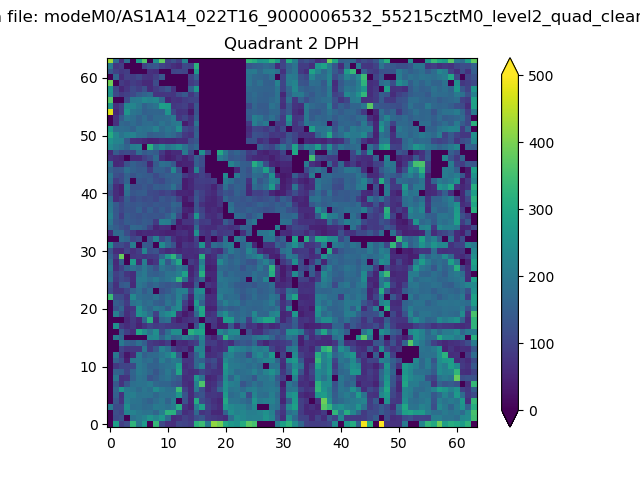 |
Quadrant C |
| Plot type | Count rate plots | Images |
|---|---|---|
| Comparison with Poisson distribution Blue bars denote a histogram of data divided into 1 sec bins. Red curve is a Poisson curve with rate = median count rate of data. |
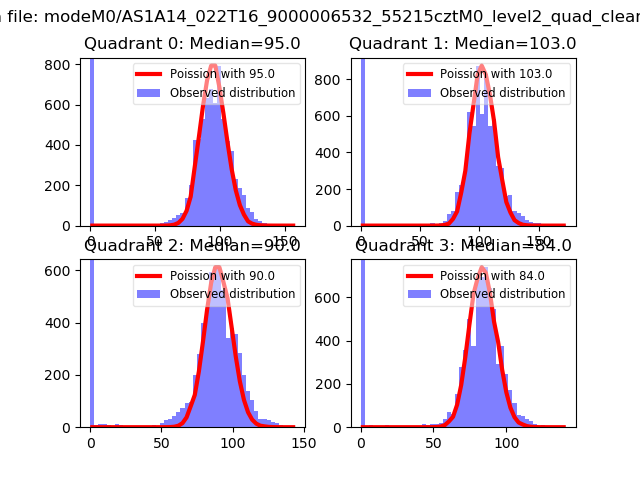 |
 |
| Quadrant-wise count rates Data is divided into 100 sec bins |
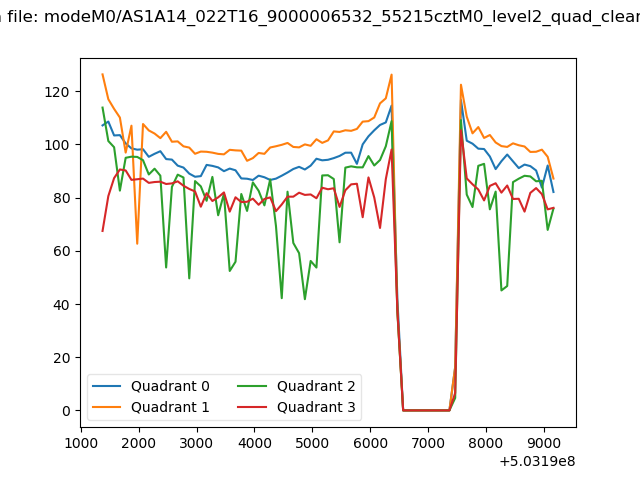 |
|
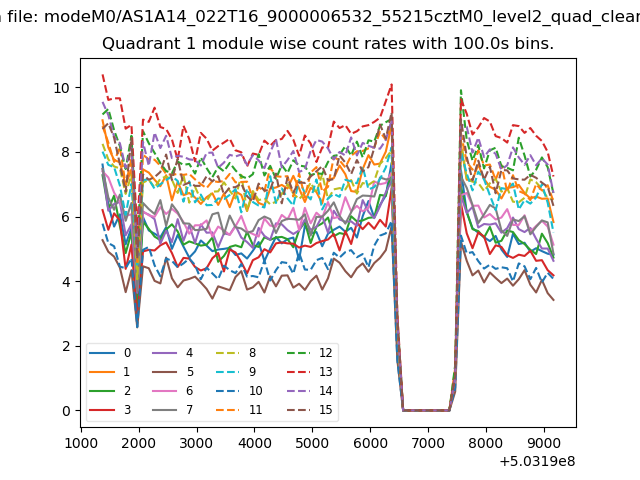
| Module-wise count rates for Quadrant A Data is divided into 100 sec bins |
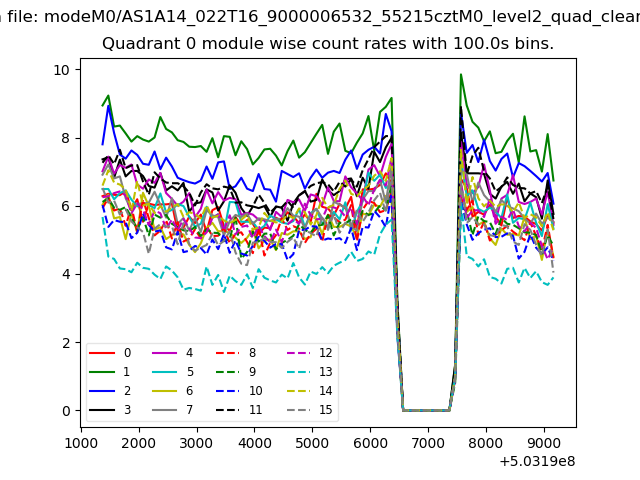 |
 |
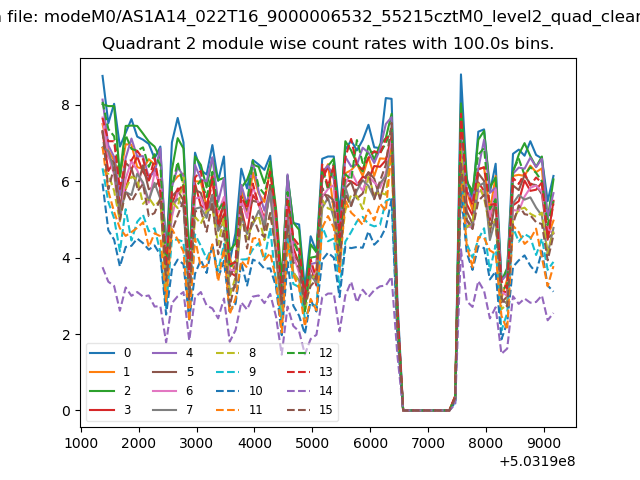
| Module-wise count rates for Quadrant B Data is divided into 100 sec bins |
 |
 |
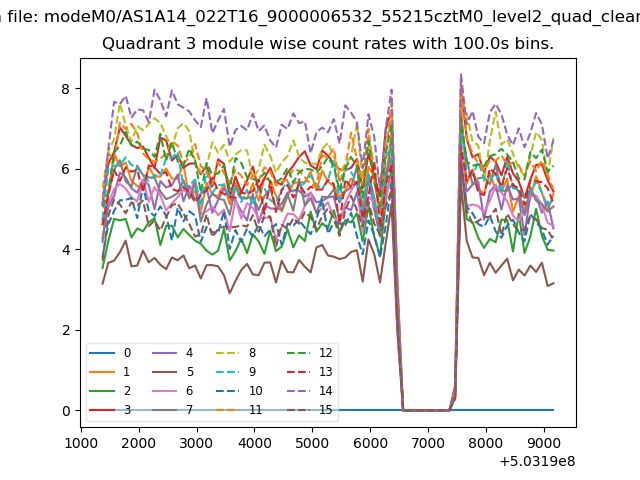
| Module-wise count rates for Quadrant C Data is divided into 100 sec bins |
 |
 |
| Module-wise count rates for Quadrant D Data is divided into 100 sec bins |
 |
 |
| Parameter | Plot |
|---|---|
| CZT HV Monitor | 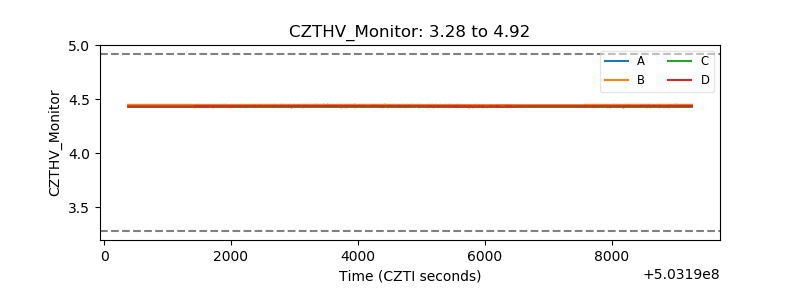 |
| D_VDD | 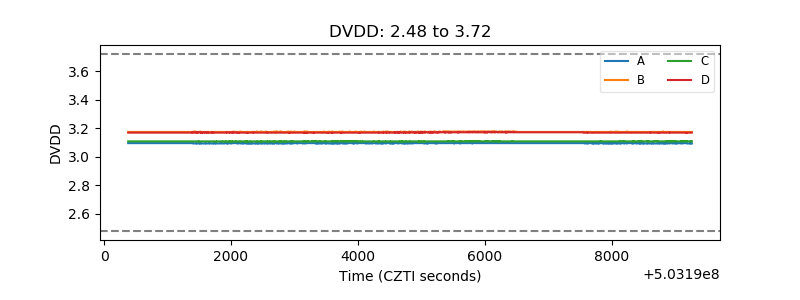 |
| Temperature 1 | 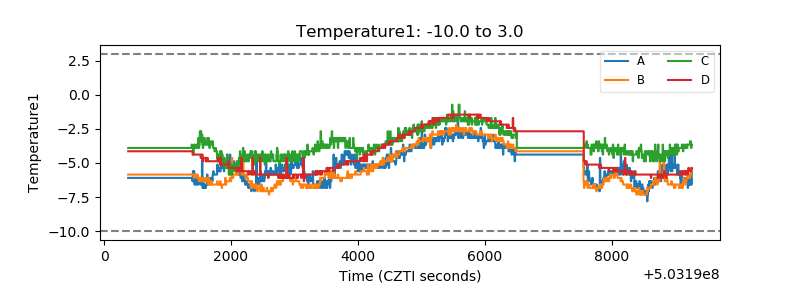 |
| Veto HV Monitor | 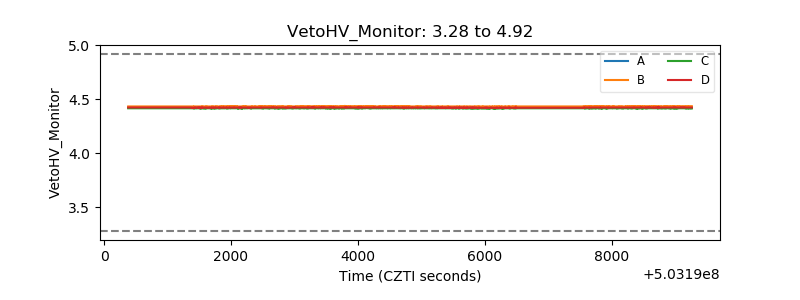 |
| Veto LLD | 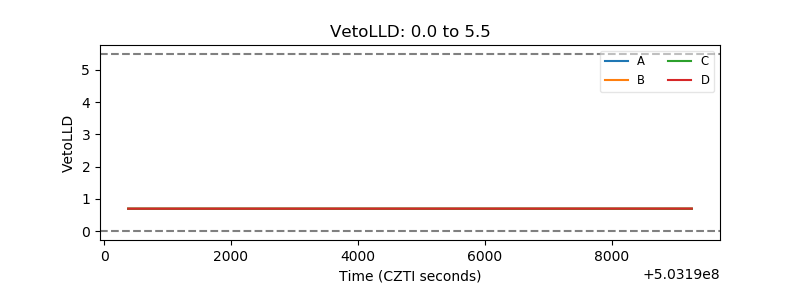 |
| Alpha Counter | 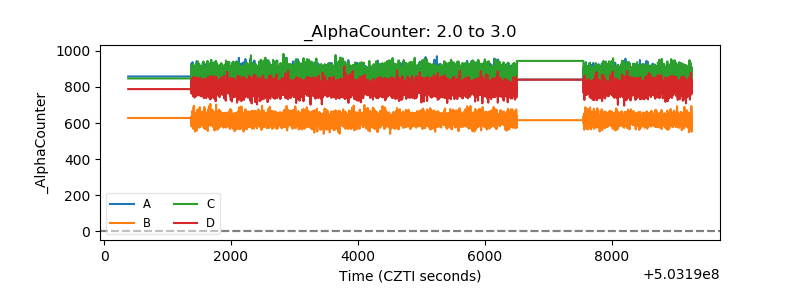 |
| _CPM_Rate | 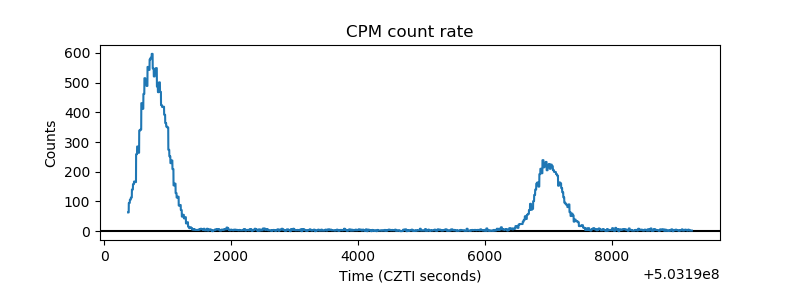 |
| CZT Counter | 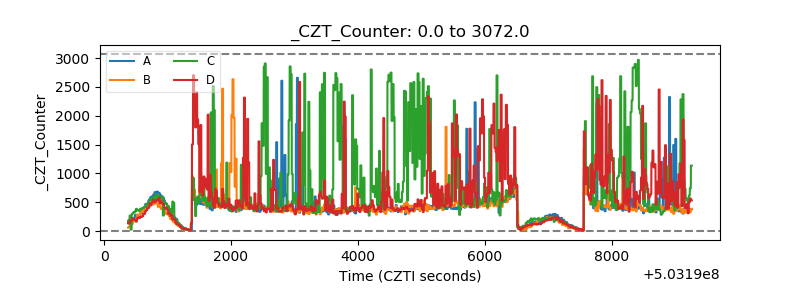 |
| +2.5 Volts monitor |  |
| +5 Volts monitor |  |
| _ROLL_ROT | 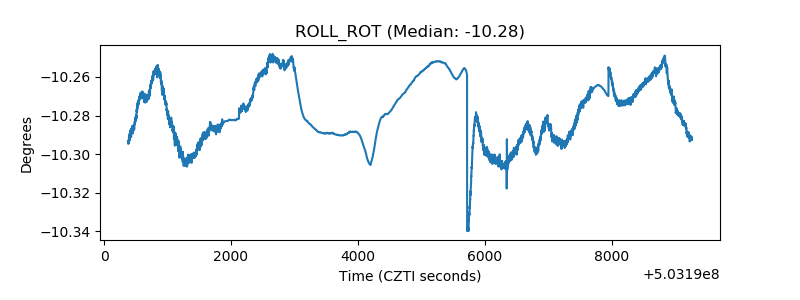 |
| _Roll_DEC | 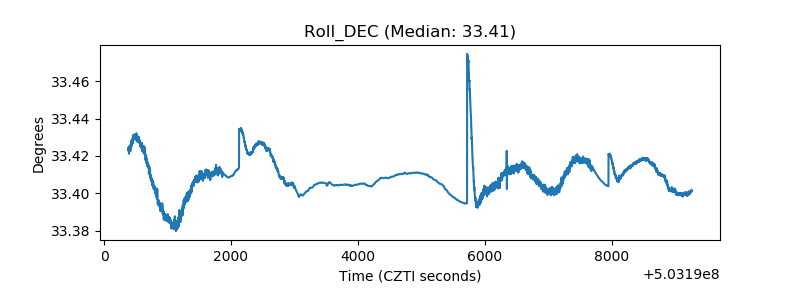 |
| _Roll_RA | 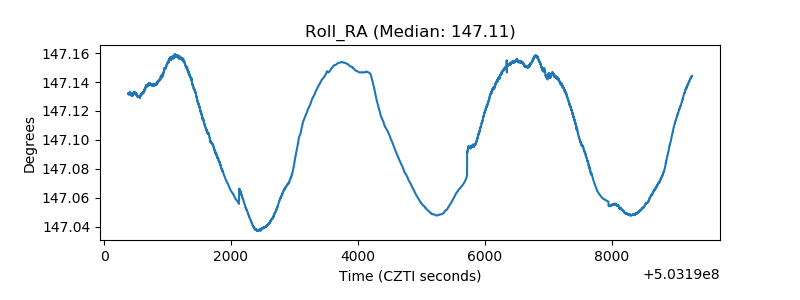 |
| Veto Counter | 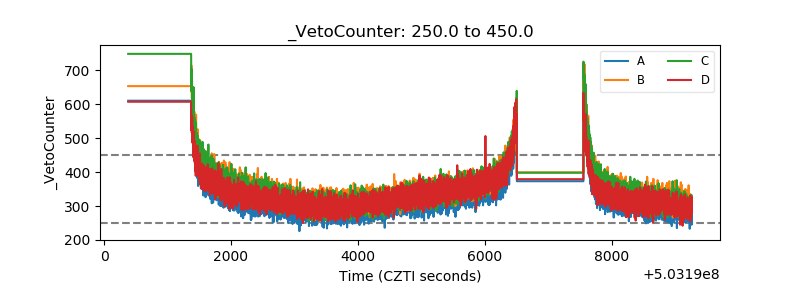 |