| Param | Original file | Final file |
|---|---|---|
| Filename | modeM0/AS1A14_022T16_9000006532_55217cztM0_level2.fits | modeM0/AS1A14_022T16_9000006532_55217cztM0_level2_quad_clean.evt |
| Size (bytes) | 519,102,720 | 113,175,360 |
| Size | 495.1 MB | 107.9 MB |
| Events in quadrant A | 3,757,941 | 745,016 |
| Events in quadrant B | 3,730,450 | 784,380 |
| Events in quadrant C | 5,497,635 | 688,740 |
| Events in quadrant D | 5,608,441 | 653,877 |
| Mode SS | |||
|---|---|---|---|
| Quadrant | BADHDUFLAG | Total packets | Discarded packets |
| A | 0 | 160 | 0 |
| B | 0 | 160 | 0 |
| C | 0 | 160 | 0 |
| D | 0 | 160 | 0 |
| Mode M0 | |||
|---|---|---|---|
| Quadrant | BADHDUFLAG | Total packets | Discarded packets |
| A | 0 | 17317 | 2 |
| B | 0 | 17436 | 2 |
| C | 0 | 22095 | 2 |
| D | 0 | 22560 | 2 |
| Mode M9 | |||
|---|---|---|---|
| Quadrant | BADHDUFLAG | Total packets | Discarded packets |
| A | 0 | 6 | 0 |
| B | 0 | 7 | 0 |
| C | 0 | 7 | 0 |
| D | 0 | 7 | 0 |
| Quadrant | Total seconds | Saturated seconds | Saturation percentage |
|---|---|---|---|
| A | 7989 | 196 | 2.453373% |
| B | 7989 | 346 | 4.330955% |
| C | 7989 | 486 | 6.083365% |
| D | 7989 | 438 | 5.482538% |
Noise dominated data is calculated using 1-second bins in cleaned event files. If a bin has >2000 counts, and if more than 50% of those come from <1% of pixels, then it is considered to be noise-dominated and hence unusable.
| Quadrant | # 1 sec bins | Bins with >0 counts | Bins with >2000 counts | High rate bins dominated by noise | Noise dominated (total time) | Noise dominated (detector-on time) | Marked lightcurve |
|---|---|---|---|---|---|---|---|
| A | 8029 | 7990 | 15 | 15 | 0.19% | 0.19% |  |
| B | 8029 | 7990 | 41 | 41 | 0.51% | 0.51% | 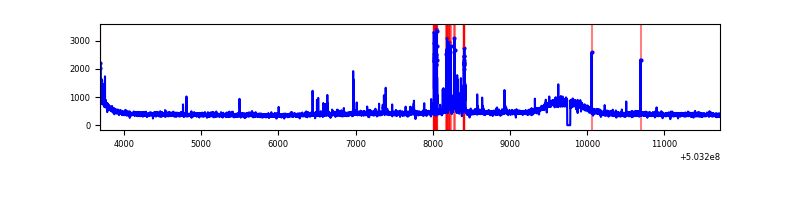 |
| C | 8029 | 7990 | 401 | 401 | 4.99% | 5.02% | 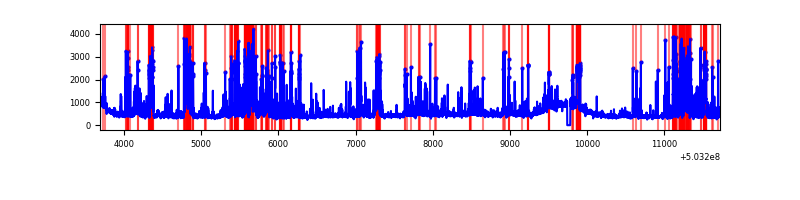 |
| D | 8029 | 7990 | 355 | 355 | 4.42% | 4.44% | 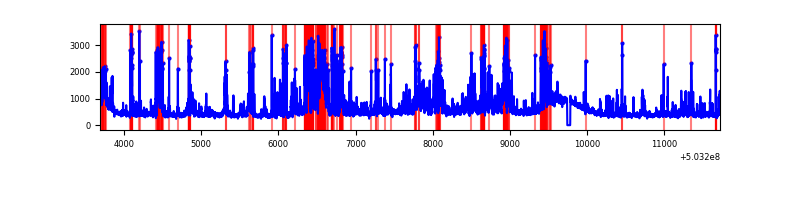 |
Top three noisy pixels from each quadrant. If the there are fewer than three noisy pixels in the level2.evt file, extra rows are filled as -1
| Pixel properties | Quadrant properties | ||||||
|---|---|---|---|---|---|---|---|
| Quadrant | DetID | PixID | Counts | Sigma | Mean | Median | Sigma |
| A | 0 | 8 | 103516 | 473.73 | 882 | 859 | 216.7 |
| A | 4 | 205 | 80075 | 365.56 | 882 | 859 | 216.7 |
| A | 3 | 14 | 40122 | 181.19 | 882 | 859 | 216.7 |
| B | 2 | 249 | 207667 | 1104.7 | 864 | 831 | 187.2 |
| B | 5 | 185 | 42219 | 221.05 | 864 | 831 | 187.2 |
| B | 12 | 111 | 23673 | 122.0 | 864 | 831 | 187.2 |
| C | 12 | 254 | 1060490 | 4642.18 | 831 | 824 | 228.3 |
| C | 13 | 3 | 373338 | 1631.91 | 831 | 824 | 228.3 |
| C | 14 | 254 | 309952 | 1354.23 | 831 | 824 | 228.3 |
| D | 11 | 129 | 1205707 | 5137.41 | 835 | 800 | 234.5 |
| D | 2 | 172 | 576797 | 2455.9 | 835 | 800 | 234.5 |
| D | 2 | 249 | 254376 | 1081.18 | 835 | 800 | 234.5 |
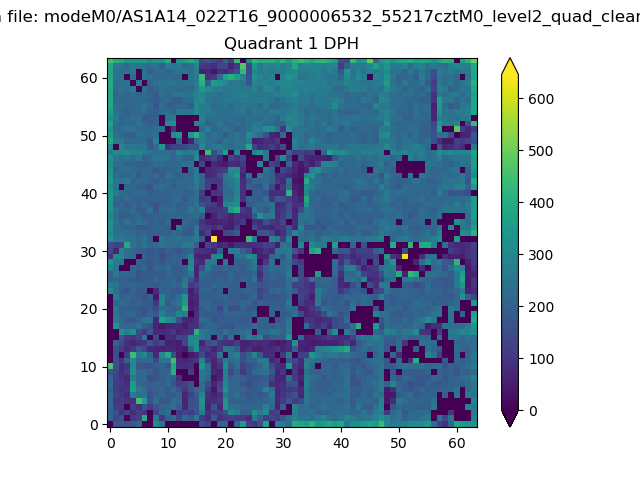
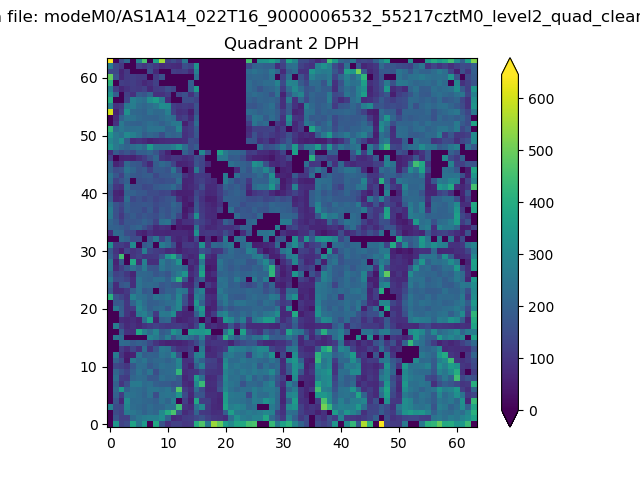
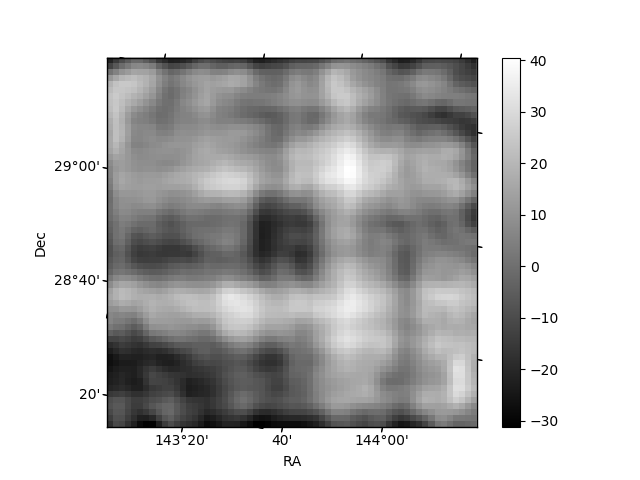
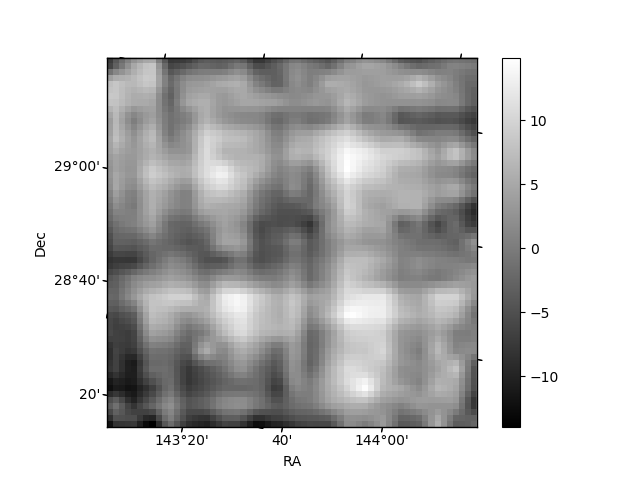
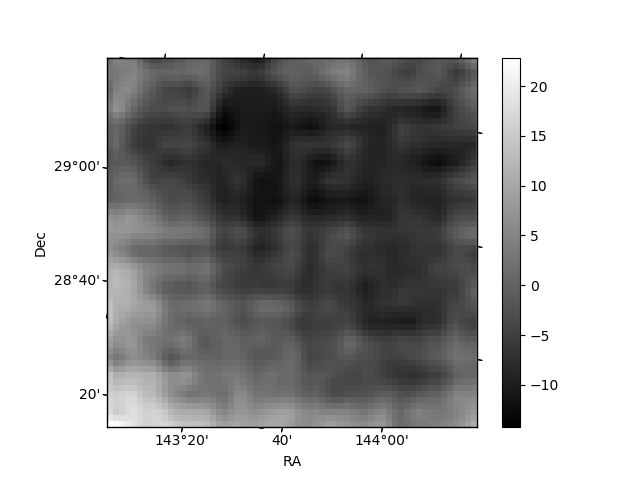
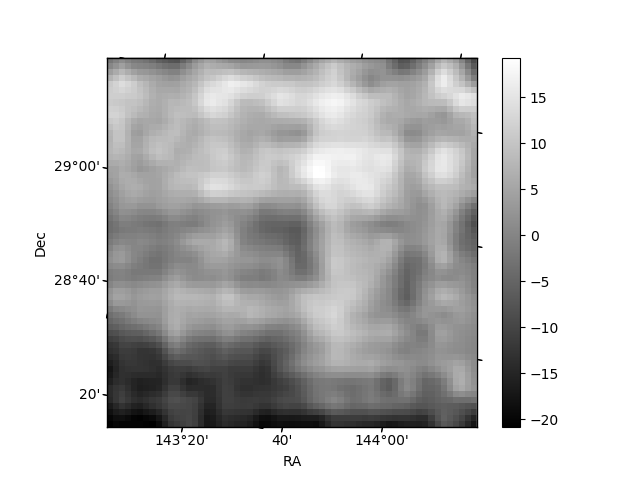
Histogram calculated using DETX and DETY for each event in the final _common_clean file
| Quadrant A | 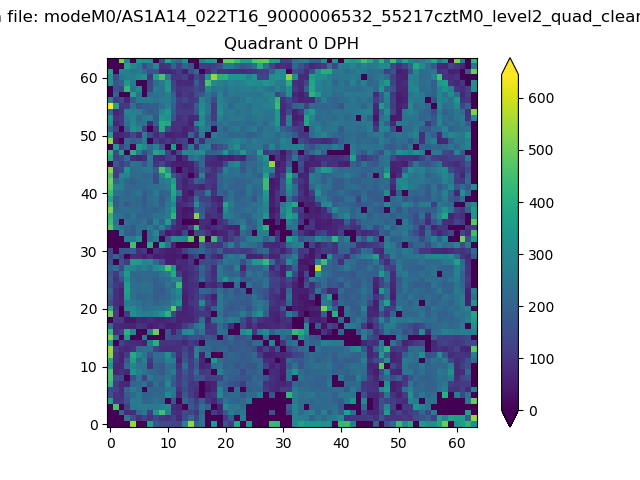 |
 |
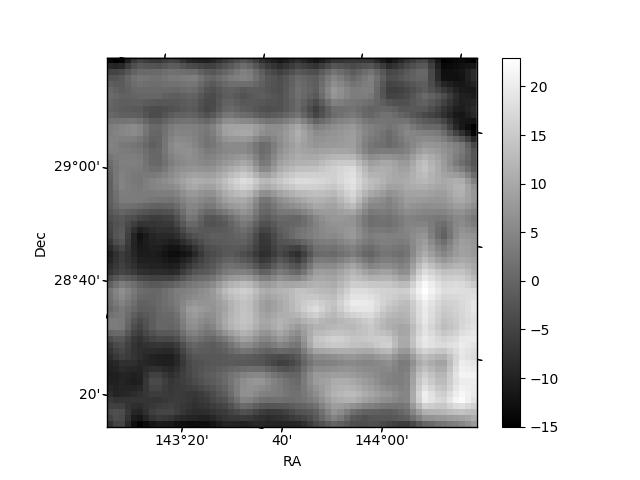
Quadrant B |
|---|---|---|---|
| Quadrant D | 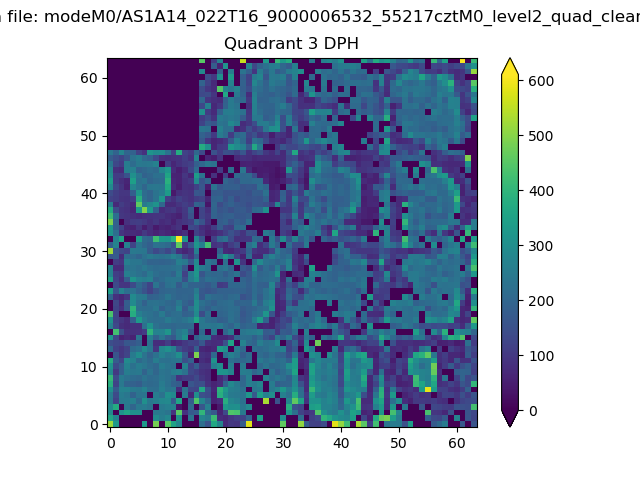 |
 |
Quadrant C |
| Plot type | Count rate plots | Images |
|---|---|---|
| Comparison with Poisson distribution Blue bars denote a histogram of data divided into 1 sec bins. Red curve is a Poisson curve with rate = median count rate of data. |
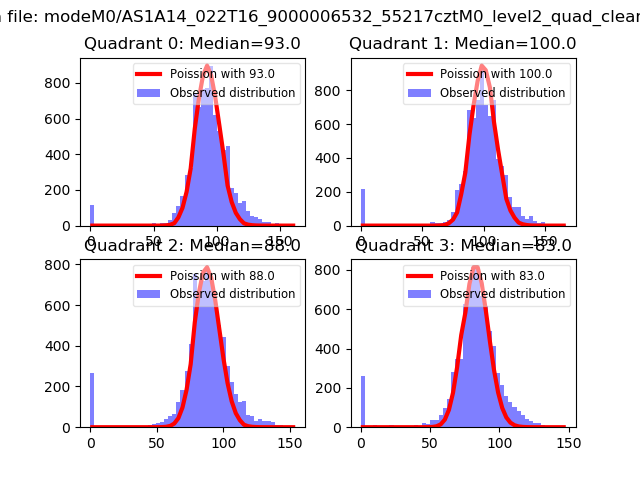 |
 |
| Quadrant-wise count rates Data is divided into 100 sec bins |
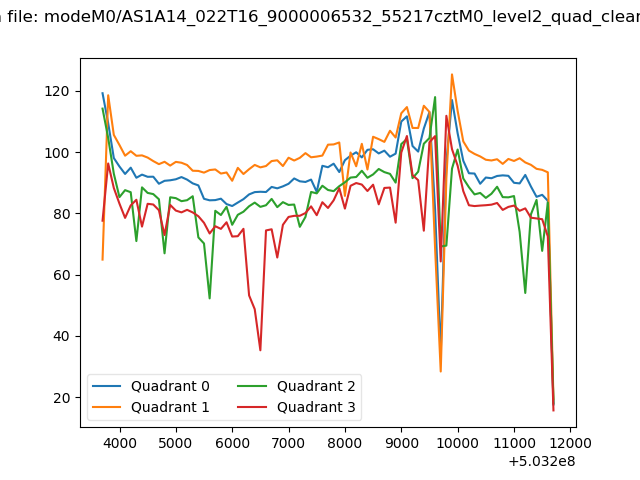 |
|
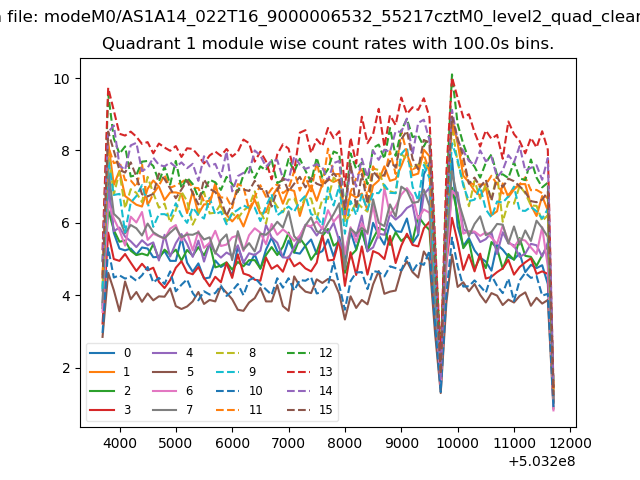
| Module-wise count rates for Quadrant A Data is divided into 100 sec bins |
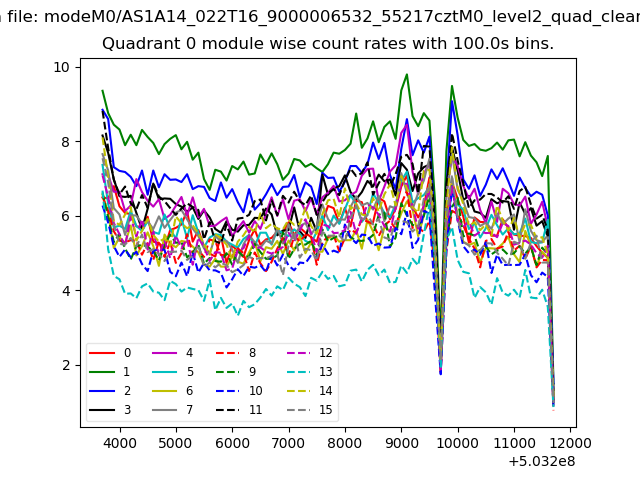 |
 |
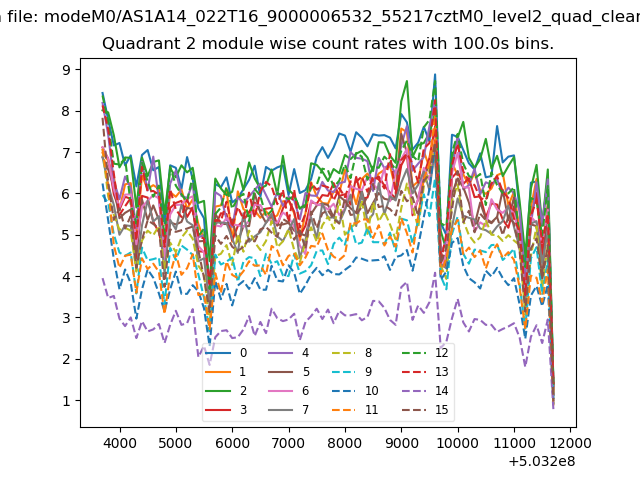
| Module-wise count rates for Quadrant B Data is divided into 100 sec bins |
 |
 |
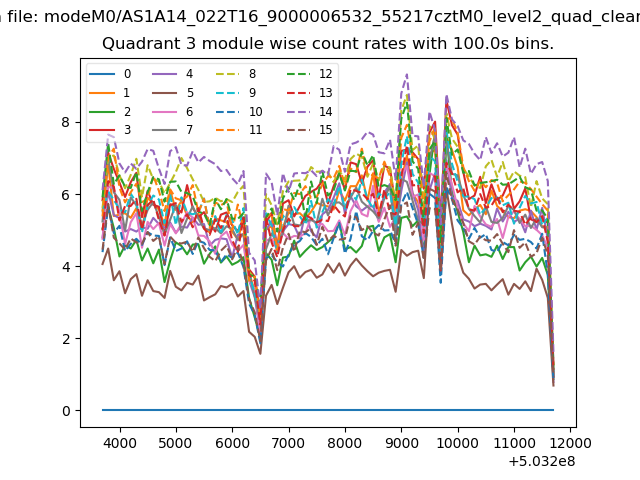
| Module-wise count rates for Quadrant C Data is divided into 100 sec bins |
 |
 |
| Module-wise count rates for Quadrant D Data is divided into 100 sec bins |
 |
 |
| Parameter | Plot |
|---|---|
| CZT HV Monitor | 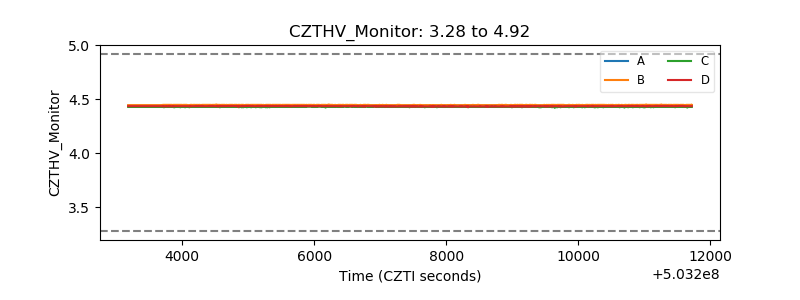 |
| D_VDD | 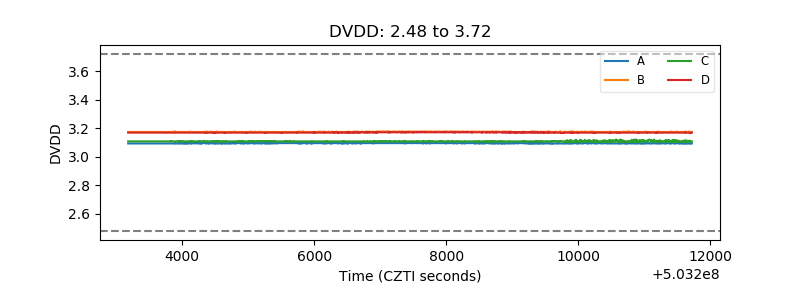 |
| Temperature 1 | 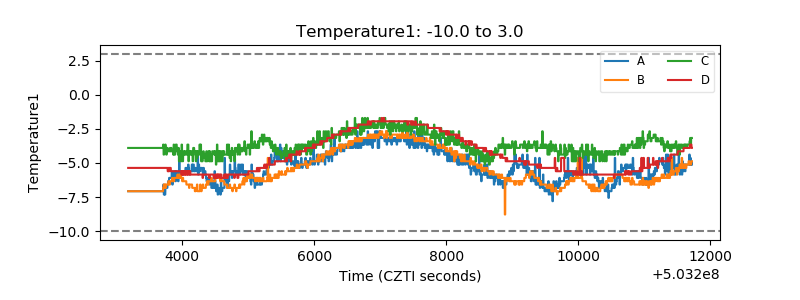 |
| Veto HV Monitor | 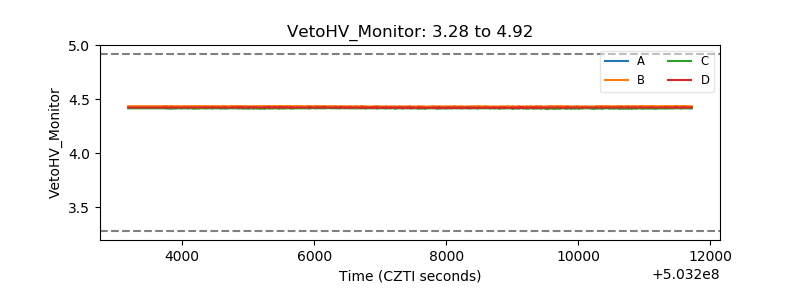 |
| Veto LLD | 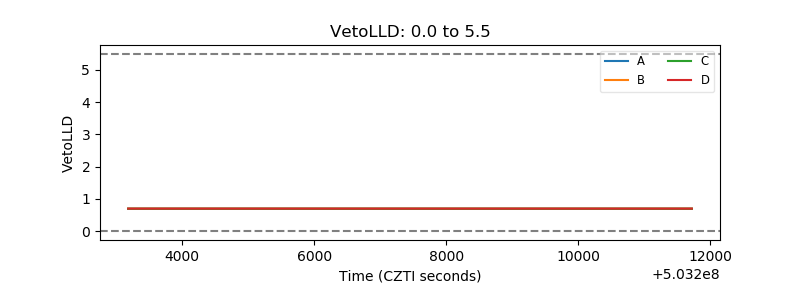 |
| Alpha Counter | 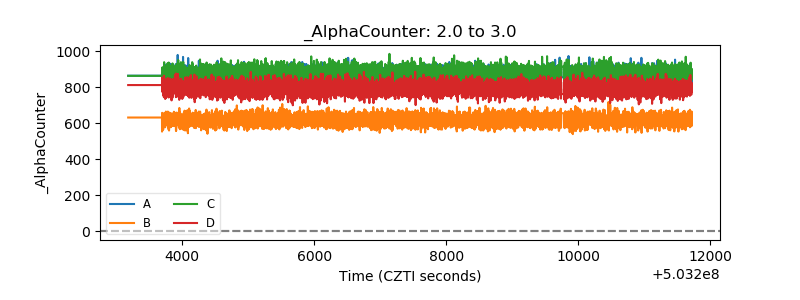 |
| _CPM_Rate | 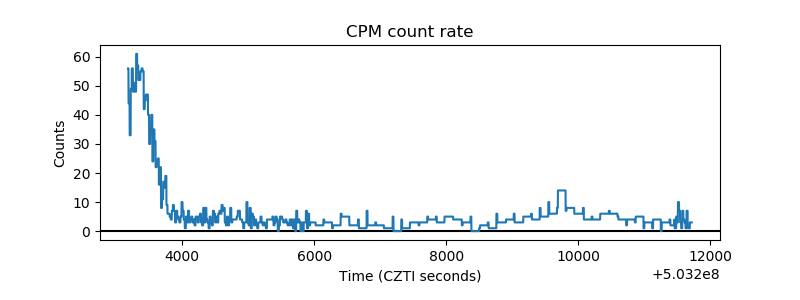 |
| CZT Counter | 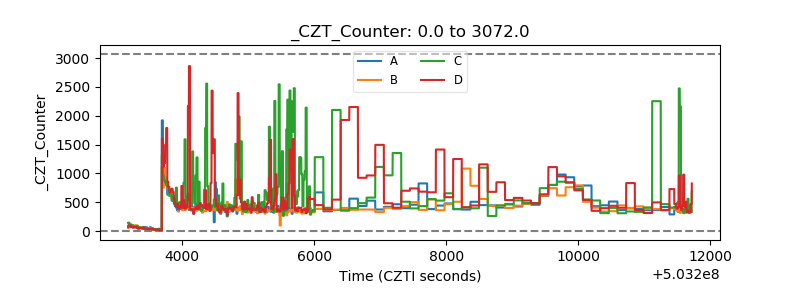 |
| +2.5 Volts monitor |  |
| +5 Volts monitor |  |
| _ROLL_ROT | 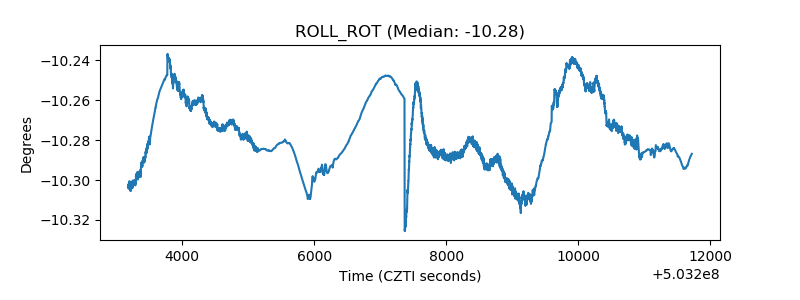 |
| _Roll_DEC | 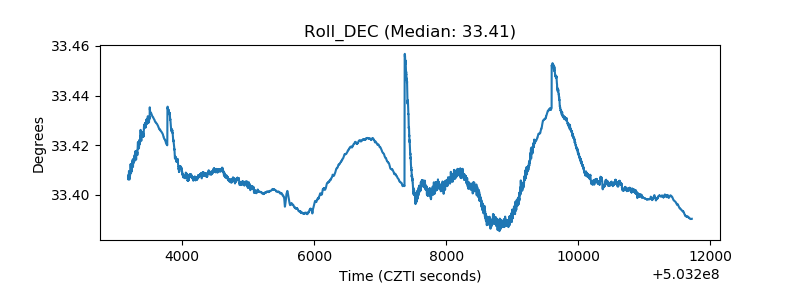 |
| _Roll_RA | 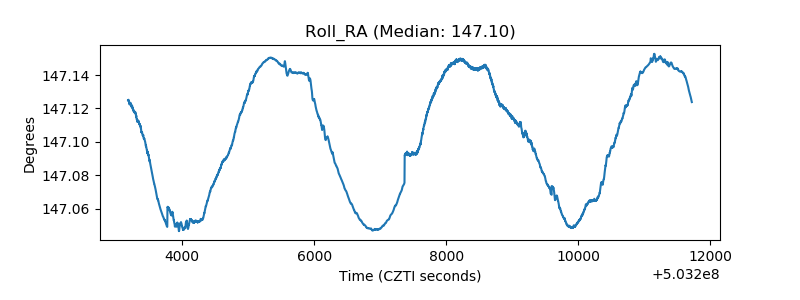 |
| Veto Counter | 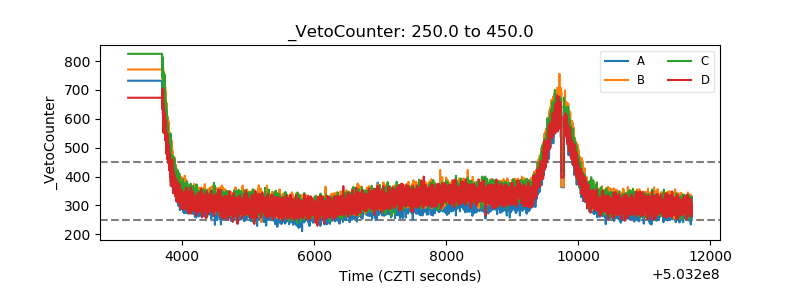 |