| Param | Original file | Final file |
|---|---|---|
| Filename | modeM0/AS1A14_009T01_9000006534_55219cztM0_level2.fits | modeM0/AS1A14_009T01_9000006534_55219cztM0_level2_quad_clean.evt |
| Size (bytes) | 585,357,120 | 116,807,040 |
| Size | 558.2 MB | 111.4 MB |
| Events in quadrant A | 3,998,039 | 763,102 |
| Events in quadrant B | 3,682,374 | 828,721 |
| Events in quadrant C | 6,787,642 | 691,795 |
| Events in quadrant D | 6,550,914 | 671,928 |
| Mode SS | |||
|---|---|---|---|
| Quadrant | BADHDUFLAG | Total packets | Discarded packets |
| A | 0 | 168 | 0 |
| B | 0 | 168 | 0 |
| C | 0 | 168 | 0 |
| D | 0 | 168 | 0 |
| Mode M0 | |||
|---|---|---|---|
| Quadrant | BADHDUFLAG | Total packets | Discarded packets |
| A | 0 | 18214 | 2 |
| B | 0 | 17400 | 3 |
| C | 0 | 26154 | 24 |
| D | 0 | 25309 | 0 |
| Quadrant | Total seconds | Saturated seconds | Saturation percentage |
|---|---|---|---|
| A | 8367 | 68 | 0.812717% |
| B | 8365 | 36 | 0.430365% |
| C | 8360 | 751 | 8.983254% |
| D | 8367 | 452 | 5.402175% |
Noise dominated data is calculated using 1-second bins in cleaned event files. If a bin has >2000 counts, and if more than 50% of those come from <1% of pixels, then it is considered to be noise-dominated and hence unusable.
| Quadrant | # 1 sec bins | Bins with >0 counts | Bins with >2000 counts | High rate bins dominated by noise | Noise dominated (total time) | Noise dominated (detector-on time) | Marked lightcurve |
|---|---|---|---|---|---|---|---|
| A | 8368 | 8368 | 48 | 48 | 0.57% | 0.57% | 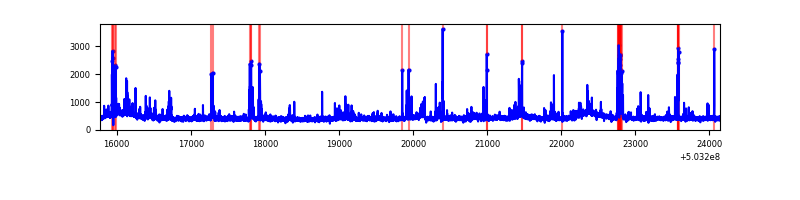 |
| B | 8367 | 8366 | 16 | 16 | 0.19% | 0.19% | 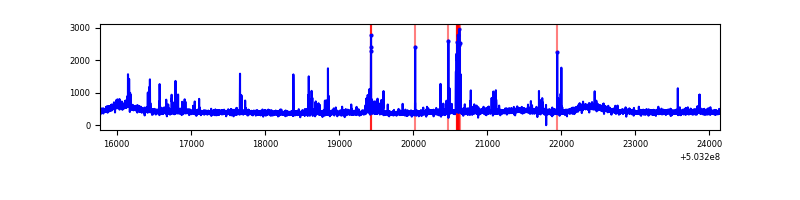 |
| C | 8367 | 8364 | 620 | 620 | 7.41% | 7.41% | 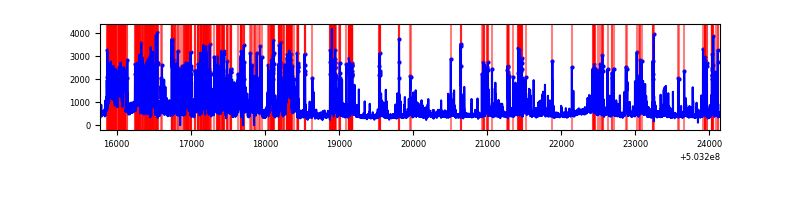 |
| D | 8367 | 8367 | 468 | 468 | 5.59% | 5.59% | 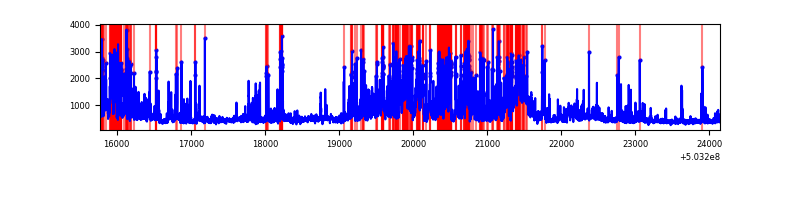 |
Top three noisy pixels from each quadrant. If the there are fewer than three noisy pixels in the level2.evt file, extra rows are filled as -1
| Pixel properties | Quadrant properties | ||||||
|---|---|---|---|---|---|---|---|
| Quadrant | DetID | PixID | Counts | Sigma | Mean | Median | Sigma |
| A | 4 | 205 | 277748 | 1283.56 | 875 | 850 | 215.7 |
| A | 3 | 45 | 98376 | 452.08 | 875 | 850 | 215.7 |
| A | 0 | 8 | 68929 | 315.58 | 875 | 850 | 215.7 |
| B | 2 | 249 | 65992 | 346.16 | 873 | 838 | 188.2 |
| B | 0 | 182 | 60139 | 315.06 | 873 | 838 | 188.2 |
| B | 10 | 247 | 52585 | 274.93 | 873 | 838 | 188.2 |
| C | 12 | 254 | 2217484 | 9644.92 | 834 | 825 | 229.8 |
| C | 12 | 2 | 418513 | 1817.41 | 834 | 825 | 229.8 |
| C | 13 | 3 | 301990 | 1310.4 | 834 | 825 | 229.8 |
| D | 2 | 249 | 997966 | 4251.86 | 836 | 798 | 234.5 |
| D | 15 | 42 | 783217 | 3336.19 | 836 | 798 | 234.5 |
| D | 11 | 129 | 711074 | 3028.57 | 836 | 798 | 234.5 |
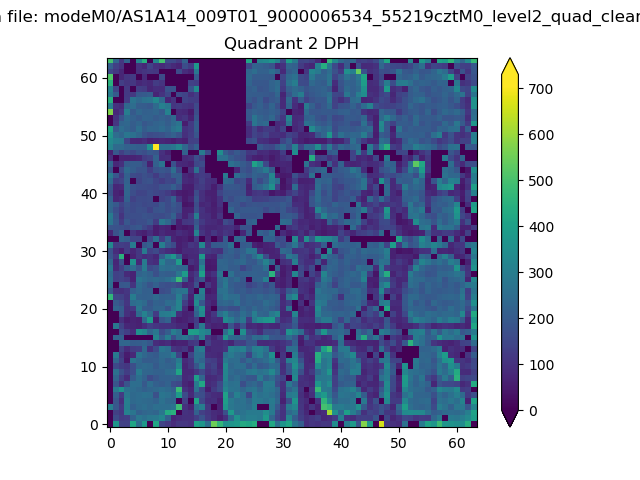
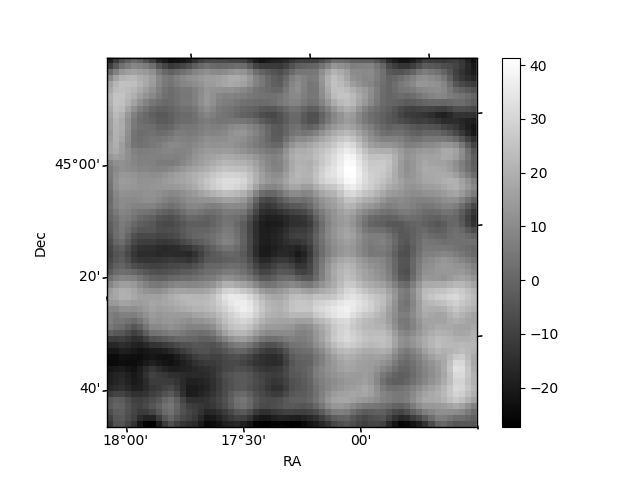
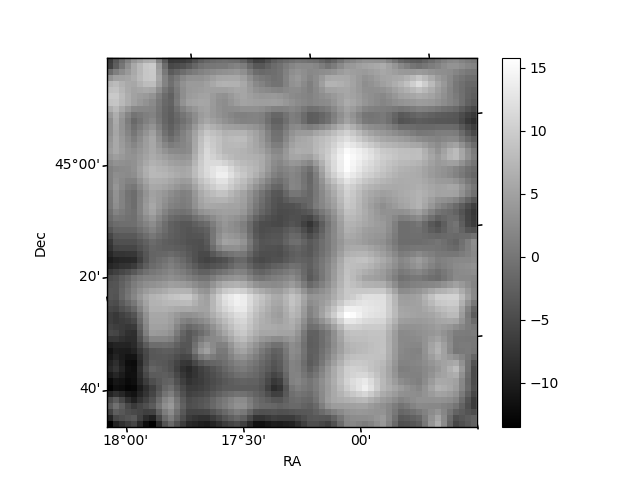
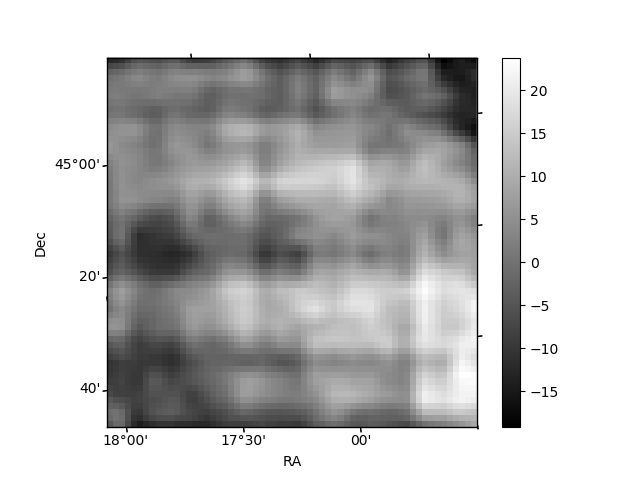
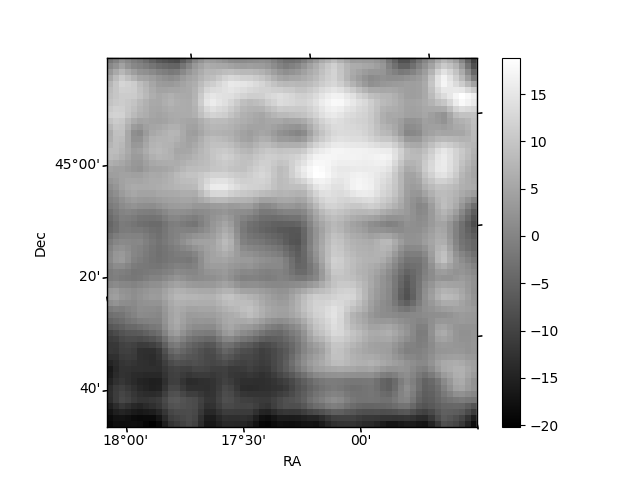
Histogram calculated using DETX and DETY for each event in the final _common_clean file
| Quadrant A | 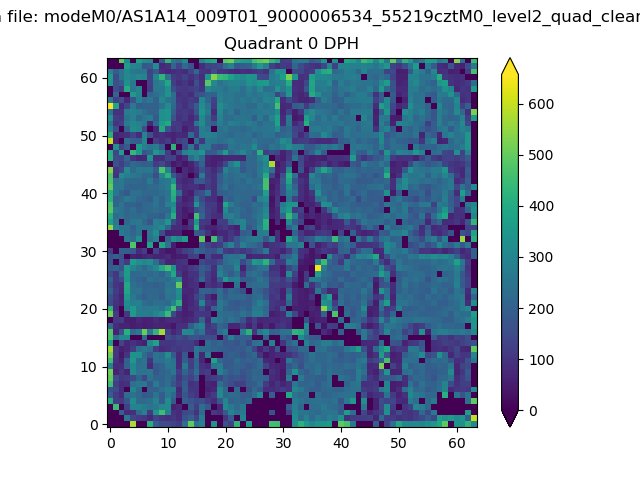 |
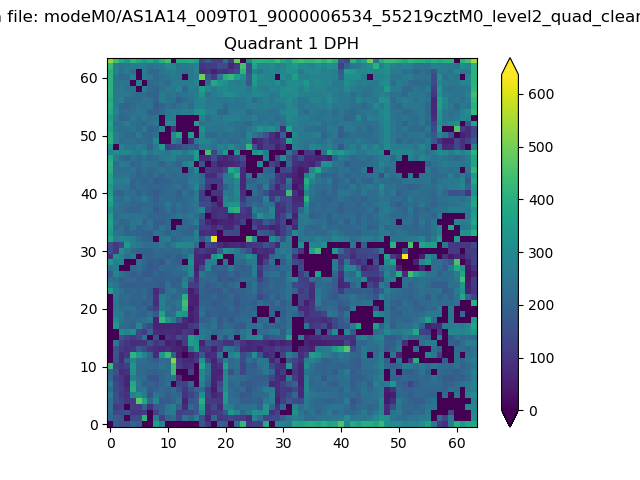 |
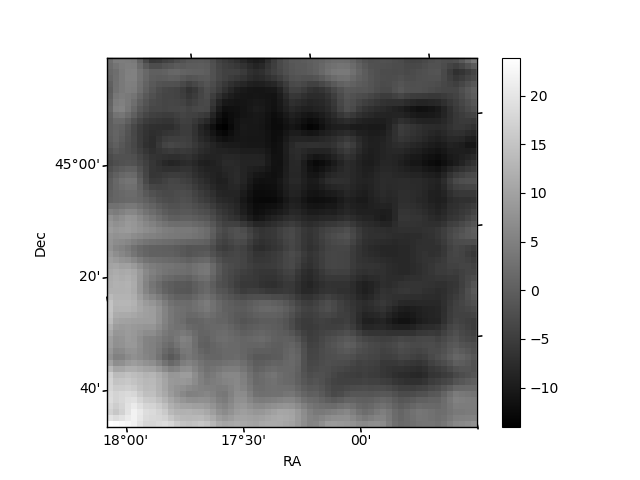
Quadrant B |
|---|---|---|---|
| Quadrant D | 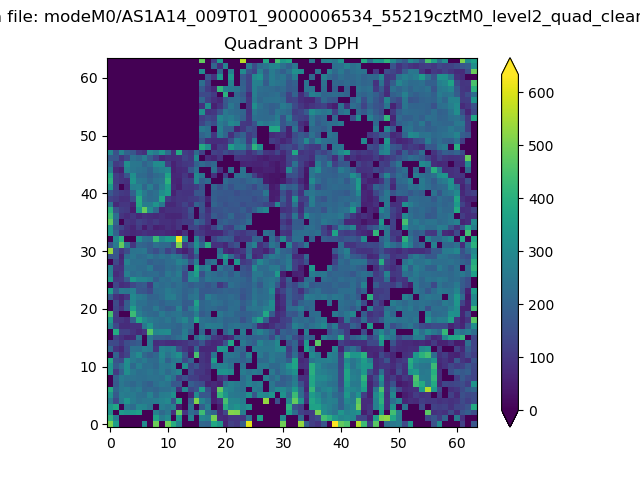 |
 |
Quadrant C |
| Plot type | Count rate plots | Images |
|---|---|---|
| Comparison with Poisson distribution Blue bars denote a histogram of data divided into 1 sec bins. Red curve is a Poisson curve with rate = median count rate of data. |
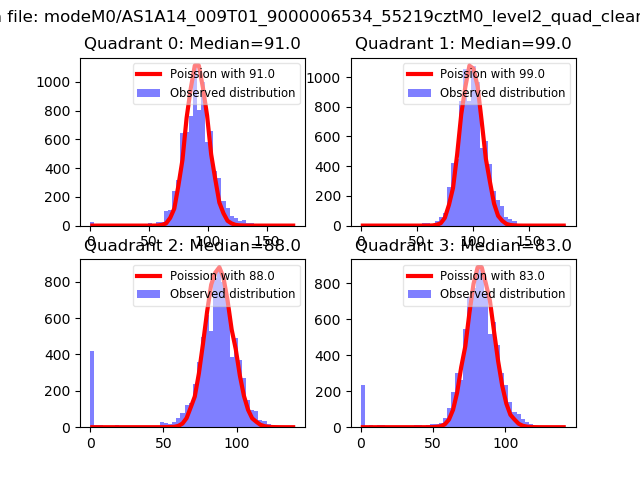 |
 |
| Quadrant-wise count rates Data is divided into 100 sec bins |
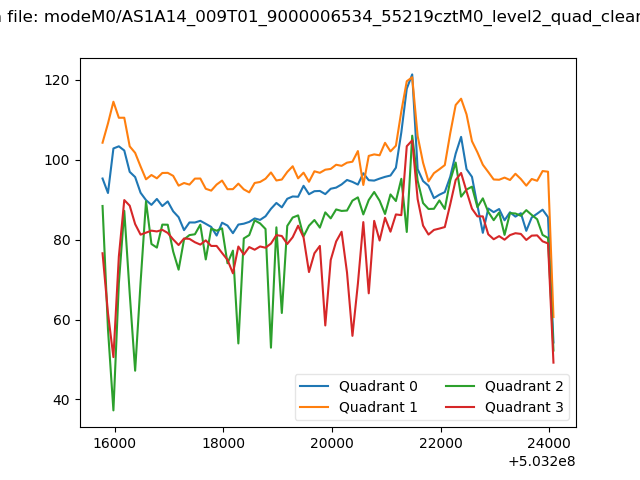 |
|
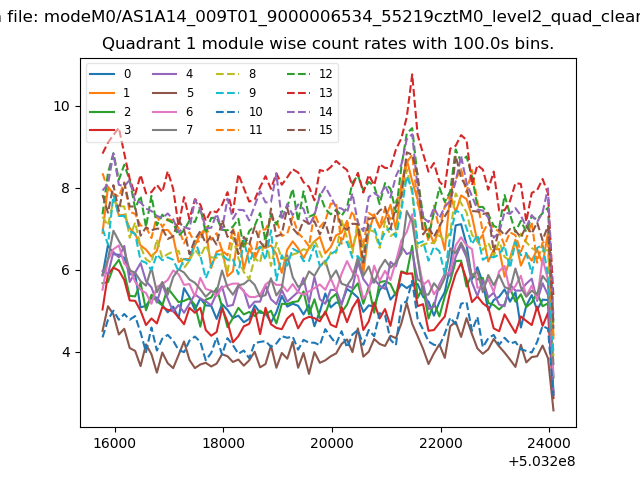
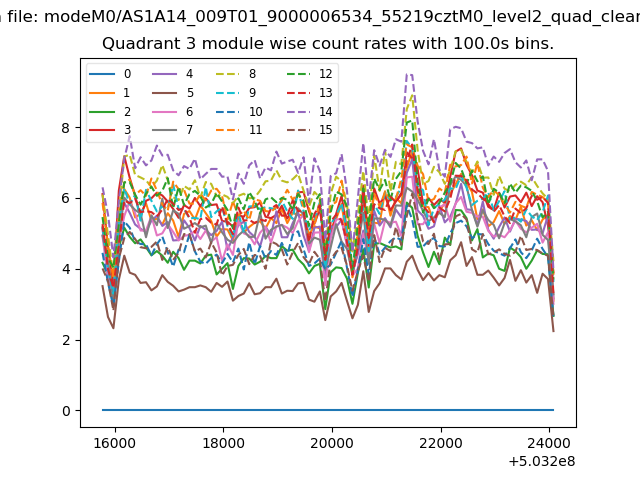
| Module-wise count rates for Quadrant A Data is divided into 100 sec bins |
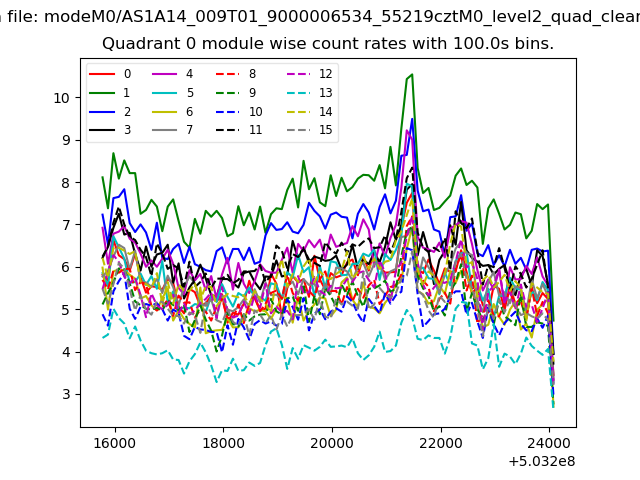 |
 |
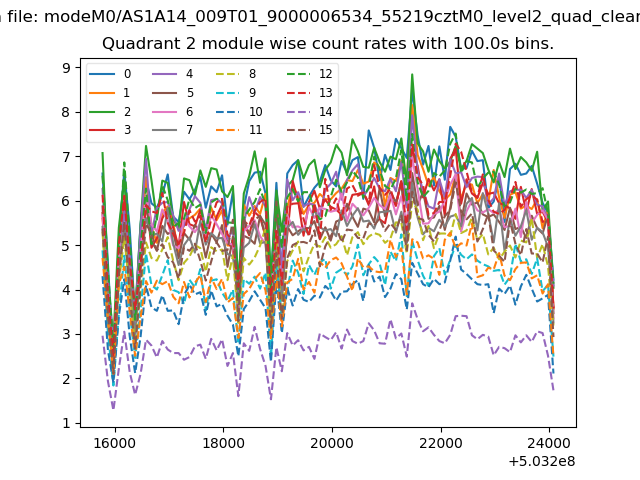
| Module-wise count rates for Quadrant B Data is divided into 100 sec bins |
 |
 |
| Module-wise count rates for Quadrant C Data is divided into 100 sec bins |
 |
 |
| Module-wise count rates for Quadrant D Data is divided into 100 sec bins |
 |
 |
| Parameter | Plot |
|---|---|
| CZT HV Monitor | 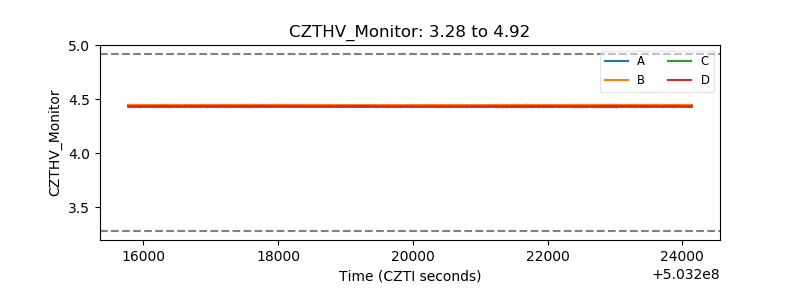 |
| D_VDD | 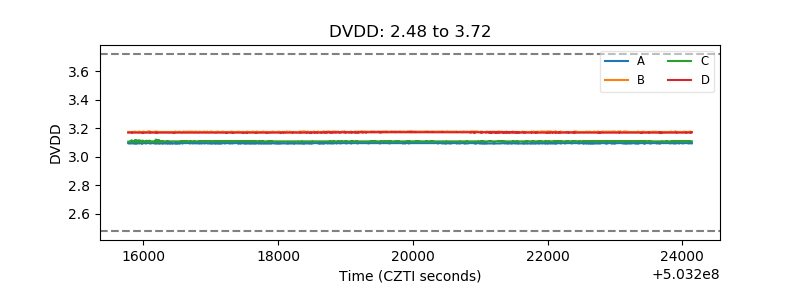 |
| Temperature 1 | 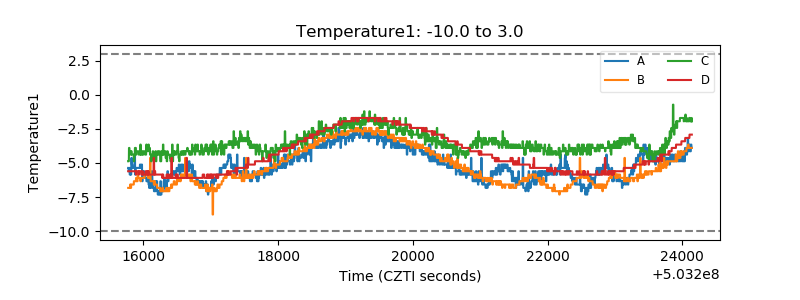 |
| Veto HV Monitor | 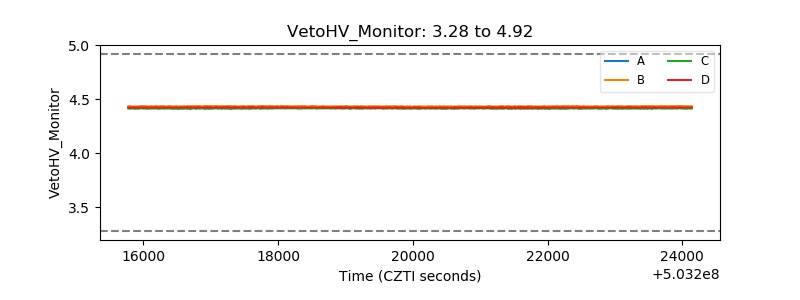 |
| Veto LLD | 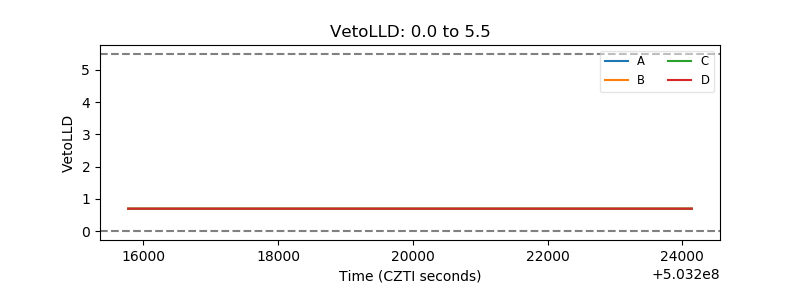 |
| Alpha Counter | 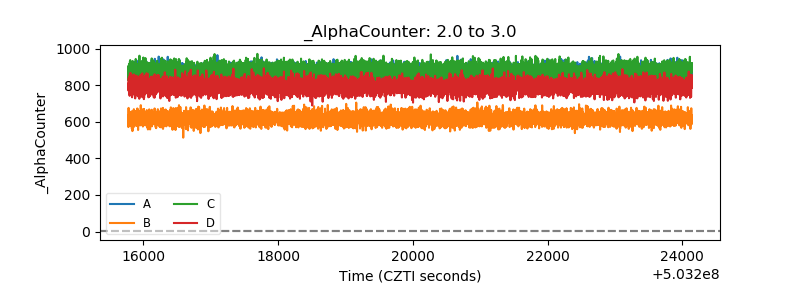 |
| _CPM_Rate | 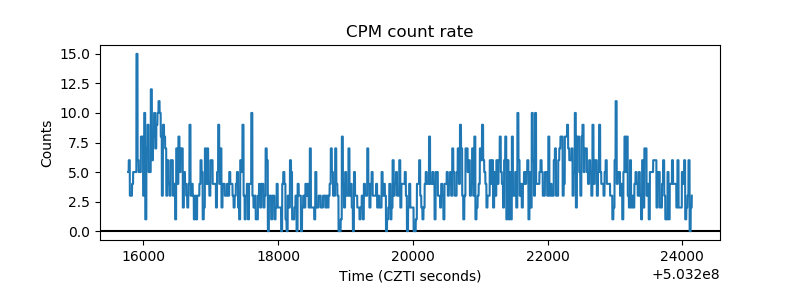 |
| CZT Counter | 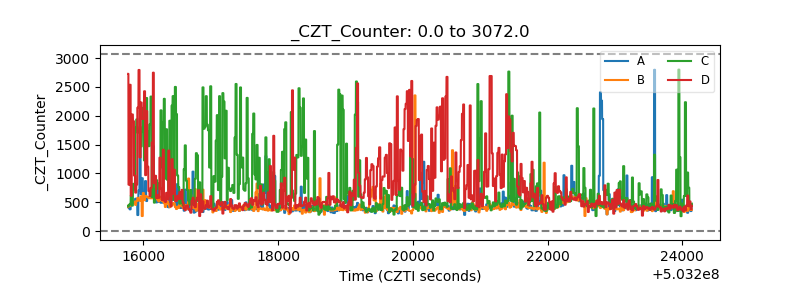 |
| +2.5 Volts monitor | 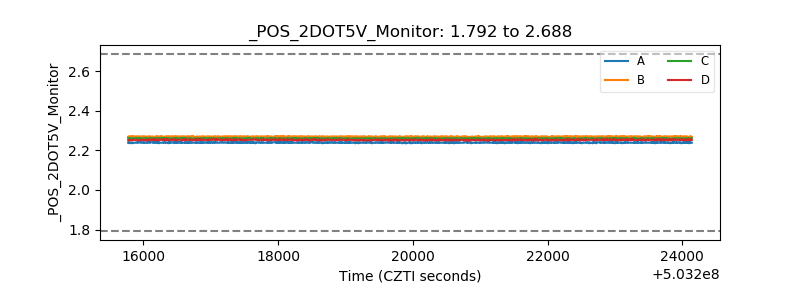 |
| +5 Volts monitor | 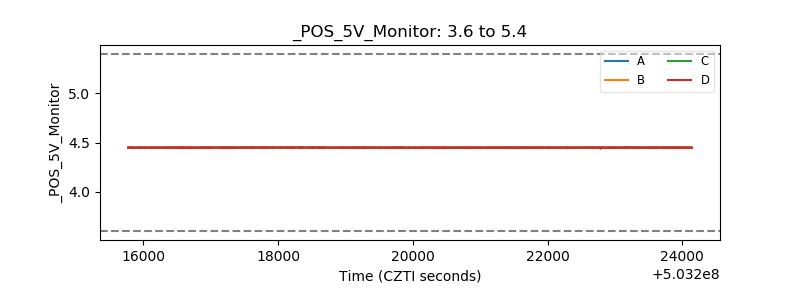 |
| _ROLL_ROT | 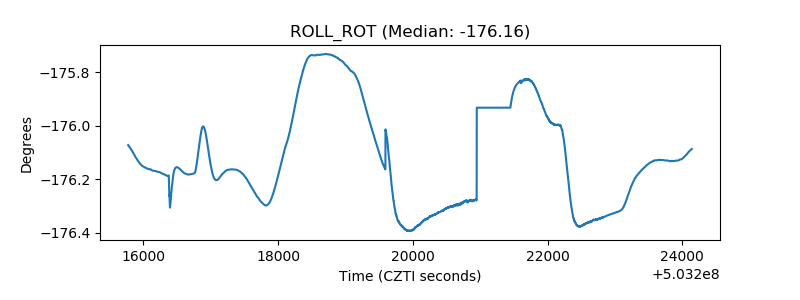 |
| _Roll_DEC | 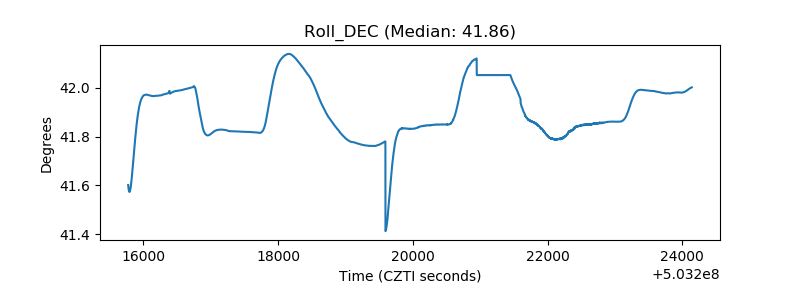 |
| _Roll_RA | 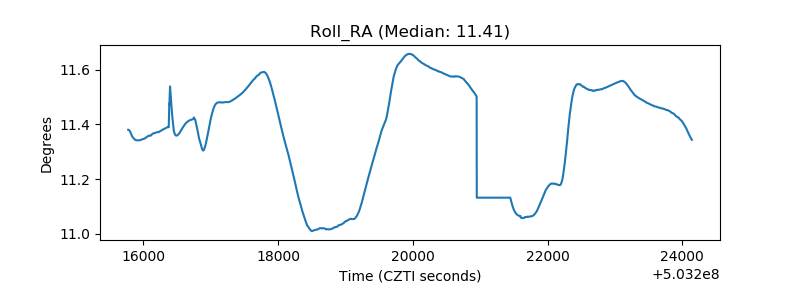 |
| Veto Counter | 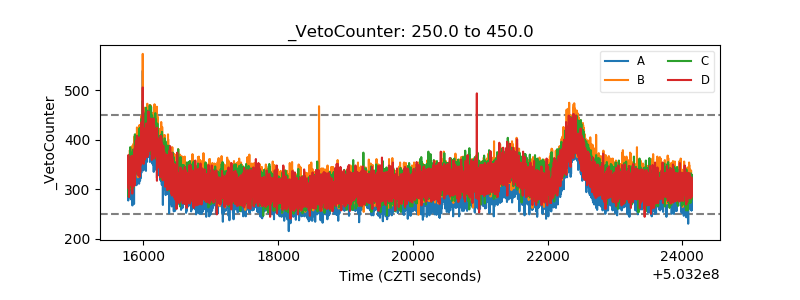 |