| Param | Original file | Final file |
|---|---|---|
| Filename | modeM0/AS1A14_009T01_9000006534_55225cztM0_level2.fits | modeM0/AS1A14_009T01_9000006534_55225cztM0_level2_quad_clean.evt |
| Size (bytes) | 543,844,800 | 94,167,360 |
| Size | 518.7 MB | 89.8 MB |
| Events in quadrant A | 3,209,779 | 644,181 |
| Events in quadrant B | 3,465,965 | 678,671 |
| Events in quadrant C | 6,235,599 | 526,533 |
| Events in quadrant D | 6,690,651 | 526,785 |
| Mode SS | |||
|---|---|---|---|
| Quadrant | BADHDUFLAG | Total packets | Discarded packets |
| A | 0 | 138 | 0 |
| B | 0 | 138 | 0 |
| C | 0 | 138 | 0 |
| D | 0 | 138 | 0 |
| Mode M0 | |||
|---|---|---|---|
| Quadrant | BADHDUFLAG | Total packets | Discarded packets |
| A | 0 | 14558 | 1 |
| B | 0 | 15430 | 1 |
| C | 0 | 23459 | 1 |
| D | 0 | 24546 | 2 |
| Mode M9 | |||
|---|---|---|---|
| Quadrant | BADHDUFLAG | Total packets | Discarded packets |
| A | 0 | 9 | 0 |
| B | 0 | 9 | 0 |
| C | 0 | 9 | 0 |
| D | 0 | 9 | 0 |
| Quadrant | Total seconds | Saturated seconds | Saturation percentage |
|---|---|---|---|
| A | 6815 | 65 | 0.953778% |
| B | 6816 | 122 | 1.789906% |
| C | 6816 | 1078 | 15.815728% |
| D | 6815 | 849 | 12.457814% |
Noise dominated data is calculated using 1-second bins in cleaned event files. If a bin has >2000 counts, and if more than 50% of those come from <1% of pixels, then it is considered to be noise-dominated and hence unusable.
| Quadrant | # 1 sec bins | Bins with >0 counts | Bins with >2000 counts | High rate bins dominated by noise | Noise dominated (total time) | Noise dominated (detector-on time) | Marked lightcurve |
|---|---|---|---|---|---|---|---|
| A | 7755 | 6816 | 49 | 49 | 0.63% | 0.72% | 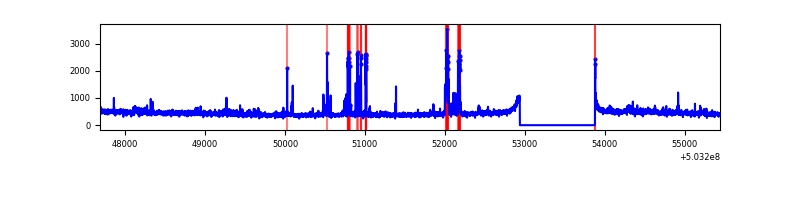 |
| B | 7756 | 6816 | 72 | 72 | 0.93% | 1.06% | 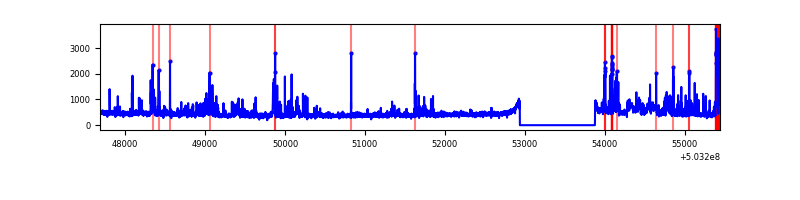 |
| C | 7756 | 6817 | 988 | 988 | 12.74% | 14.49% | 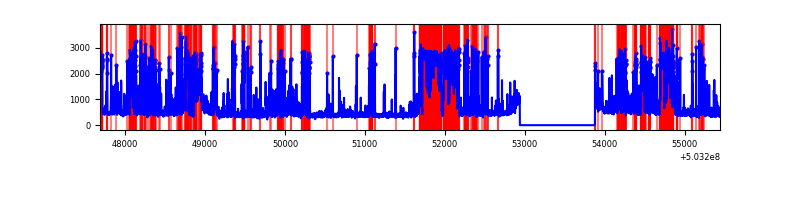 |
| D | 7755 | 6815 | 767 | 767 | 9.89% | 11.25% | 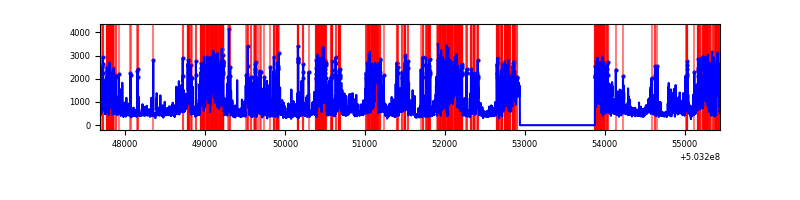 |
Top three noisy pixels from each quadrant. If the there are fewer than three noisy pixels in the level2.evt file, extra rows are filled as -1
| Pixel properties | Quadrant properties | ||||||
|---|---|---|---|---|---|---|---|
| Quadrant | DetID | PixID | Counts | Sigma | Mean | Median | Sigma |
| A | 4 | 205 | 132798 | 744.26 | 710 | 692 | 177.5 |
| A | 0 | 8 | 127965 | 717.03 | 710 | 692 | 177.5 |
| A | 4 | 3 | 73162 | 408.28 | 710 | 692 | 177.5 |
| B | 10 | 245 | 192059 | 1288.72 | 698 | 674 | 148.5 |
| B | 5 | 236 | 137137 | 918.89 | 698 | 674 | 148.5 |
| B | 10 | 247 | 114956 | 769.53 | 698 | 674 | 148.5 |
| C | 13 | 3 | 1241892 | 7068.59 | 639 | 633 | 175.6 |
| C | 12 | 252 | 1006950 | 5730.67 | 639 | 633 | 175.6 |
| C | 12 | 254 | 796104 | 4529.96 | 639 | 633 | 175.6 |
| D | 2 | 249 | 1937298 | 10367.98 | 658 | 629 | 186.8 |
| D | 11 | 129 | 1369901 | 7330.41 | 658 | 629 | 186.8 |
| D | 5 | 38 | 234745 | 1253.34 | 658 | 629 | 186.8 |
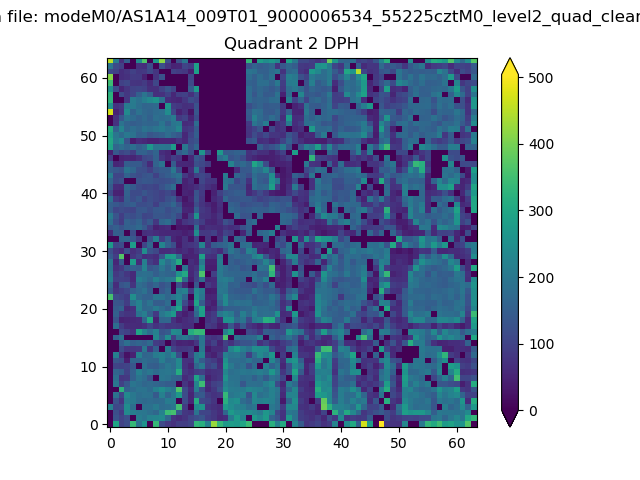
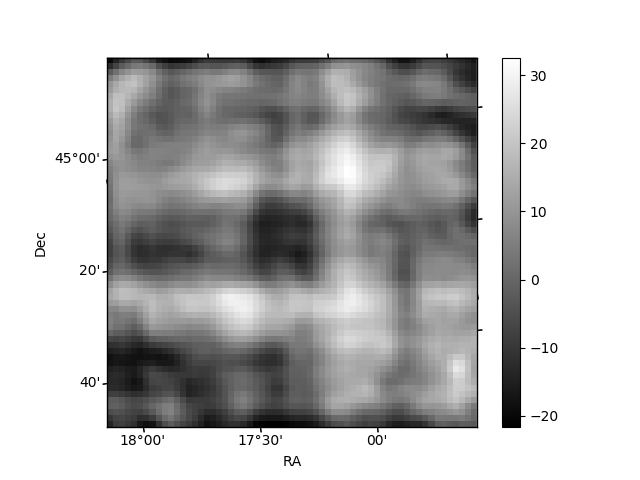
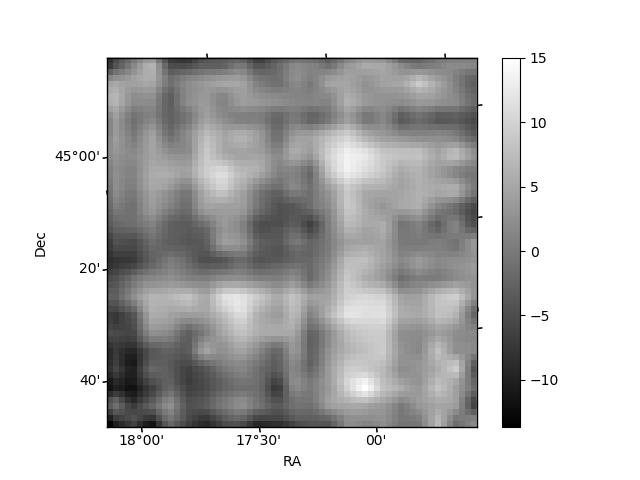
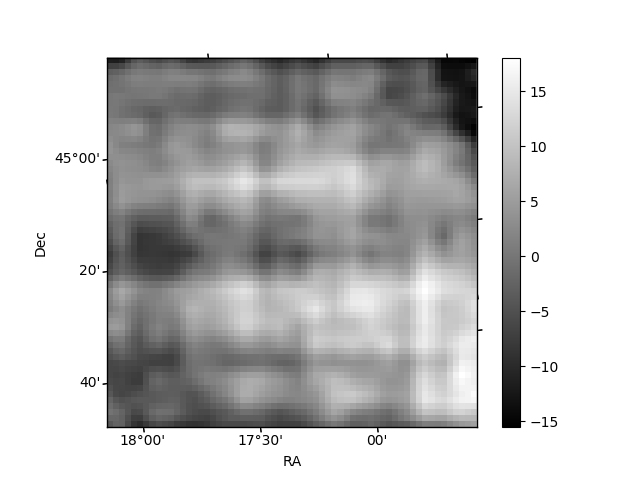
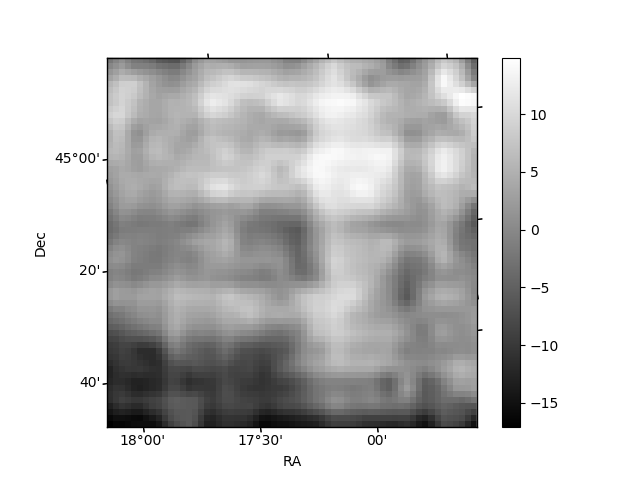
Histogram calculated using DETX and DETY for each event in the final _common_clean file
| Quadrant A | 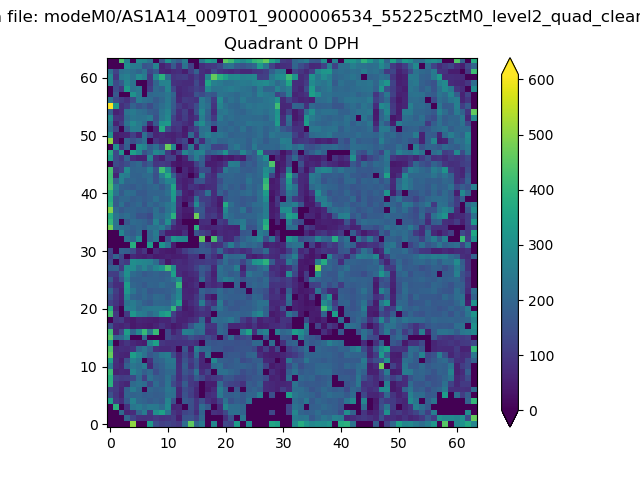 |
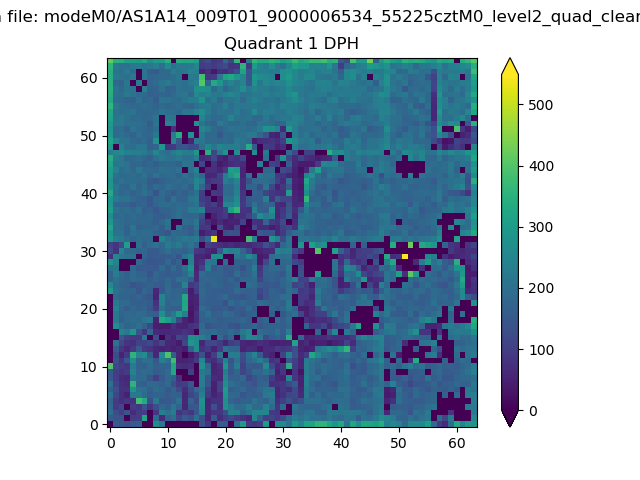 |
Quadrant B |
|---|---|---|---|
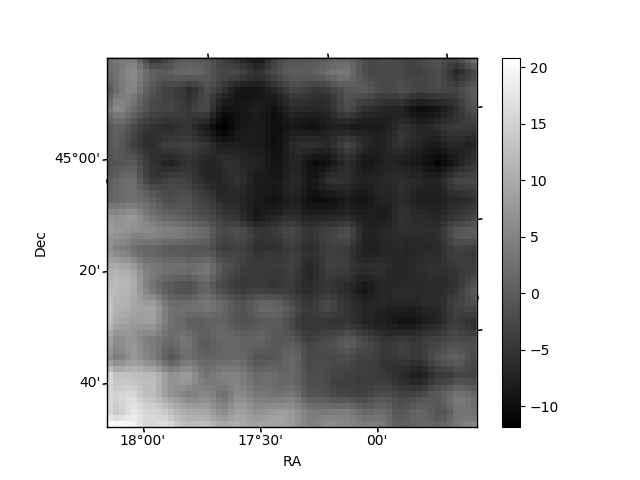
| Quadrant D | 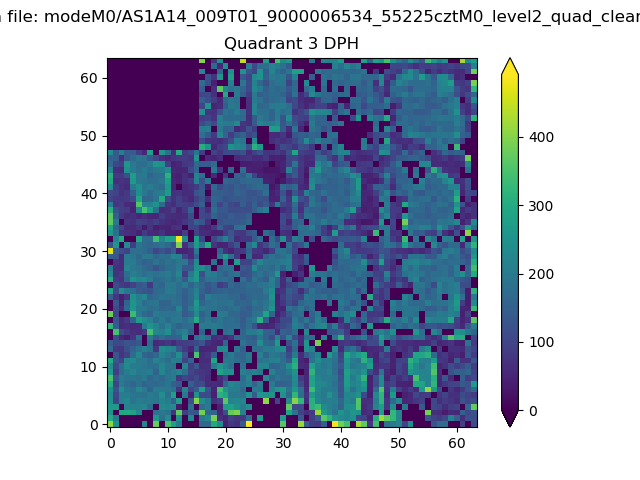 |
 |
Quadrant C |
| Plot type | Count rate plots | Images |
|---|---|---|
| Comparison with Poisson distribution Blue bars denote a histogram of data divided into 1 sec bins. Red curve is a Poisson curve with rate = median count rate of data. |
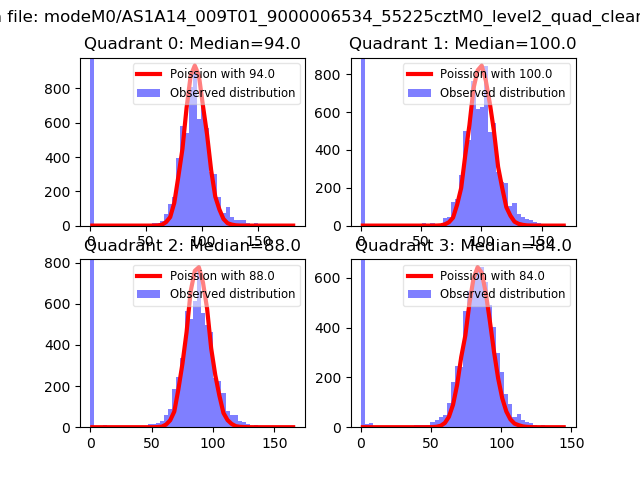 |
 |
| Quadrant-wise count rates Data is divided into 100 sec bins |
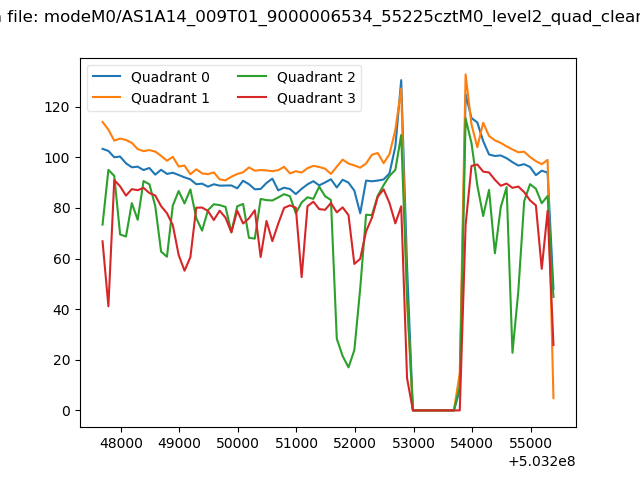 |
|
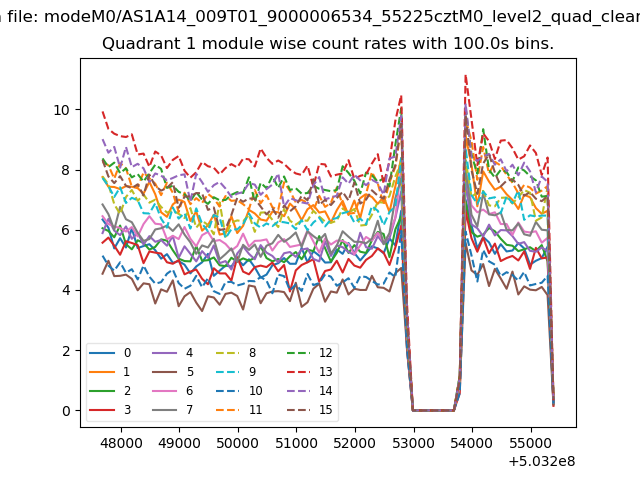
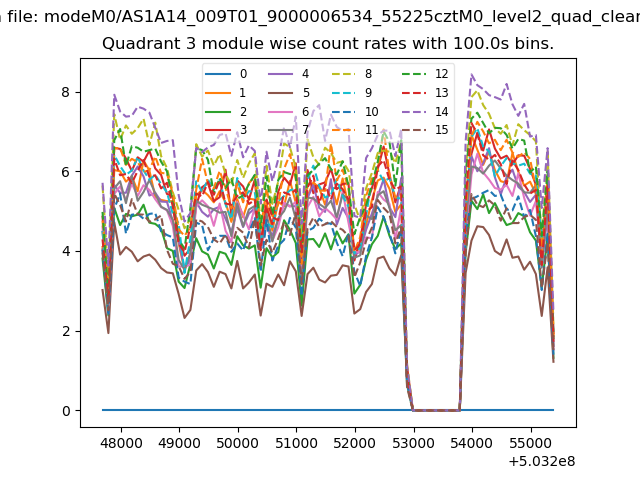
| Module-wise count rates for Quadrant A Data is divided into 100 sec bins |
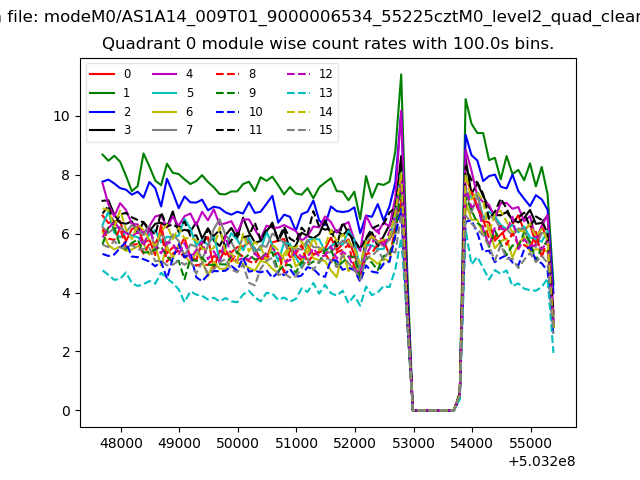 |
 |
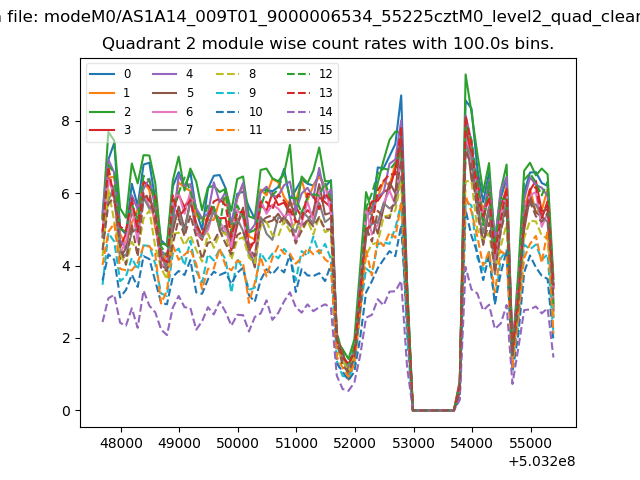
| Module-wise count rates for Quadrant B Data is divided into 100 sec bins |
 |
 |
| Module-wise count rates for Quadrant C Data is divided into 100 sec bins |
 |
 |
| Module-wise count rates for Quadrant D Data is divided into 100 sec bins |
 |
 |
| Parameter | Plot |
|---|---|
| CZT HV Monitor | 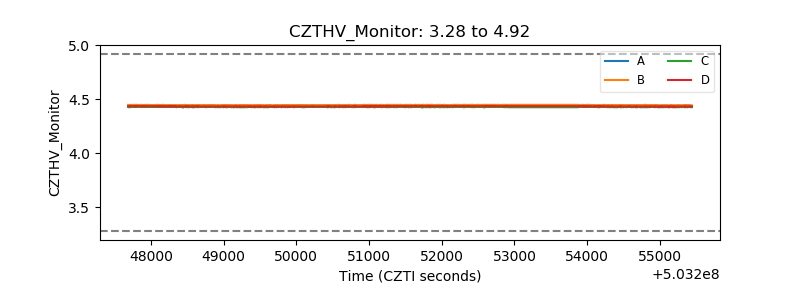 |
| D_VDD | 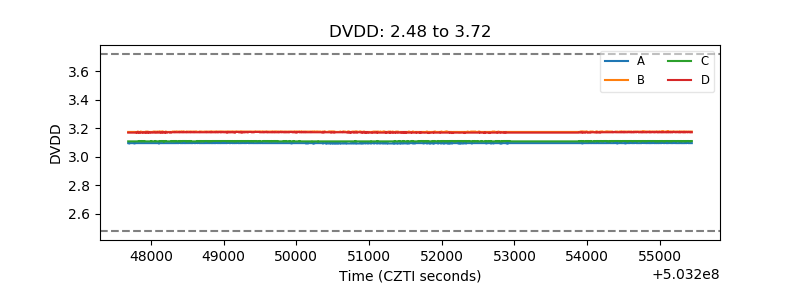 |
| Temperature 1 | 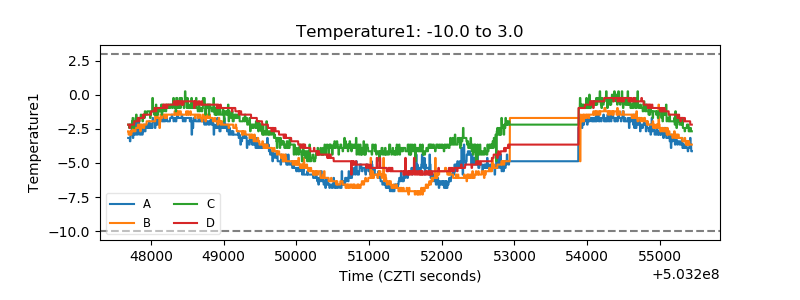 |
| Veto HV Monitor | 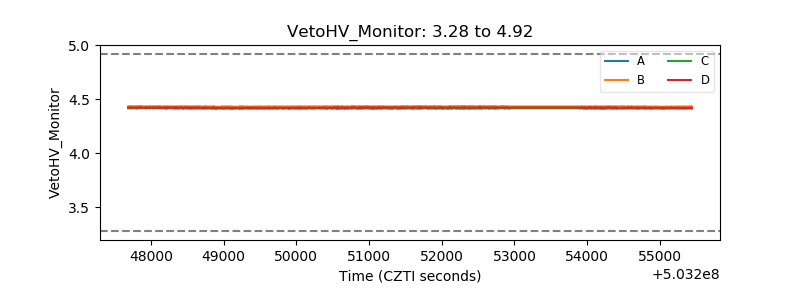 |
| Veto LLD | 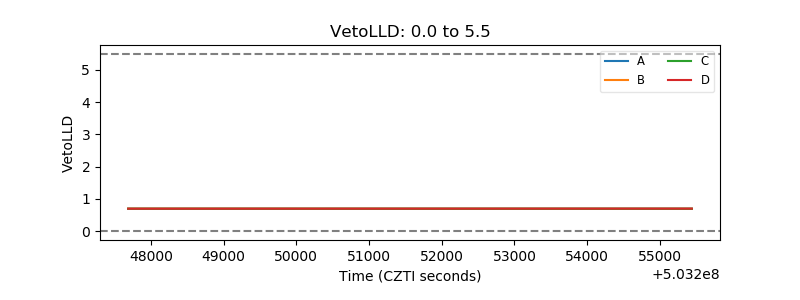 |
| Alpha Counter | 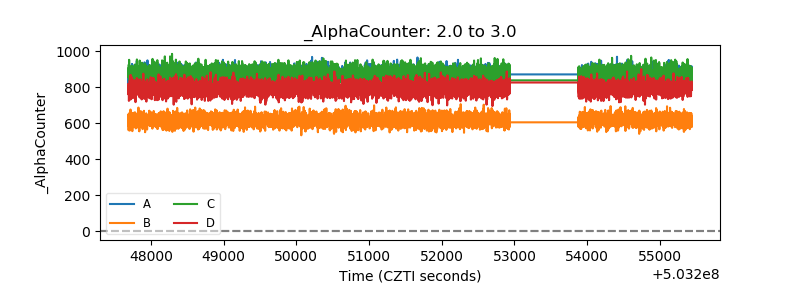 |
| _CPM_Rate | 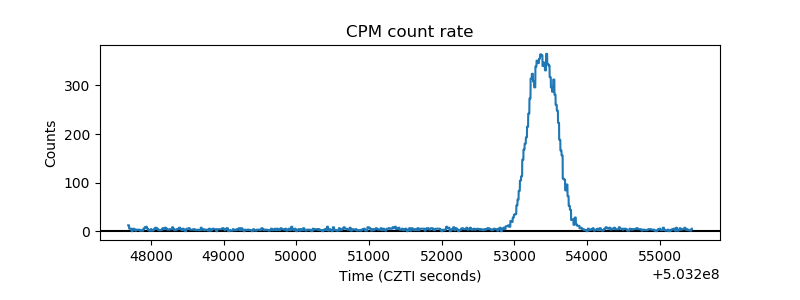 |
| CZT Counter | 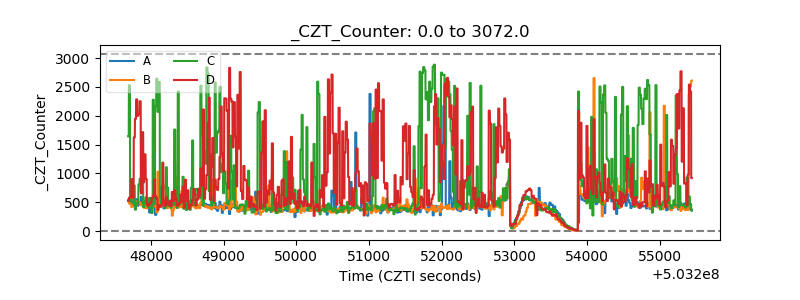 |
| +2.5 Volts monitor | 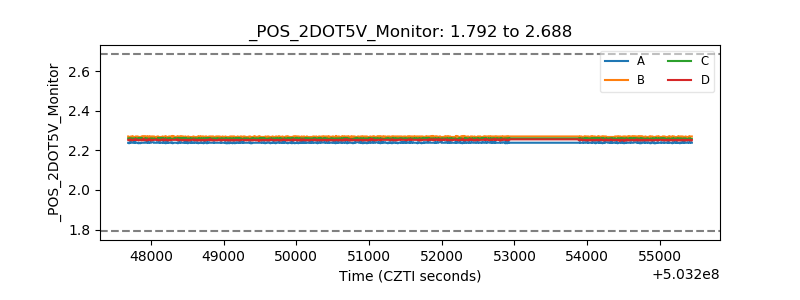 |
| +5 Volts monitor | 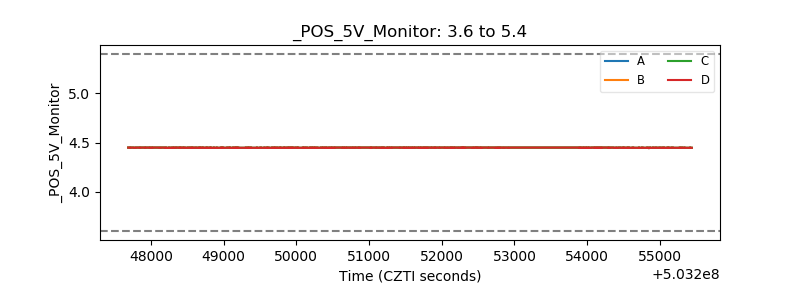 |
| _ROLL_ROT | 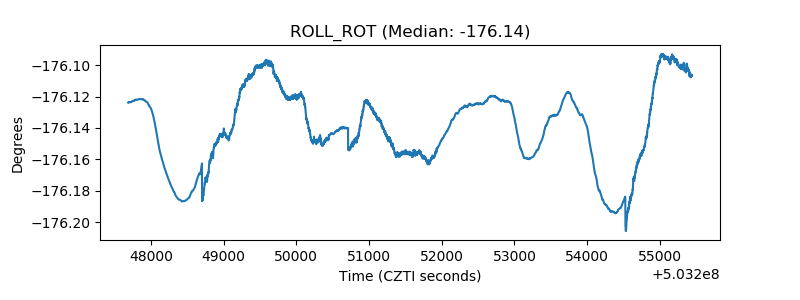 |
| _Roll_DEC | 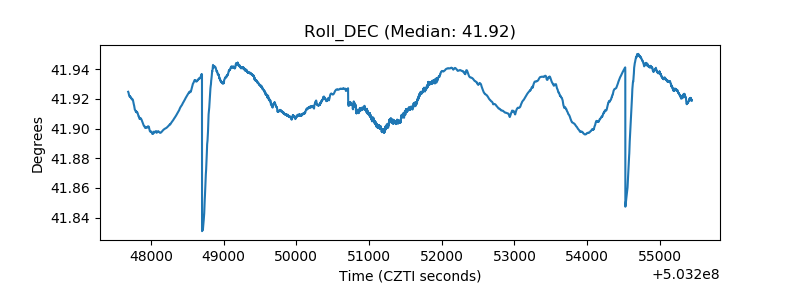 |
| _Roll_RA | 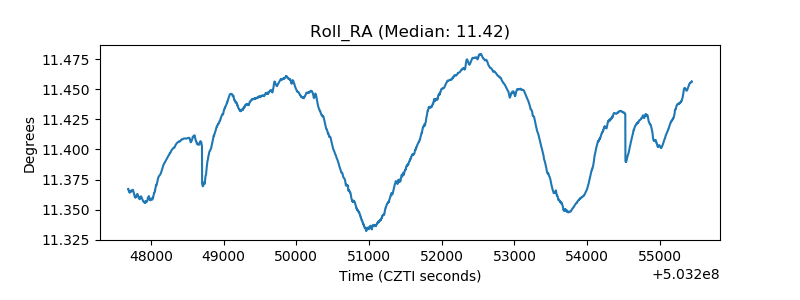 |
| Veto Counter | 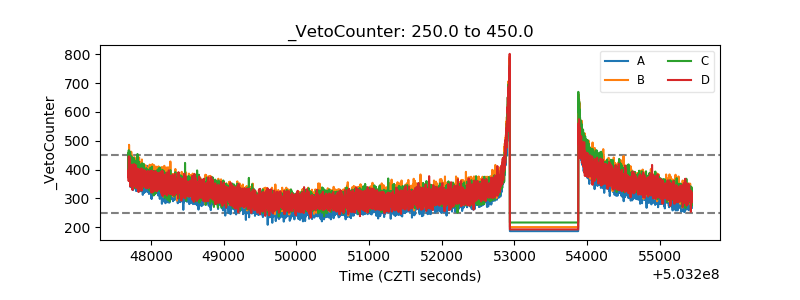 |