| Param | Original file | Final file |
|---|---|---|
| Filename | modeM0/AS1A14_009T01_9000006534_55226cztM0_level2.fits | modeM0/AS1A14_009T01_9000006534_55226cztM0_level2_quad_clean.evt |
| Size (bytes) | 505,935,360 | 92,257,920 |
| Size | 482.5 MB | 88.0 MB |
| Events in quadrant A | 3,719,976 | 624,754 |
| Events in quadrant B | 3,604,046 | 656,407 |
| Events in quadrant C | 4,845,696 | 552,040 |
| Events in quadrant D | 6,052,013 | 505,861 |
| Mode SS | |||
|---|---|---|---|
| Quadrant | BADHDUFLAG | Total packets | Discarded packets |
| A | 0 | 130 | 0 |
| B | 0 | 130 | 0 |
| C | 0 | 130 | 0 |
| D | 0 | 130 | 0 |
| Mode M0 | |||
|---|---|---|---|
| Quadrant | BADHDUFLAG | Total packets | Discarded packets |
| A | 0 | 15612 | 1 |
| B | 0 | 15522 | 1 |
| C | 0 | 19097 | 1 |
| D | 0 | 22533 | 1 |
| Mode M9 | |||
|---|---|---|---|
| Quadrant | BADHDUFLAG | Total packets | Discarded packets |
| A | 0 | 11 | 0 |
| B | 0 | 11 | 0 |
| C | 0 | 11 | 0 |
| D | 0 | 11 | 0 |
| Quadrant | Total seconds | Saturated seconds | Saturation percentage |
|---|---|---|---|
| A | 6519 | 55 | 0.843688% |
| B | 6520 | 160 | 2.453988% |
| C | 6520 | 567 | 8.696319% |
| D | 6520 | 756 | 11.595092% |
Noise dominated data is calculated using 1-second bins in cleaned event files. If a bin has >2000 counts, and if more than 50% of those come from <1% of pixels, then it is considered to be noise-dominated and hence unusable.
| Quadrant | # 1 sec bins | Bins with >0 counts | Bins with >2000 counts | High rate bins dominated by noise | Noise dominated (total time) | Noise dominated (detector-on time) | Marked lightcurve |
|---|---|---|---|---|---|---|---|
| A | 7569 | 6520 | 38 | 38 | 0.50% | 0.58% | 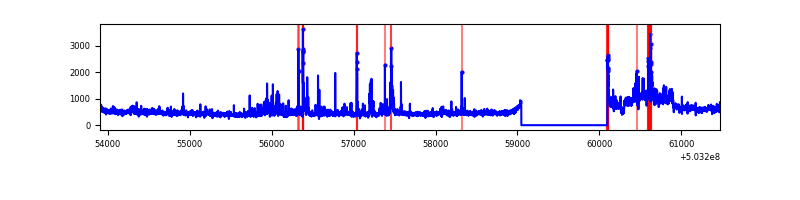 |
| B | 7570 | 6521 | 107 | 107 | 1.41% | 1.64% | 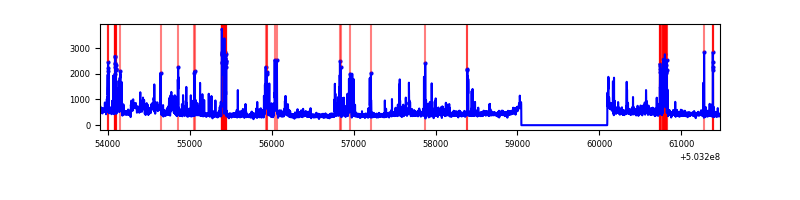 |
| C | 7570 | 6521 | 510 | 510 | 6.74% | 7.82% | 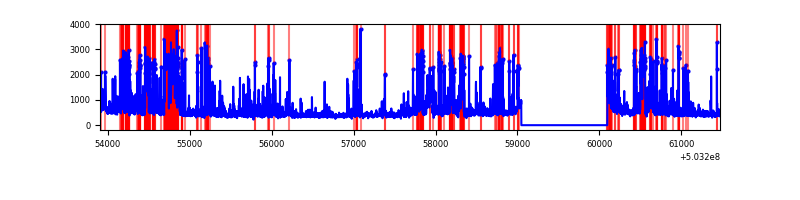 |
| D | 7570 | 6520 | 768 | 768 | 10.15% | 11.78% | 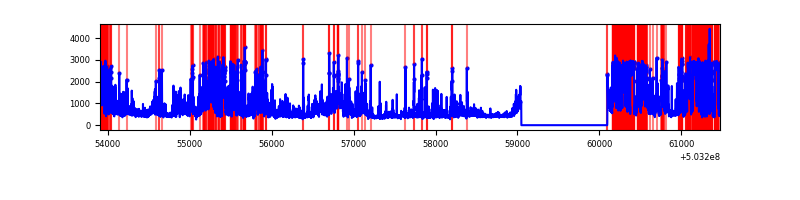 |
Top three noisy pixels from each quadrant. If the there are fewer than three noisy pixels in the level2.evt file, extra rows are filled as -1
| Pixel properties | Quadrant properties | ||||||
|---|---|---|---|---|---|---|---|
| Quadrant | DetID | PixID | Counts | Sigma | Mean | Median | Sigma |
| A | 5 | 113 | 540117 | 3188.0 | 680 | 663 | 169.2 |
| A | 4 | 205 | 168012 | 988.98 | 680 | 663 | 169.2 |
| A | 4 | 3 | 109249 | 641.71 | 680 | 663 | 169.2 |
| B | 10 | 245 | 207916 | 1443.03 | 672 | 649 | 143.6 |
| B | 5 | 236 | 197821 | 1372.75 | 672 | 649 | 143.6 |
| B | 4 | 81 | 160560 | 1113.33 | 672 | 649 | 143.6 |
| C | 13 | 3 | 1110434 | 6325.38 | 643 | 637 | 175.5 |
| C | 12 | 254 | 661455 | 3766.38 | 643 | 637 | 175.5 |
| C | 10 | 22 | 150026 | 851.45 | 643 | 637 | 175.5 |
| D | 2 | 249 | 2246687 | 12775.81 | 622 | 596 | 175.8 |
| D | 11 | 129 | 802310 | 4560.17 | 622 | 596 | 175.8 |
| D | 3 | 12 | 152362 | 863.25 | 622 | 596 | 175.8 |
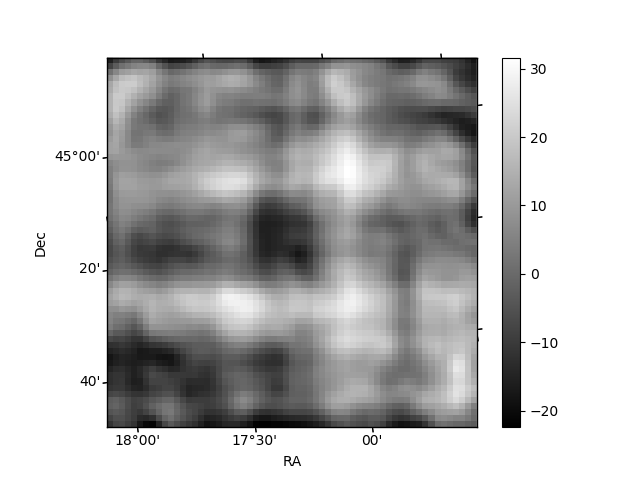
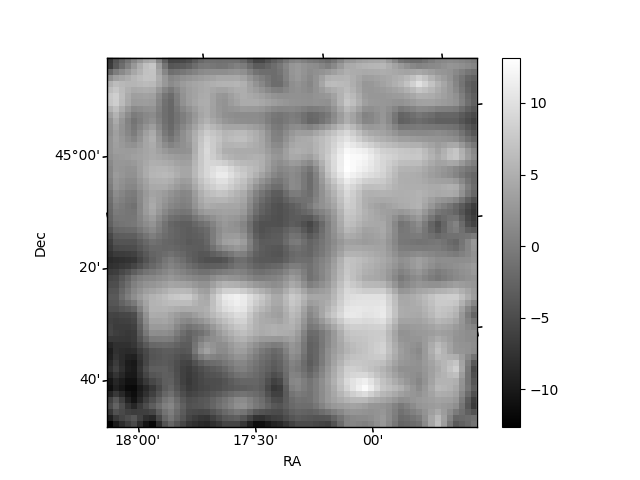
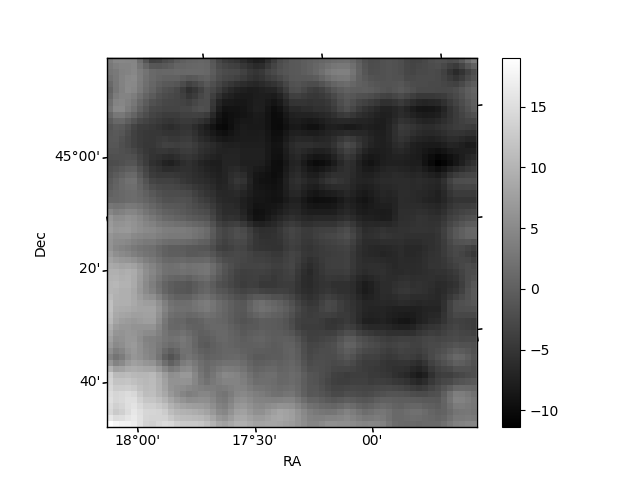
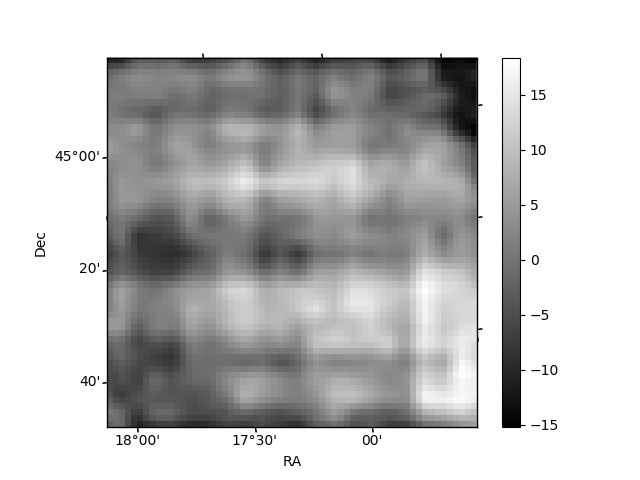
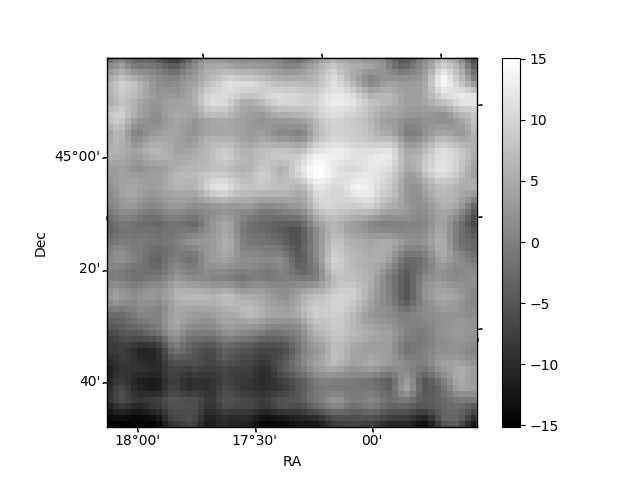
Histogram calculated using DETX and DETY for each event in the final _common_clean file
| Quadrant A | 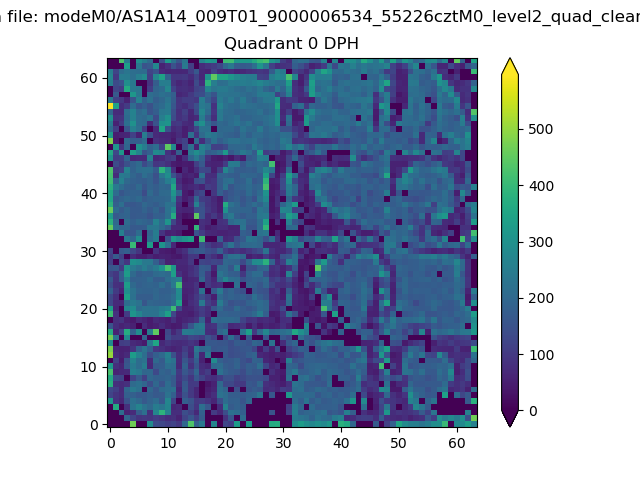 |
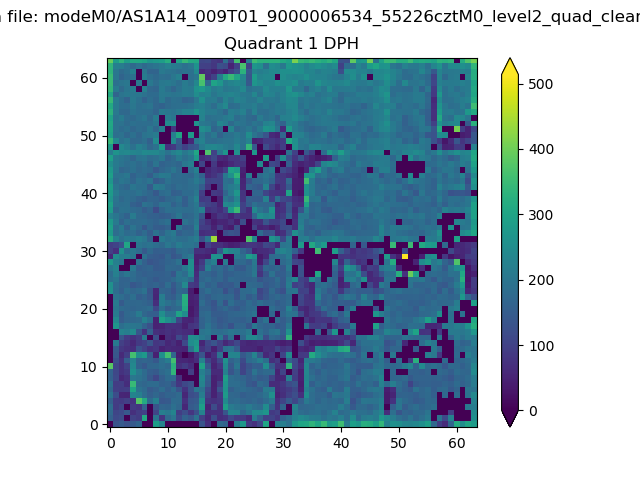 |
Quadrant B |
|---|---|---|---|
| Quadrant D | 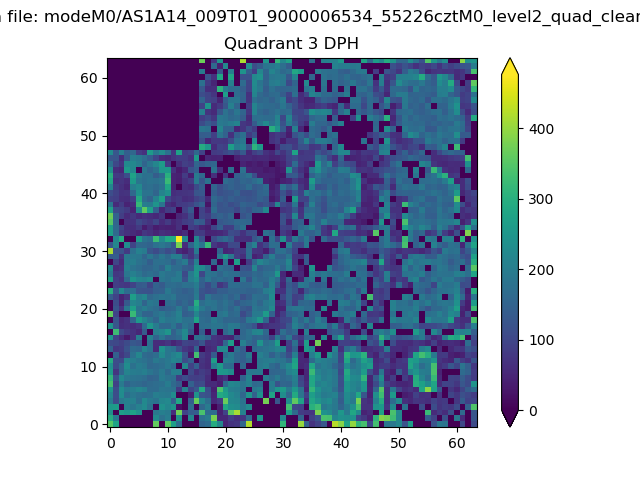 |
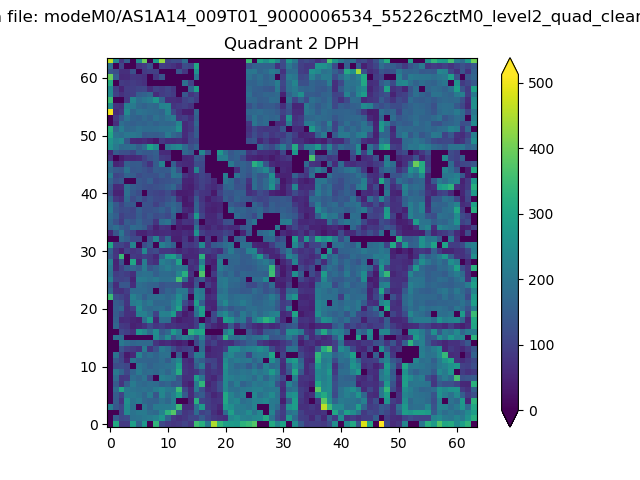 |
Quadrant C |
| Plot type | Count rate plots | Images |
|---|---|---|
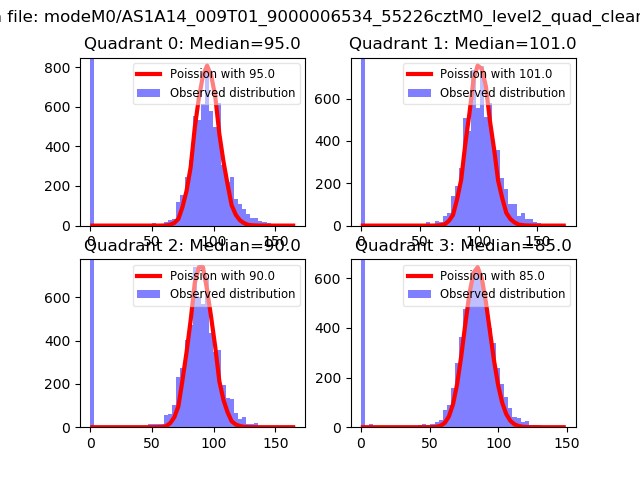
| Comparison with Poisson distribution Blue bars denote a histogram of data divided into 1 sec bins. Red curve is a Poisson curve with rate = median count rate of data. |
 |
 |
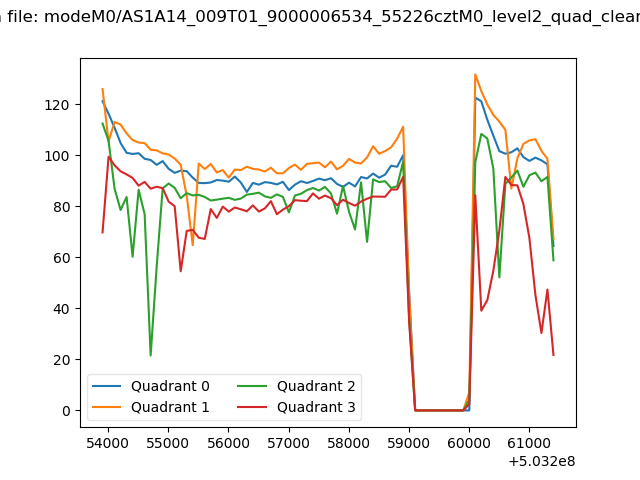
| Quadrant-wise count rates Data is divided into 100 sec bins |
 |
|
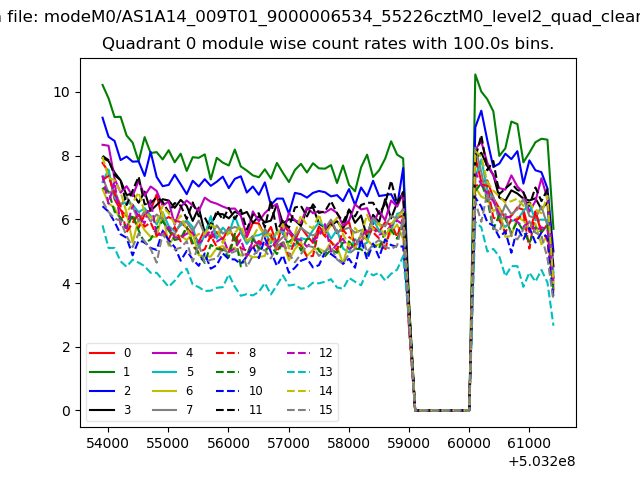
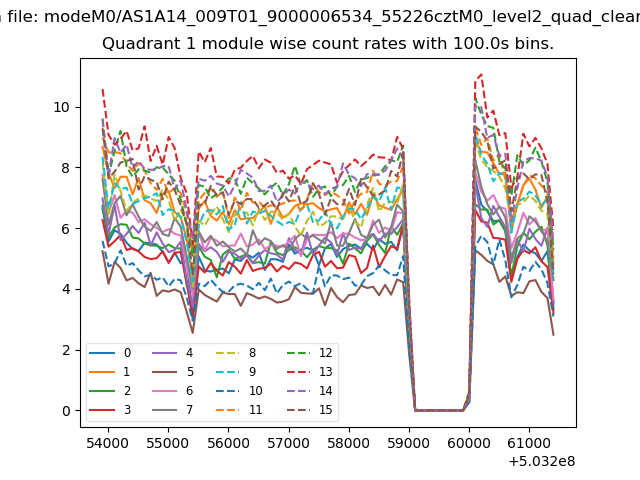
| Module-wise count rates for Quadrant A Data is divided into 100 sec bins |
 |
 |
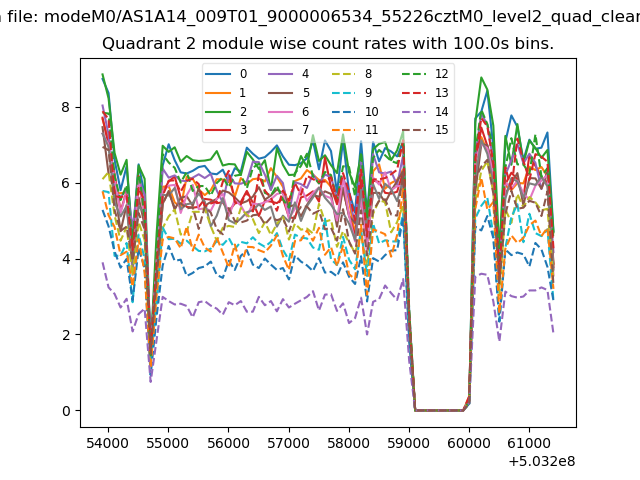
| Module-wise count rates for Quadrant B Data is divided into 100 sec bins |
 |
 |
| Module-wise count rates for Quadrant C Data is divided into 100 sec bins |
 |
 |
| Module-wise count rates for Quadrant D Data is divided into 100 sec bins |
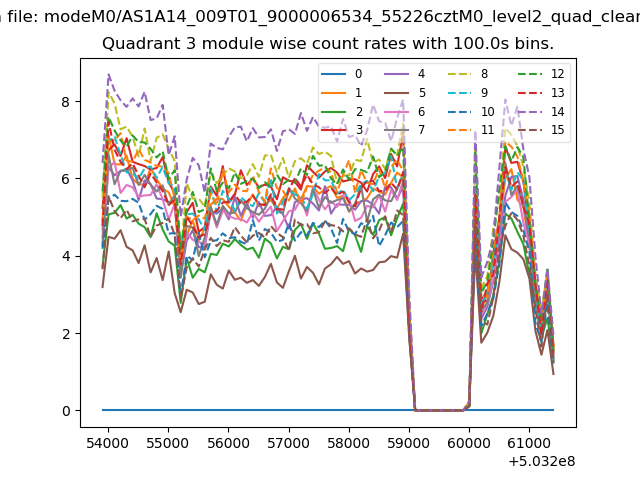 |
 |
| Parameter | Plot |
|---|---|
| CZT HV Monitor |  |
| D_VDD | 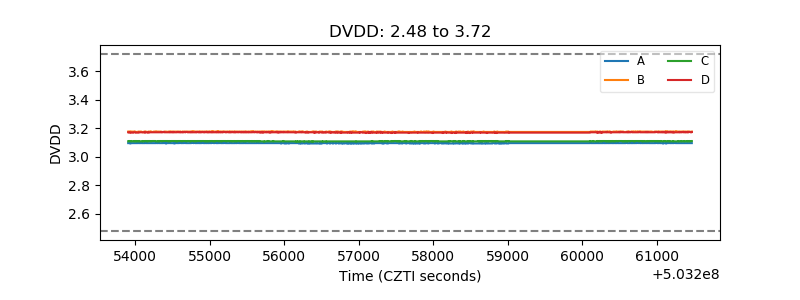 |
| Temperature 1 | 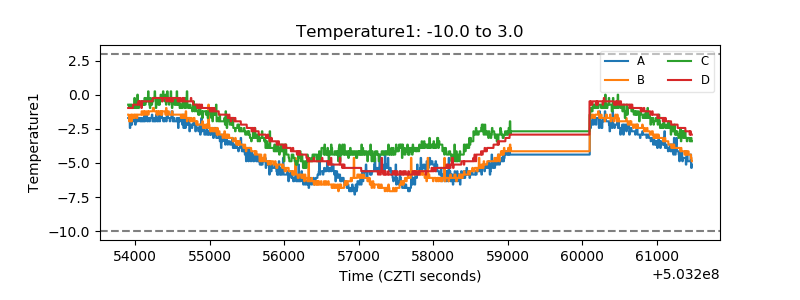 |
| Veto HV Monitor | 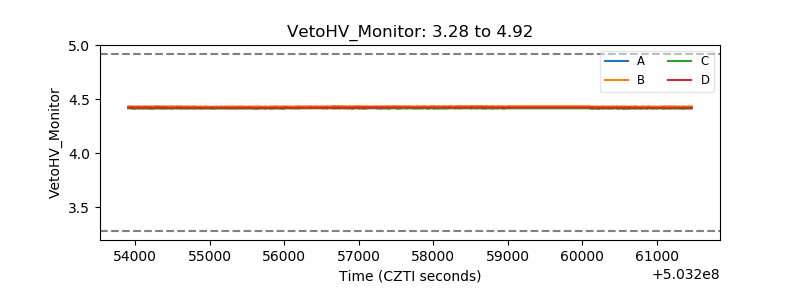 |
| Veto LLD | 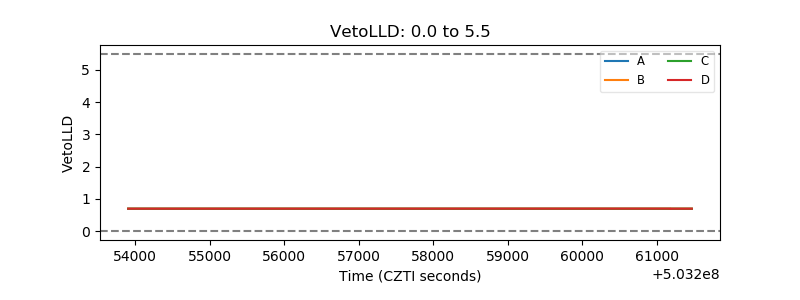 |
| Alpha Counter | 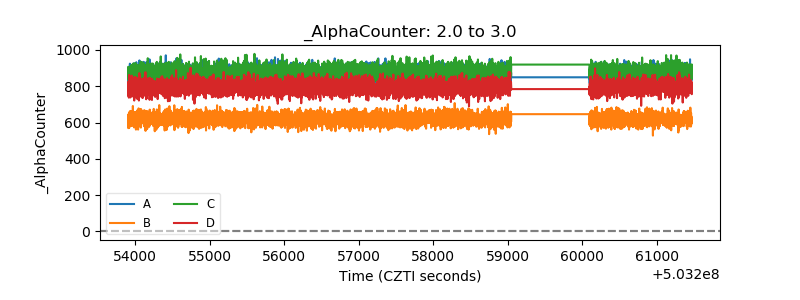 |
| _CPM_Rate | 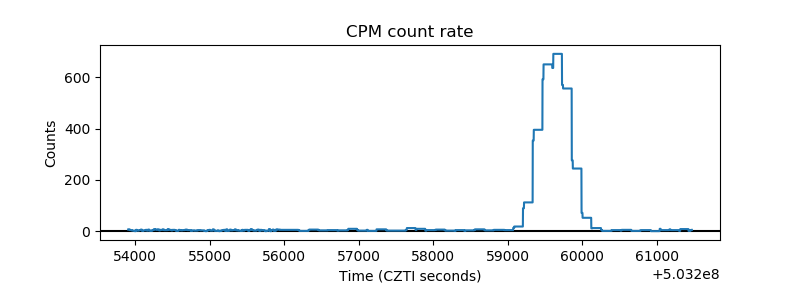 |
| CZT Counter | 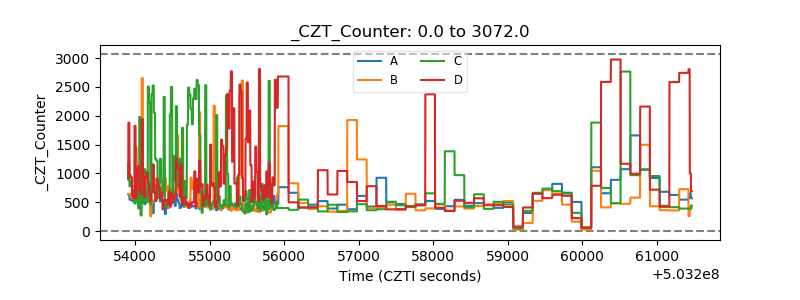 |
| +2.5 Volts monitor | 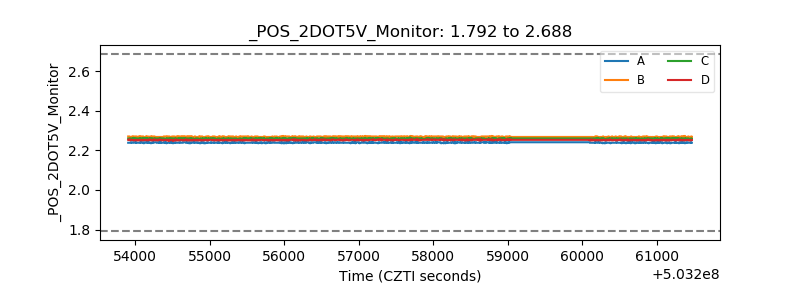 |
| +5 Volts monitor | 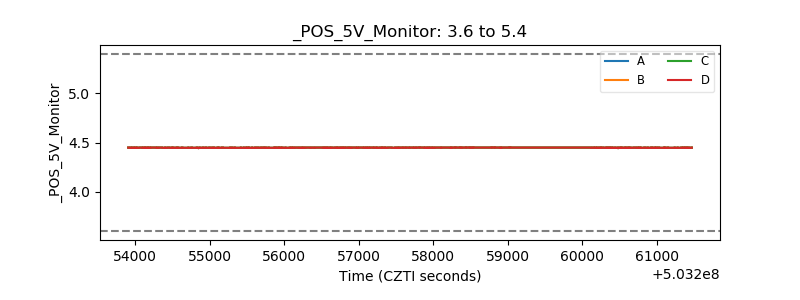 |
| _ROLL_ROT | 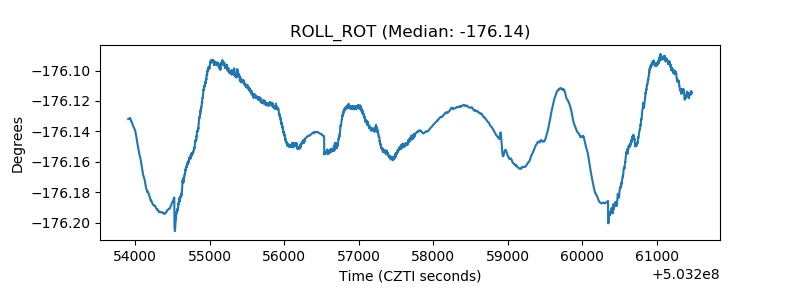 |
| _Roll_DEC | 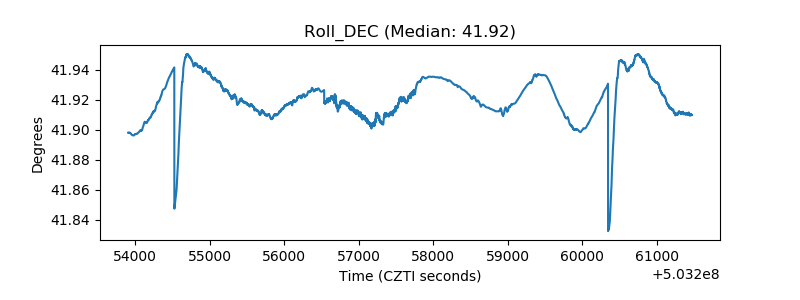 |
| _Roll_RA | 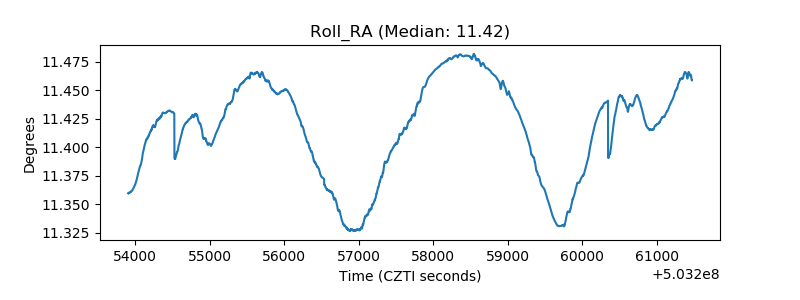 |
| Veto Counter | 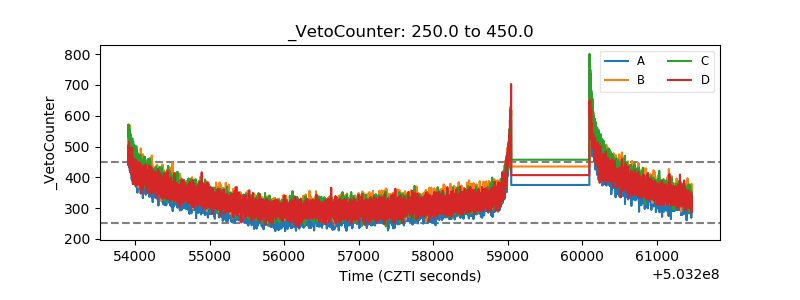 |