| Param | Original file | Final file |
|---|---|---|
| Filename | modeM0/AS1A14_009T01_9000006534_55227cztM0_level2.fits | modeM0/AS1A14_009T01_9000006534_55227cztM0_level2_quad_clean.evt |
| Size (bytes) | 541,618,560 | 91,656,000 |
| Size | 516.5 MB | 87.4 MB |
| Events in quadrant A | 4,824,300 | 616,241 |
| Events in quadrant B | 3,142,047 | 667,583 |
| Events in quadrant C | 4,198,172 | 577,555 |
| Events in quadrant D | 7,385,499 | 465,273 |
| Mode SS | |||
|---|---|---|---|
| Quadrant | BADHDUFLAG | Total packets | Discarded packets |
| A | 0 | 130 | 0 |
| B | 0 | 130 | 0 |
| C | 0 | 130 | 0 |
| D | 0 | 130 | 0 |
| Mode M0 | |||
|---|---|---|---|
| Quadrant | BADHDUFLAG | Total packets | Discarded packets |
| A | 0 | 18899 | 3 |
| B | 0 | 14086 | 2 |
| C | 0 | 17163 | 2 |
| D | 0 | 26504 | 2 |
| Mode M9 | |||
|---|---|---|---|
| Quadrant | BADHDUFLAG | Total packets | Discarded packets |
| A | 0 | 19 | 0 |
| B | 0 | 19 | 0 |
| C | 0 | 20 | 0 |
| D | 0 | 20 | 0 |
| Quadrant | Total seconds | Saturated seconds | Saturation percentage |
|---|---|---|---|
| A | 6431 | 157 | 2.441300% |
| B | 6431 | 96 | 1.492769% |
| C | 6431 | 336 | 5.224693% |
| D | 6431 | 1300 | 20.214586% |
Noise dominated data is calculated using 1-second bins in cleaned event files. If a bin has >2000 counts, and if more than 50% of those come from <1% of pixels, then it is considered to be noise-dominated and hence unusable.
| Quadrant | # 1 sec bins | Bins with >0 counts | Bins with >2000 counts | High rate bins dominated by noise | Noise dominated (total time) | Noise dominated (detector-on time) | Marked lightcurve |
|---|---|---|---|---|---|---|---|
| A | 7561 | 6431 | 86 | 86 | 1.14% | 1.34% | 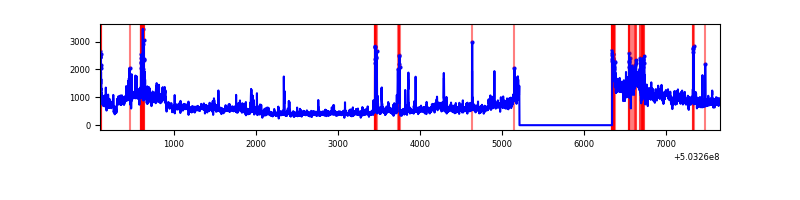 |
| B | 7561 | 6431 | 48 | 48 | 0.63% | 0.75% | 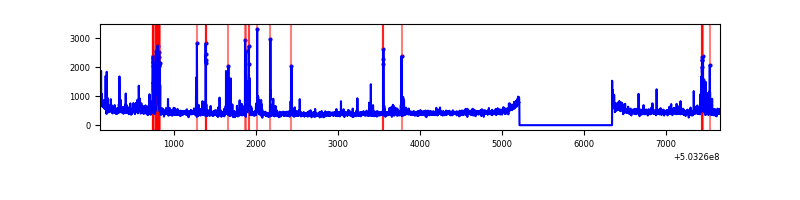 |
| C | 7561 | 6432 | 281 | 281 | 3.72% | 4.37% | 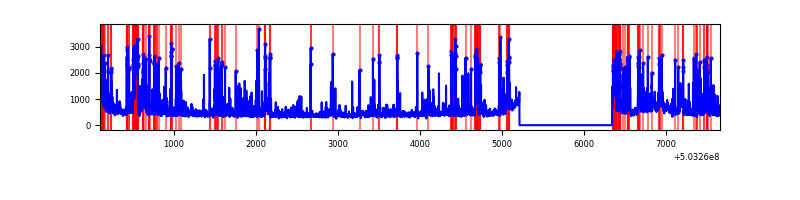 |
| D | 7561 | 6432 | 1267 | 1267 | 16.76% | 19.70% | 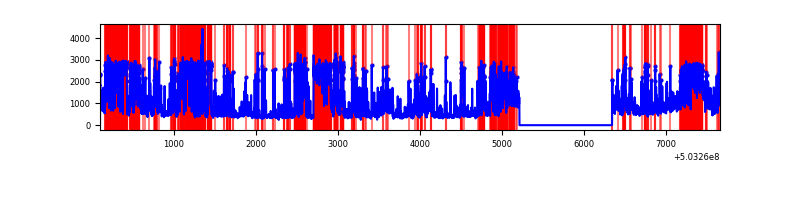 |
Top three noisy pixels from each quadrant. If the there are fewer than three noisy pixels in the level2.evt file, extra rows are filled as -1
| Pixel properties | Quadrant properties | ||||||
|---|---|---|---|---|---|---|---|
| Quadrant | DetID | PixID | Counts | Sigma | Mean | Median | Sigma |
| A | 5 | 113 | 1560080 | 9327.91 | 672 | 655 | 167.2 |
| A | 0 | 250 | 169362 | 1009.14 | 672 | 655 | 167.2 |
| A | 4 | 205 | 132402 | 788.06 | 672 | 655 | 167.2 |
| B | 10 | 245 | 110435 | 763.41 | 676 | 650 | 143.8 |
| B | 4 | 81 | 106882 | 738.7 | 676 | 650 | 143.8 |
| B | 2 | 249 | 69620 | 479.6 | 676 | 650 | 143.8 |
| C | 13 | 3 | 810548 | 4507.26 | 655 | 648 | 179.7 |
| C | 12 | 252 | 241219 | 1338.83 | 655 | 648 | 179.7 |
| C | 12 | 254 | 131537 | 728.42 | 655 | 648 | 179.7 |
| D | 2 | 249 | 3349863 | 19800.11 | 600 | 576 | 169.2 |
| D | 11 | 129 | 1083931 | 6404.51 | 600 | 576 | 169.2 |
| D | 3 | 12 | 258310 | 1523.66 | 600 | 576 | 169.2 |
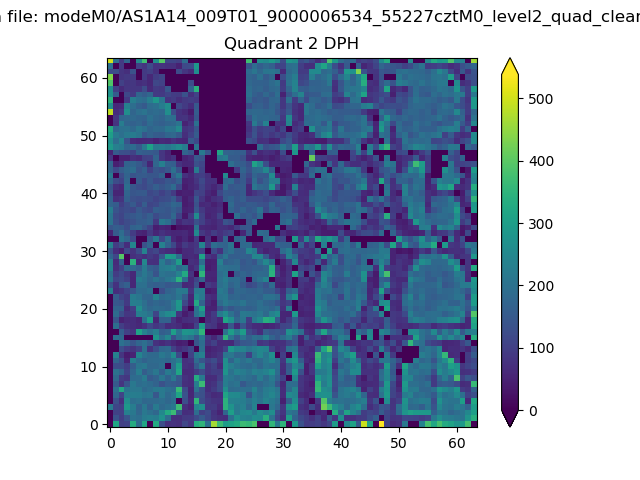
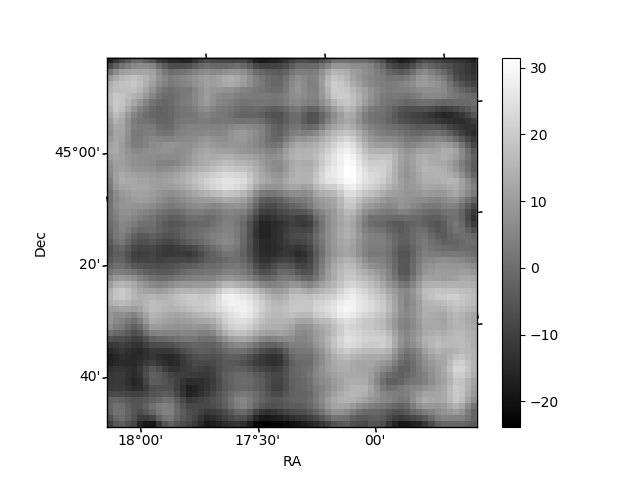
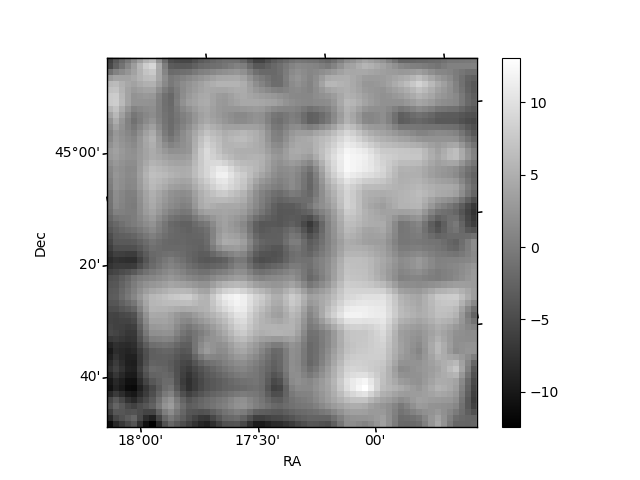
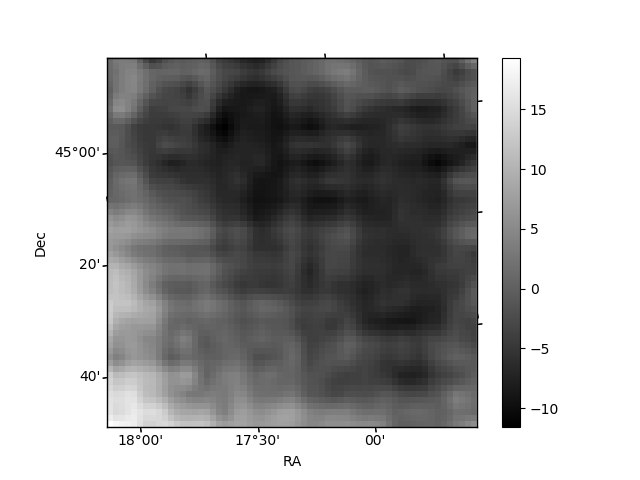
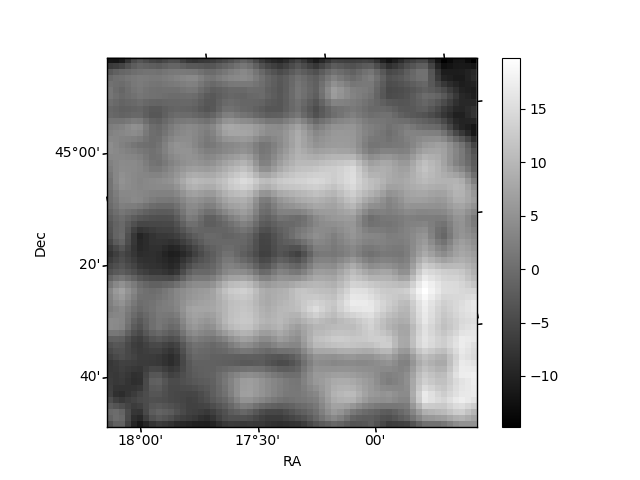
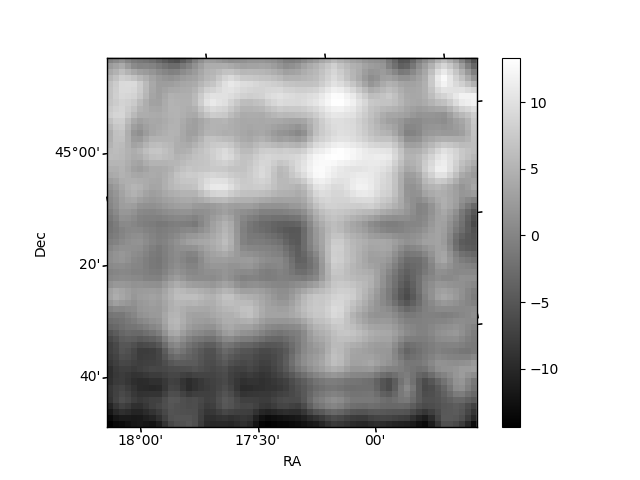
Histogram calculated using DETX and DETY for each event in the final _common_clean file
| Quadrant A | 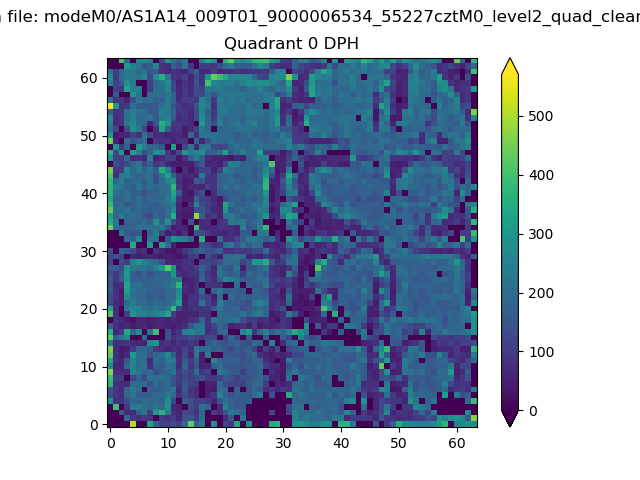 |
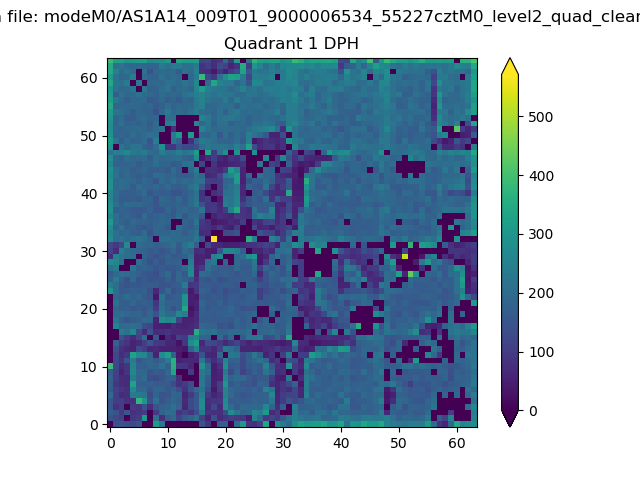 |
Quadrant B |
|---|---|---|---|
| Quadrant D | 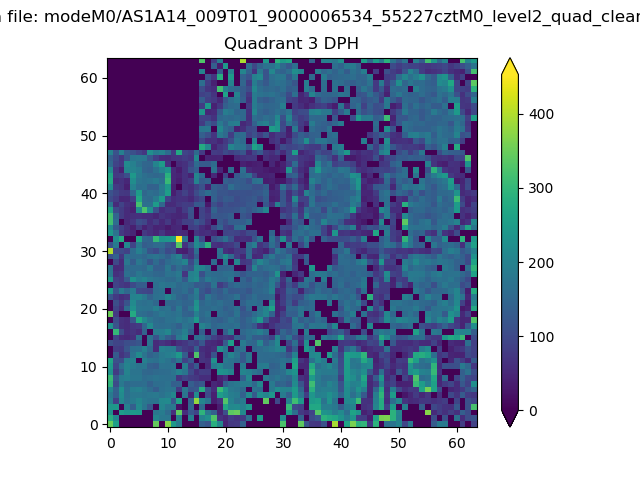 |
 |
Quadrant C |
| Plot type | Count rate plots | Images |
|---|---|---|
| Comparison with Poisson distribution Blue bars denote a histogram of data divided into 1 sec bins. Red curve is a Poisson curve with rate = median count rate of data. |
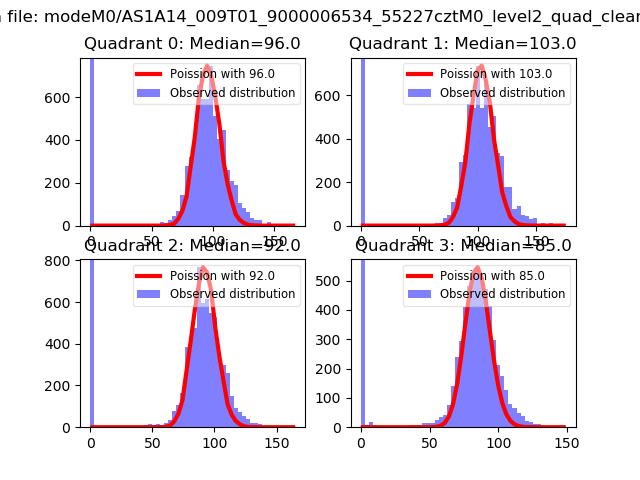 |
 |
| Quadrant-wise count rates Data is divided into 100 sec bins |
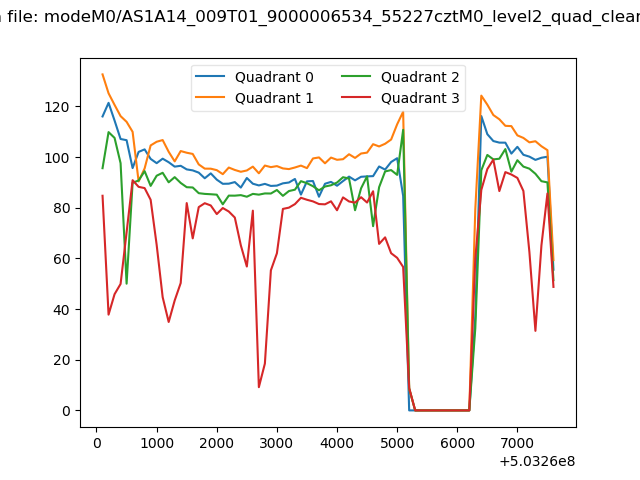 |
|
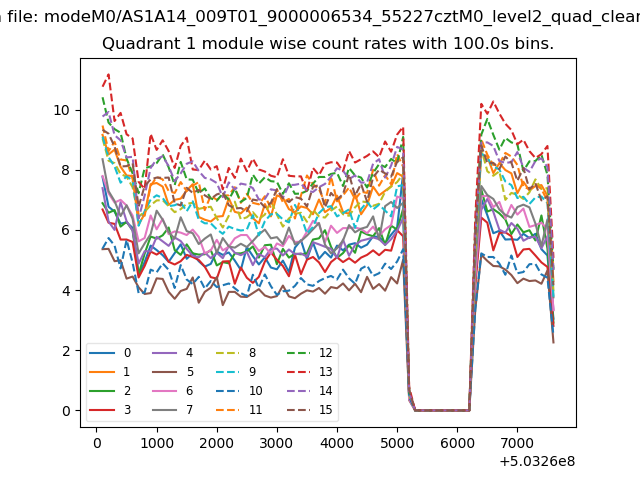
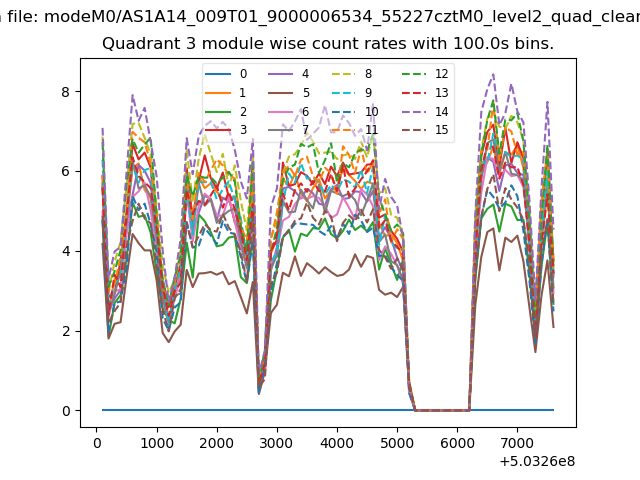
| Module-wise count rates for Quadrant A Data is divided into 100 sec bins |
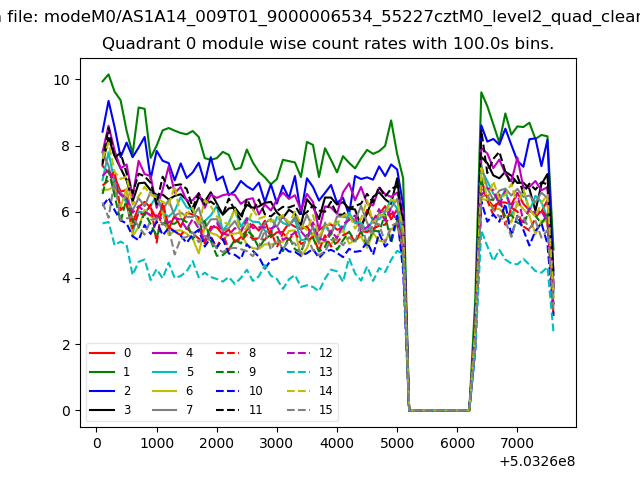 |
 |
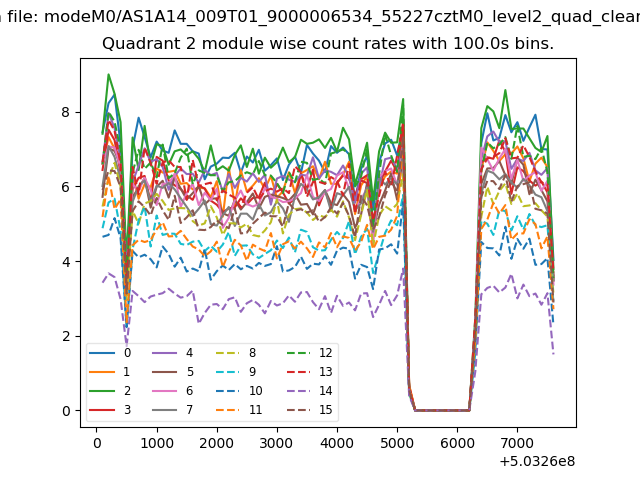
| Module-wise count rates for Quadrant B Data is divided into 100 sec bins |
 |
 |
| Module-wise count rates for Quadrant C Data is divided into 100 sec bins |
 |
 |
| Module-wise count rates for Quadrant D Data is divided into 100 sec bins |
 |
 |
| Parameter | Plot |
|---|---|
| CZT HV Monitor | 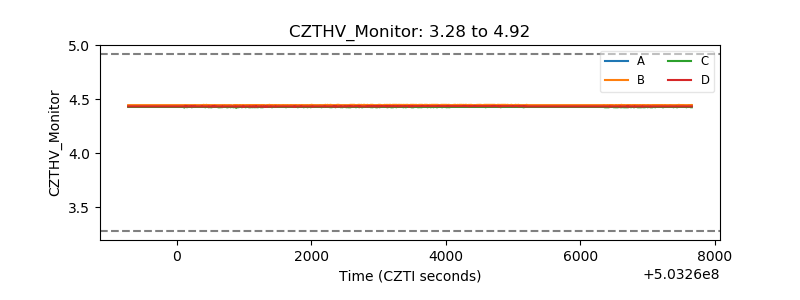 |
| D_VDD | 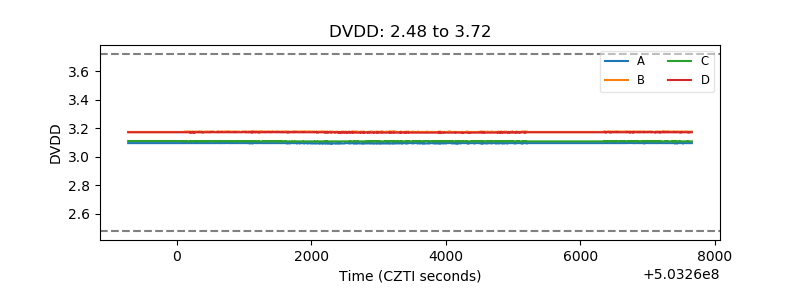 |
| Temperature 1 | 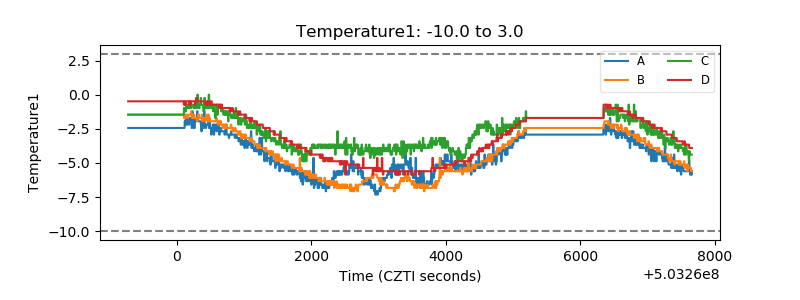 |
| Veto HV Monitor | 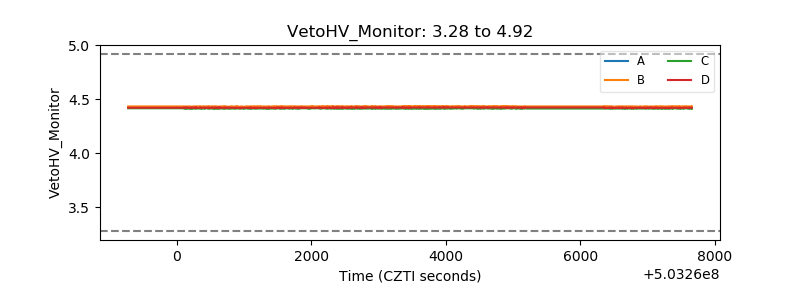 |
| Veto LLD | 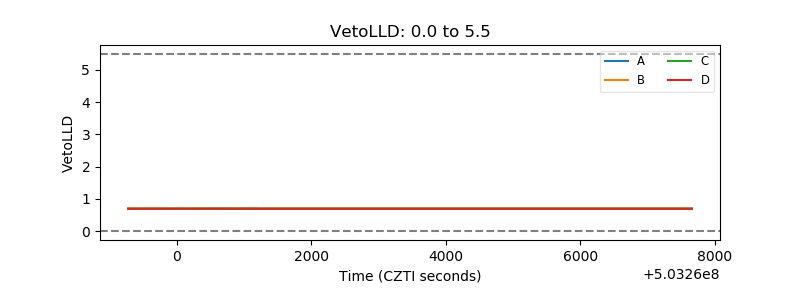 |
| Alpha Counter | 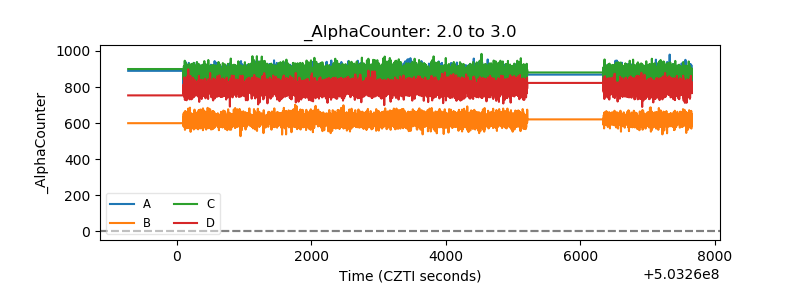 |
| _CPM_Rate | 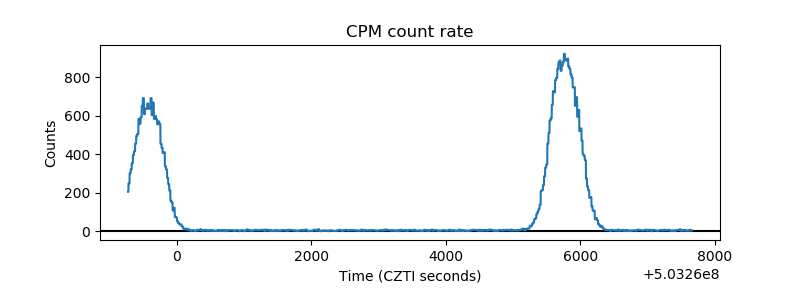 |
| CZT Counter | 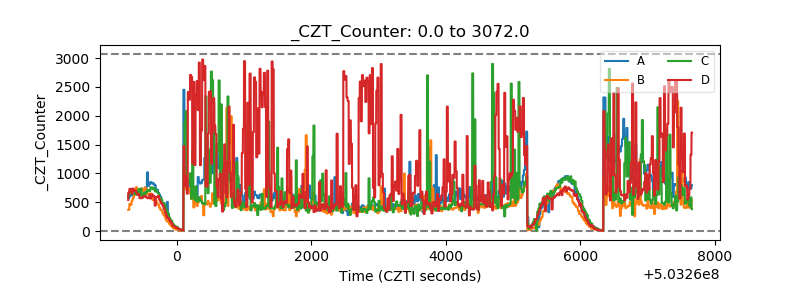 |
| +2.5 Volts monitor | 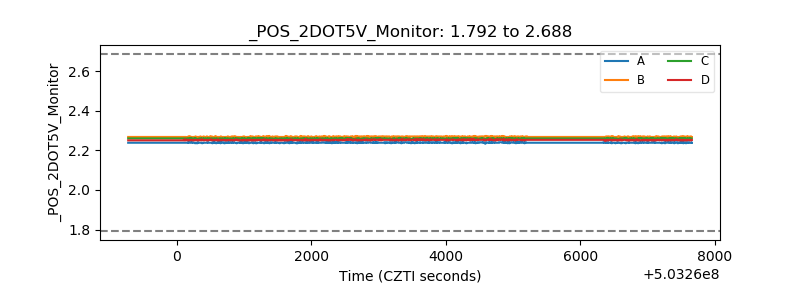 |
| +5 Volts monitor | 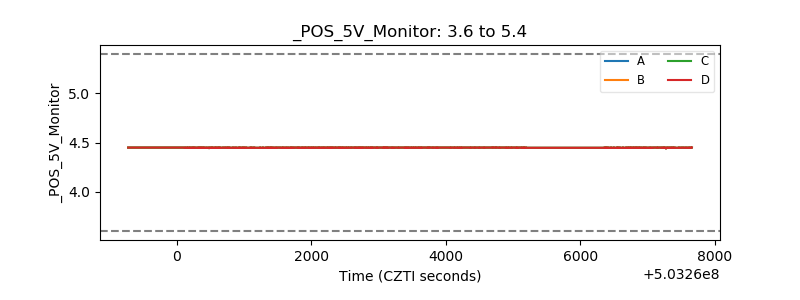 |
| _ROLL_ROT | 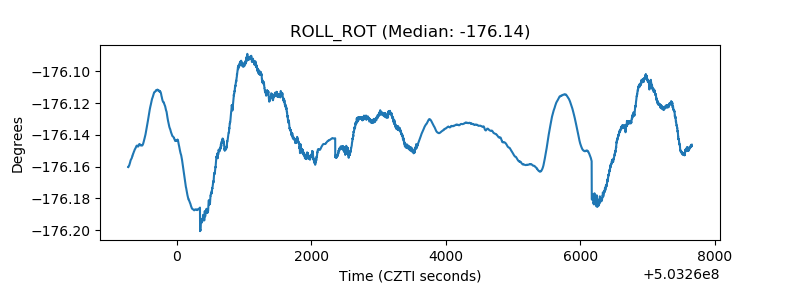 |
| _Roll_DEC | 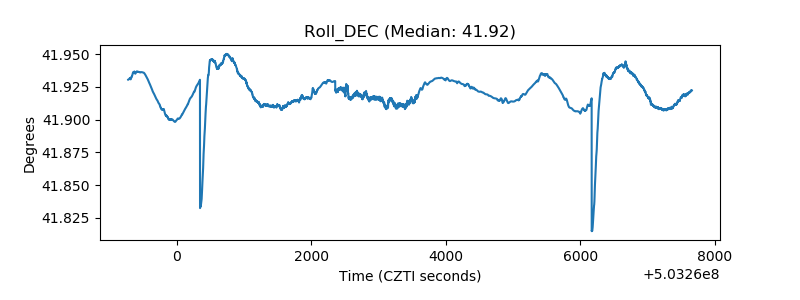 |
| _Roll_RA | 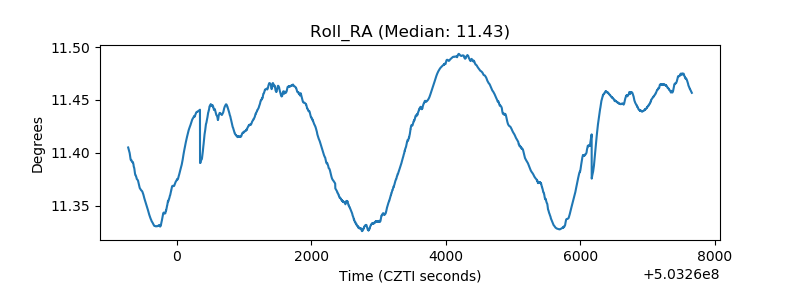 |
| Veto Counter | 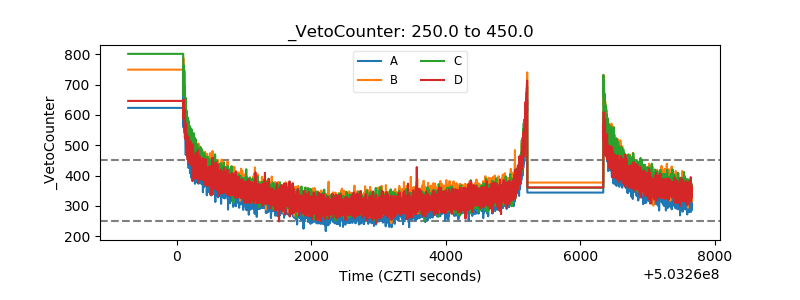 |