| Param | Original file | Final file |
|---|---|---|
| Filename | modeM0/AS1A14_009T01_9000006534_55228cztM0_level2.fits | modeM0/AS1A14_009T01_9000006534_55228cztM0_level2_quad_clean.evt |
| Size (bytes) | 559,509,120 | 91,391,040 |
| Size | 533.6 MB | 87.2 MB |
| Events in quadrant A | 4,892,873 | 610,040 |
| Events in quadrant B | 3,055,272 | 672,257 |
| Events in quadrant C | 6,725,941 | 496,944 |
| Events in quadrant D | 5,537,110 | 537,991 |
| Mode SS | |||
|---|---|---|---|
| Quadrant | BADHDUFLAG | Total packets | Discarded packets |
| A | 0 | 132 | 0 |
| B | 0 | 132 | 0 |
| C | 0 | 132 | 0 |
| D | 0 | 132 | 0 |
| Mode M0 | |||
|---|---|---|---|
| Quadrant | BADHDUFLAG | Total packets | Discarded packets |
| A | 0 | 18993 | 3 |
| B | 0 | 13781 | 2 |
| C | 0 | 24625 | 2 |
| D | 0 | 20959 | 2 |
| Mode M9 | |||
|---|---|---|---|
| Quadrant | BADHDUFLAG | Total packets | Discarded packets |
| A | 0 | 18 | 0 |
| B | 0 | 18 | 0 |
| C | 0 | 19 | 0 |
| D | 0 | 19 | 0 |
| Quadrant | Total seconds | Saturated seconds | Saturation percentage |
|---|---|---|---|
| A | 6446 | 237 | 3.676699% |
| B | 6446 | 67 | 1.039404% |
| C | 6446 | 1315 | 20.400248% |
| D | 6446 | 463 | 7.182749% |
Noise dominated data is calculated using 1-second bins in cleaned event files. If a bin has >2000 counts, and if more than 50% of those come from <1% of pixels, then it is considered to be noise-dominated and hence unusable.
| Quadrant | # 1 sec bins | Bins with >0 counts | Bins with >2000 counts | High rate bins dominated by noise | Noise dominated (total time) | Noise dominated (detector-on time) | Marked lightcurve |
|---|---|---|---|---|---|---|---|
| A | 7561 | 6447 | 211 | 211 | 2.79% | 3.27% | 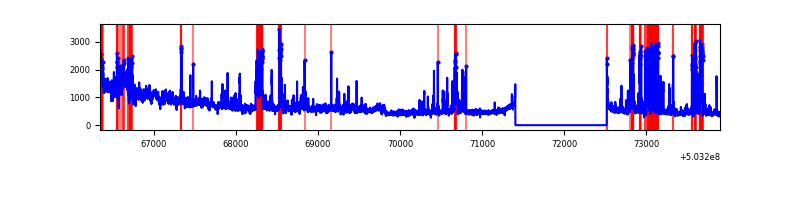 |
| B | 7561 | 6447 | 22 | 22 | 0.29% | 0.34% | 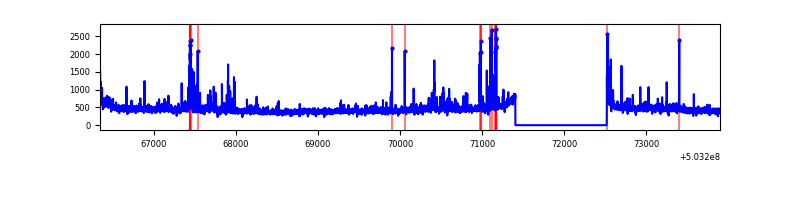 |
| C | 7561 | 6446 | 1153 | 1153 | 15.25% | 17.89% | 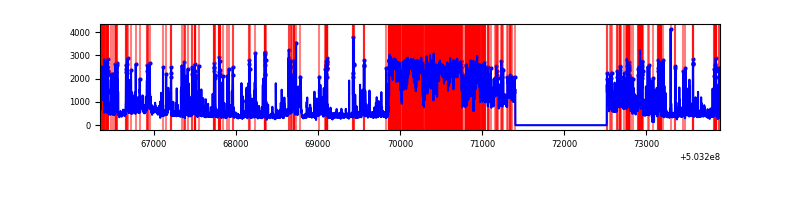 |
| D | 7561 | 6446 | 481 | 481 | 6.36% | 7.46% | 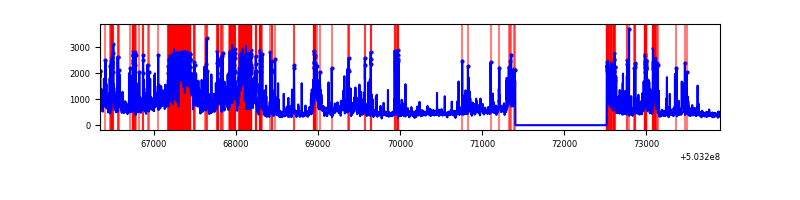 |
Top three noisy pixels from each quadrant. If the there are fewer than three noisy pixels in the level2.evt file, extra rows are filled as -1
| Pixel properties | Quadrant properties | ||||||
|---|---|---|---|---|---|---|---|
| Quadrant | DetID | PixID | Counts | Sigma | Mean | Median | Sigma |
| A | 5 | 113 | 1176158 | 7039.76 | 668 | 651 | 167.0 |
| A | 0 | 8 | 437613 | 2616.83 | 668 | 651 | 167.0 |
| A | 12 | 115 | 166009 | 990.28 | 668 | 651 | 167.0 |
| B | 2 | 249 | 114143 | 786.66 | 677 | 654 | 144.3 |
| B | 10 | 247 | 64346 | 441.49 | 677 | 654 | 144.3 |
| B | 10 | 245 | 54979 | 376.56 | 677 | 654 | 144.3 |
| C | 9 | 38 | 2116806 | 12418.47 | 616 | 611 | 170.4 |
| C | 12 | 252 | 693360 | 4065.26 | 616 | 611 | 170.4 |
| C | 13 | 3 | 692414 | 4059.71 | 616 | 611 | 170.4 |
| D | 11 | 129 | 1647129 | 8927.91 | 649 | 618 | 184.4 |
| D | 2 | 249 | 709520 | 3843.89 | 649 | 618 | 184.4 |
| D | 5 | 38 | 311165 | 1683.88 | 649 | 618 | 184.4 |
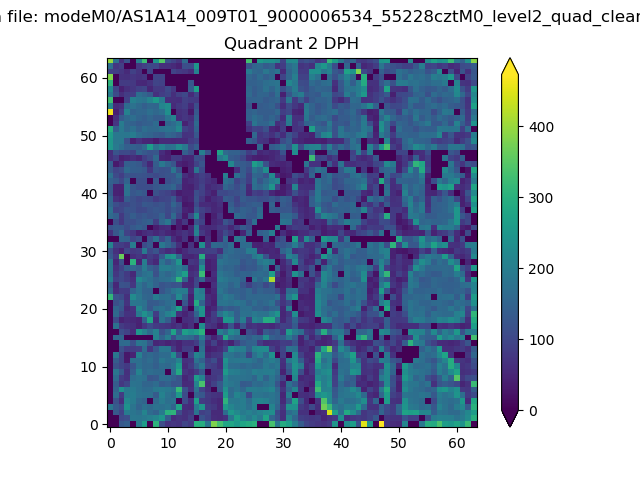
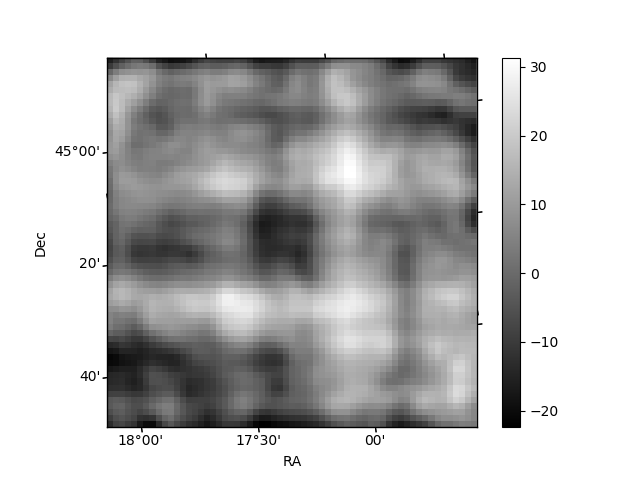
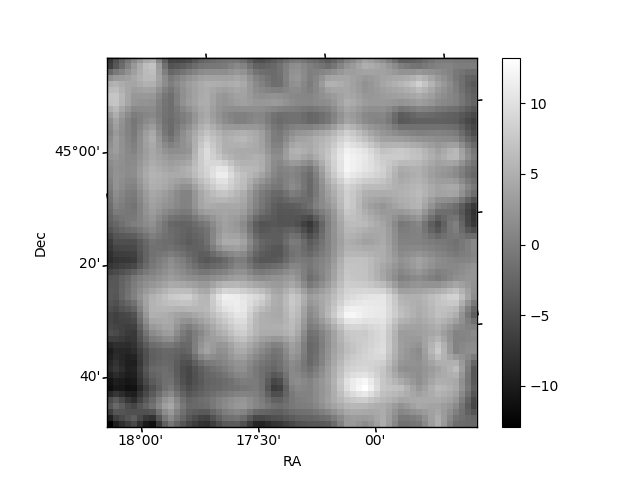
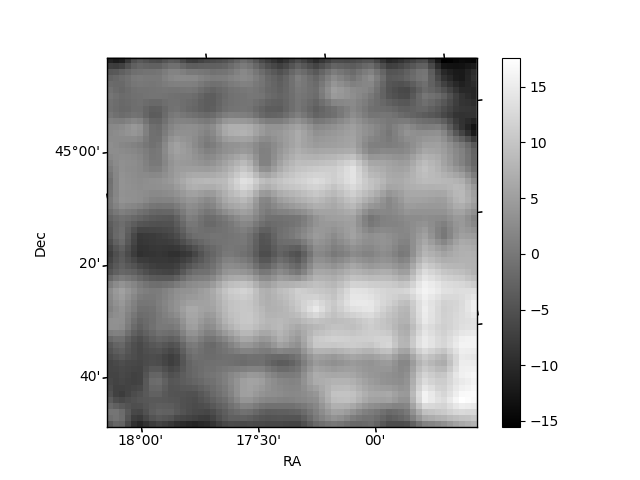
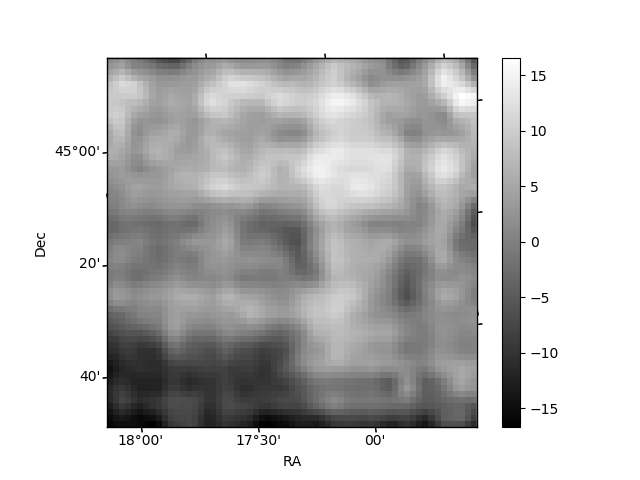
Histogram calculated using DETX and DETY for each event in the final _common_clean file
| Quadrant A | 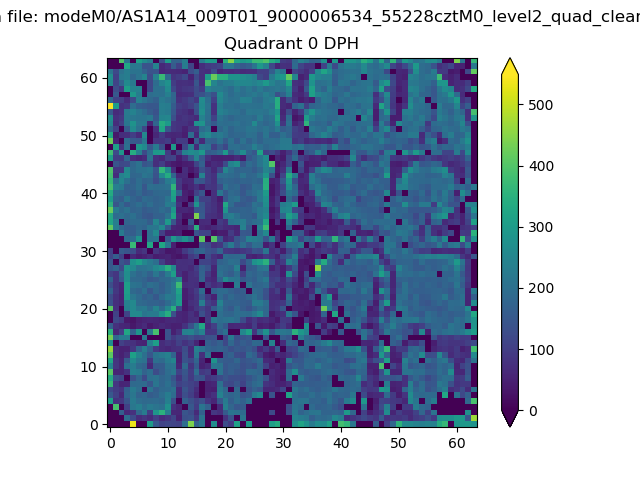 |
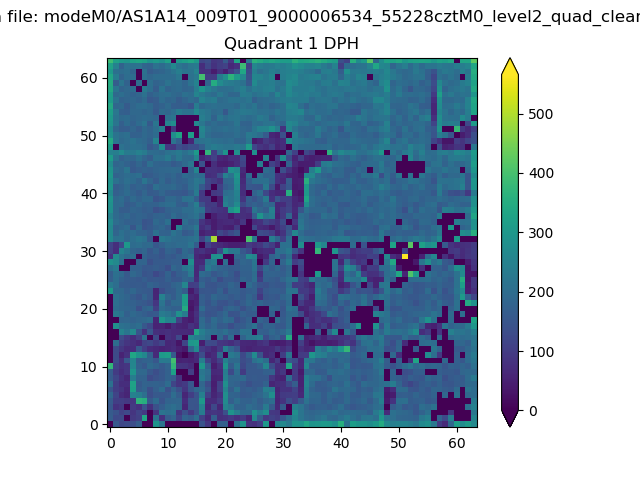 |
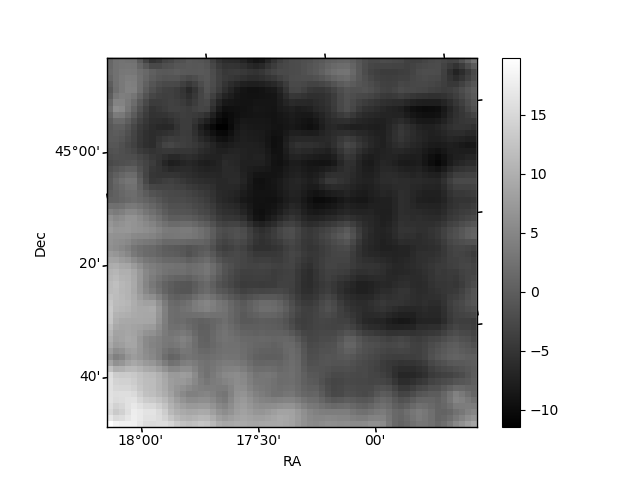
Quadrant B |
|---|---|---|---|
| Quadrant D | 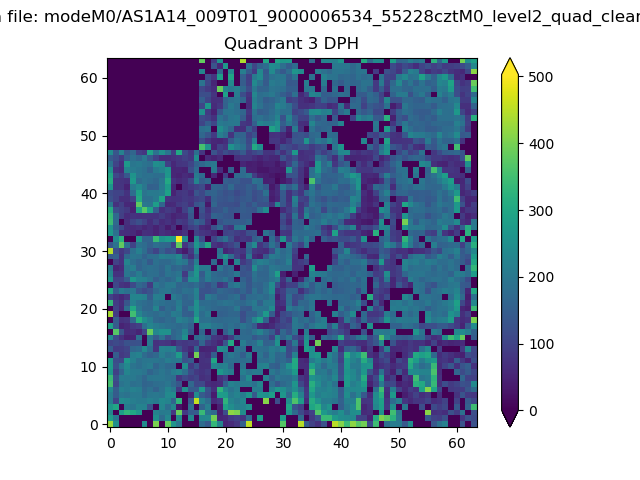 |
 |
Quadrant C |
| Plot type | Count rate plots | Images |
|---|---|---|
| Comparison with Poisson distribution Blue bars denote a histogram of data divided into 1 sec bins. Red curve is a Poisson curve with rate = median count rate of data. |
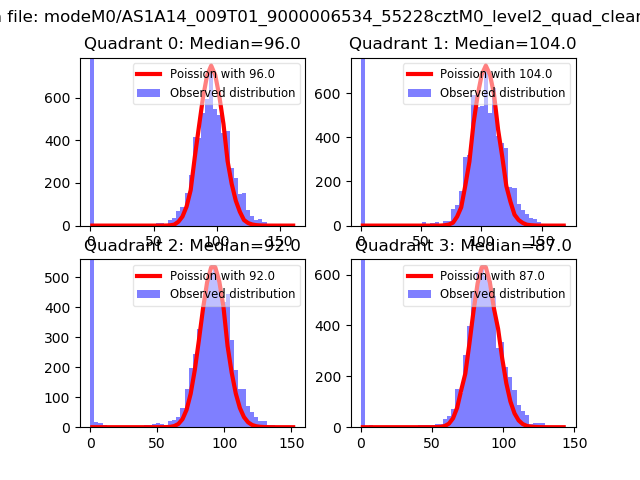 |
 |
| Quadrant-wise count rates Data is divided into 100 sec bins |
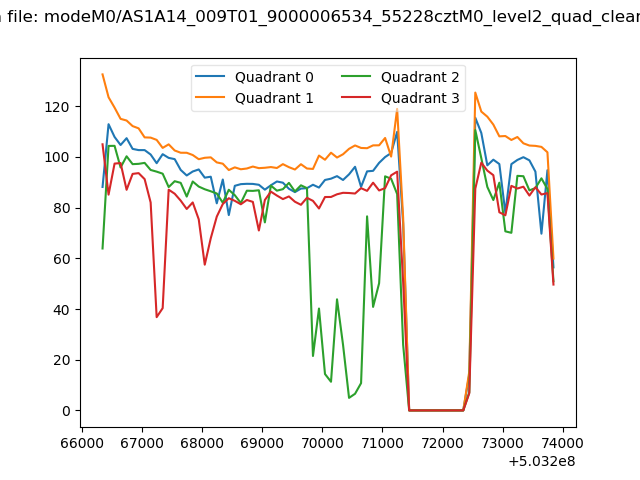 |
|
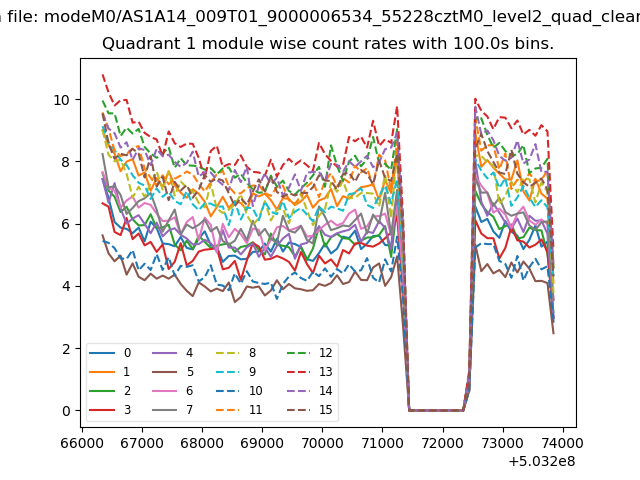
| Module-wise count rates for Quadrant A Data is divided into 100 sec bins |
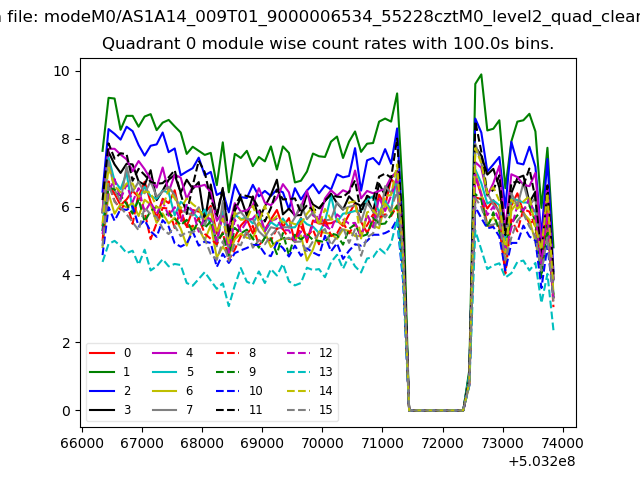 |
 |
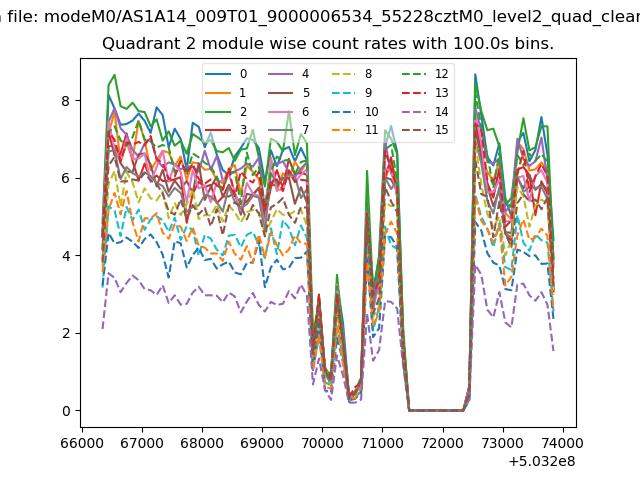
| Module-wise count rates for Quadrant B Data is divided into 100 sec bins |
 |
 |
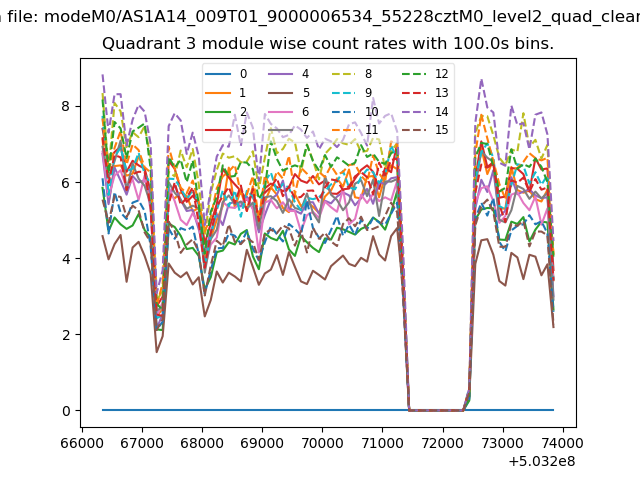
| Module-wise count rates for Quadrant C Data is divided into 100 sec bins |
 |
 |
| Module-wise count rates for Quadrant D Data is divided into 100 sec bins |
 |
 |
| Parameter | Plot |
|---|---|
| CZT HV Monitor |  |
| D_VDD | 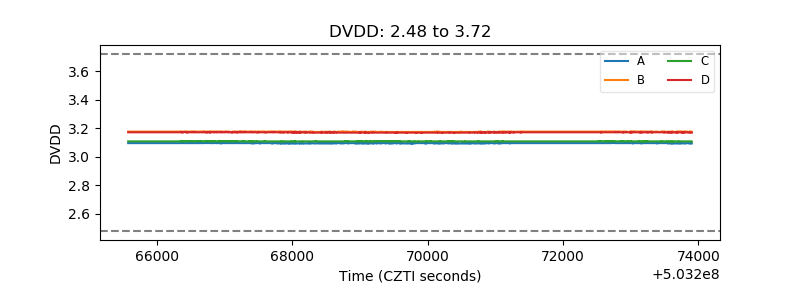 |
| Temperature 1 | 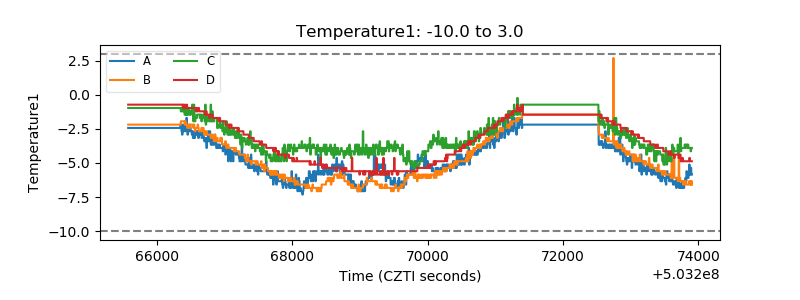 |
| Veto HV Monitor | 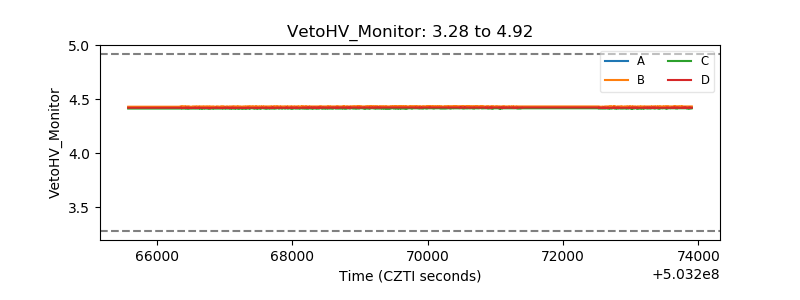 |
| Veto LLD | 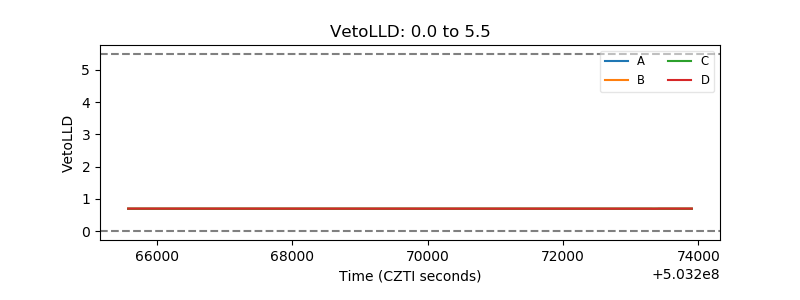 |
| Alpha Counter | 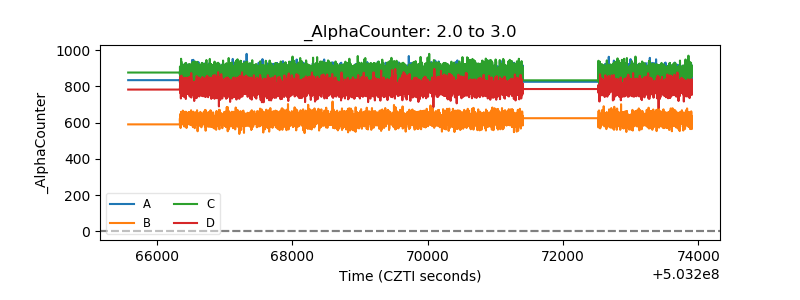 |
| _CPM_Rate | 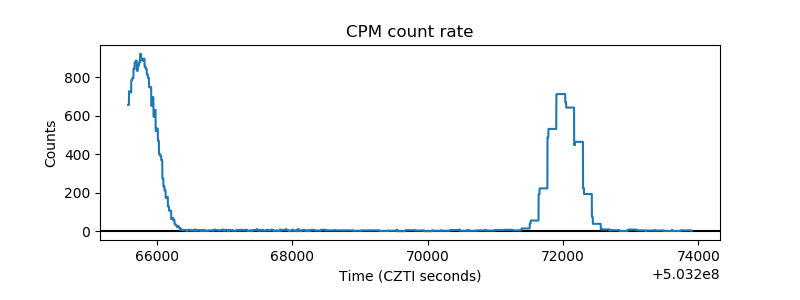 |
| CZT Counter | 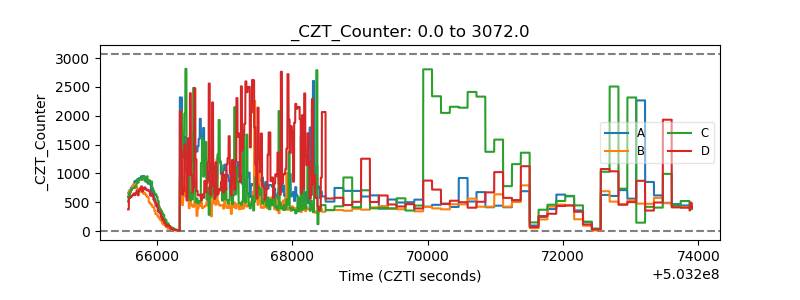 |
| +2.5 Volts monitor |  |
| +5 Volts monitor |  |
| _ROLL_ROT | 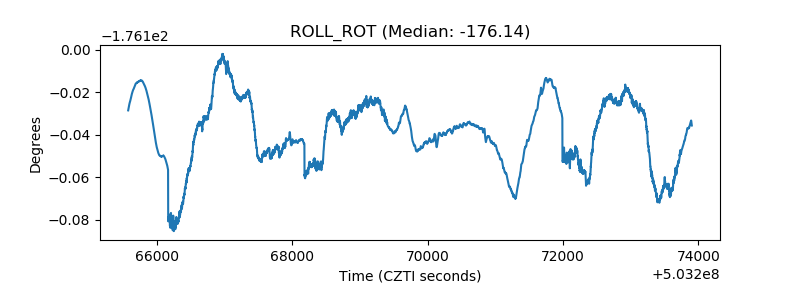 |
| _Roll_DEC | 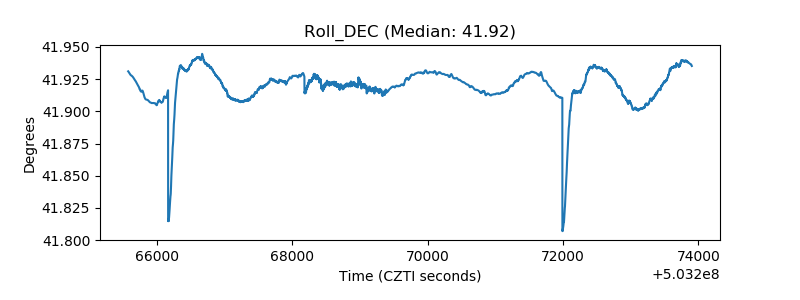 |
| _Roll_RA | 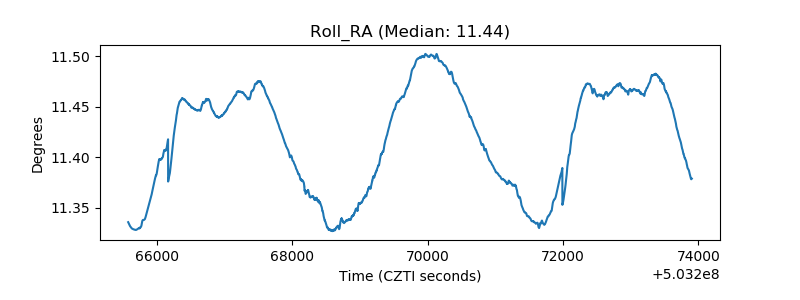 |
| Veto Counter | 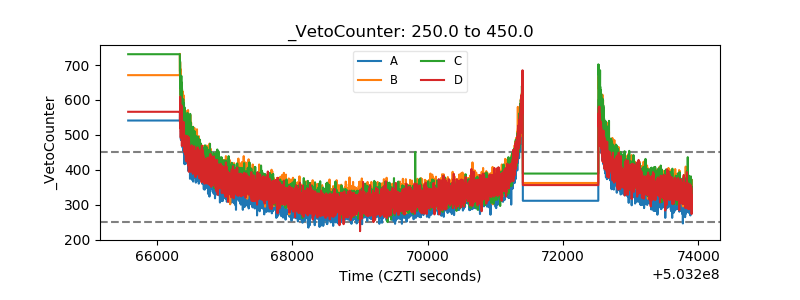 |