| Param | Original file | Final file |
|---|---|---|
| Filename | modeM0/AS1A14_009T01_9000006534_55229cztM0_level2.fits | modeM0/AS1A14_009T01_9000006534_55229cztM0_level2_quad_clean.evt |
| Size (bytes) | 462,075,840 | 94,294,080 |
| Size | 440.7 MB | 89.9 MB |
| Events in quadrant A | 3,594,392 | 614,909 |
| Events in quadrant B | 2,946,635 | 675,154 |
| Events in quadrant C | 5,210,665 | 560,612 |
| Events in quadrant D | 4,842,287 | 546,474 |
| Mode SS | |||
|---|---|---|---|
| Quadrant | BADHDUFLAG | Total packets | Discarded packets |
| A | 0 | 134 | 0 |
| B | 0 | 134 | 0 |
| C | 0 | 134 | 0 |
| D | 0 | 134 | 0 |
| Mode M0 | |||
|---|---|---|---|
| Quadrant | BADHDUFLAG | Total packets | Discarded packets |
| A | 0 | 15518 | 2 |
| B | 0 | 13720 | 3 |
| C | 0 | 20177 | 2 |
| D | 0 | 19101 | 2 |
| Mode M9 | |||
|---|---|---|---|
| Quadrant | BADHDUFLAG | Total packets | Discarded packets |
| A | 0 | 19 | 0 |
| B | 0 | 20 | 0 |
| C | 0 | 20 | 0 |
| D | 0 | 20 | 0 |
| Quadrant | Total seconds | Saturated seconds | Saturation percentage |
|---|---|---|---|
| A | 6568 | 198 | 3.014616% |
| B | 6567 | 43 | 0.654789% |
| C | 6567 | 619 | 9.425917% |
| D | 6567 | 313 | 4.766256% |
Noise dominated data is calculated using 1-second bins in cleaned event files. If a bin has >2000 counts, and if more than 50% of those come from <1% of pixels, then it is considered to be noise-dominated and hence unusable.
| Quadrant | # 1 sec bins | Bins with >0 counts | Bins with >2000 counts | High rate bins dominated by noise | Noise dominated (total time) | Noise dominated (detector-on time) | Marked lightcurve |
|---|---|---|---|---|---|---|---|
| A | 7693 | 6569 | 172 | 172 | 2.24% | 2.62% | 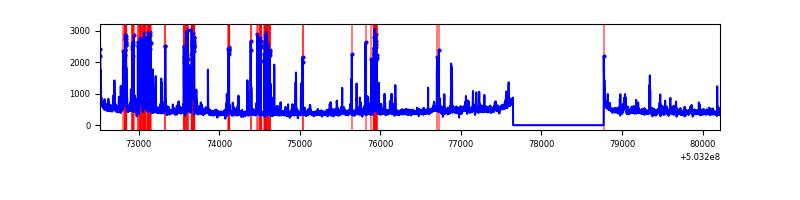 |
| B | 7692 | 6568 | 11 | 11 | 0.14% | 0.17% | 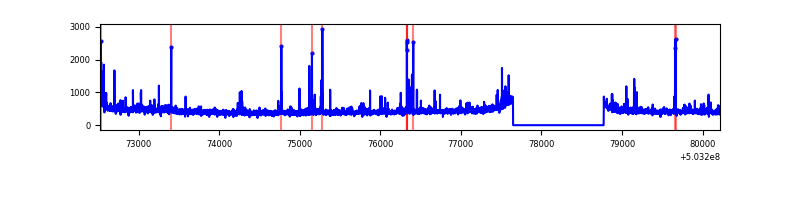 |
| C | 7692 | 6568 | 527 | 527 | 6.85% | 8.02% | 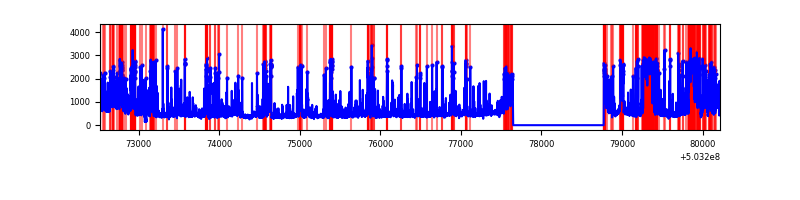 |
| D | 7692 | 6568 | 311 | 311 | 4.04% | 4.74% | 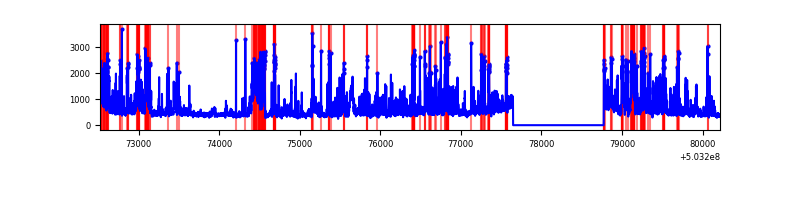 |
Top three noisy pixels from each quadrant. If the there are fewer than three noisy pixels in the level2.evt file, extra rows are filled as -1
| Pixel properties | Quadrant properties | ||||||
|---|---|---|---|---|---|---|---|
| Quadrant | DetID | PixID | Counts | Sigma | Mean | Median | Sigma |
| A | 0 | 8 | 518432 | 3095.88 | 676 | 657 | 167.2 |
| A | 4 | 205 | 198563 | 1183.32 | 676 | 657 | 167.2 |
| A | 4 | 3 | 58591 | 346.4 | 676 | 657 | 167.2 |
| B | 10 | 247 | 52991 | 358.4 | 682 | 658 | 146.0 |
| B | 10 | 245 | 43485 | 293.3 | 682 | 658 | 146.0 |
| B | 5 | 185 | 39039 | 262.85 | 682 | 658 | 146.0 |
| C | 12 | 254 | 575547 | 3240.87 | 645 | 640 | 177.4 |
| C | 13 | 3 | 499158 | 2810.25 | 645 | 640 | 177.4 |
| C | 12 | 252 | 428949 | 2414.47 | 645 | 640 | 177.4 |
| D | 11 | 129 | 1475412 | 7998.72 | 651 | 624 | 184.4 |
| D | 2 | 249 | 371783 | 2013.03 | 651 | 624 | 184.4 |
| D | 2 | 31 | 183341 | 990.99 | 651 | 624 | 184.4 |
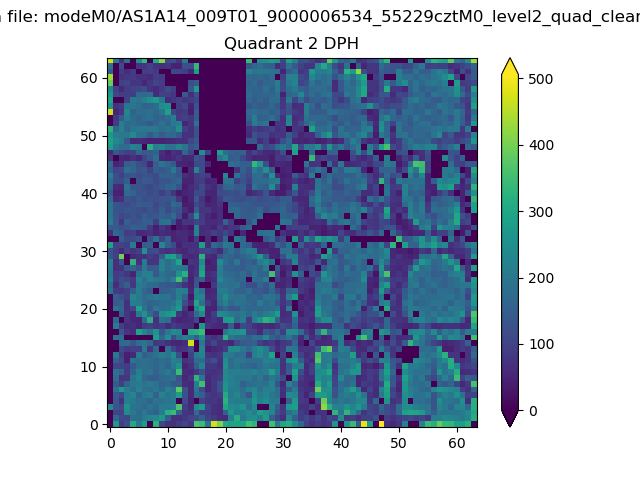
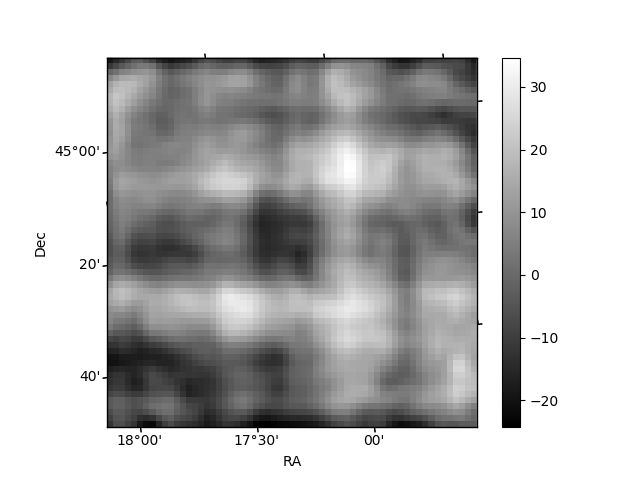
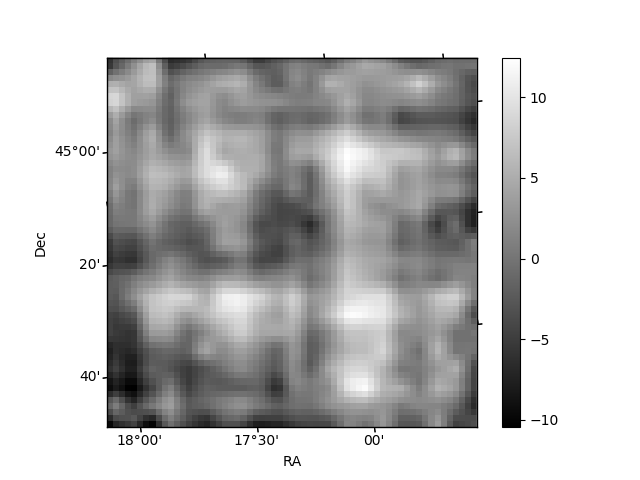
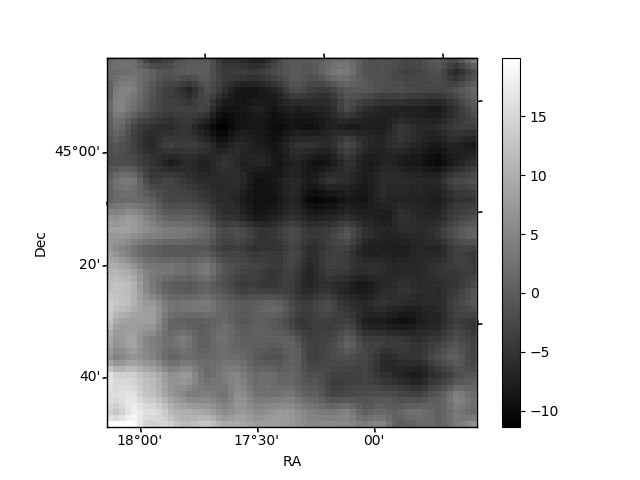
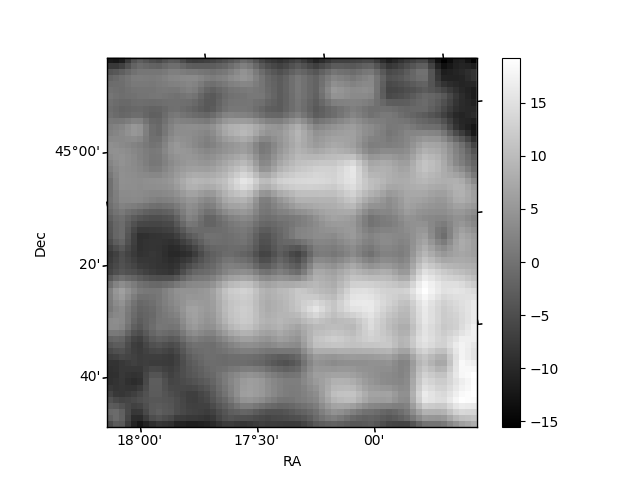
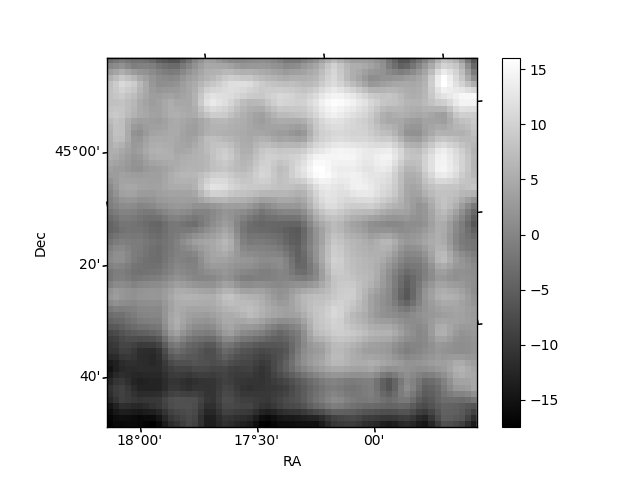
Histogram calculated using DETX and DETY for each event in the final _common_clean file
| Quadrant A | 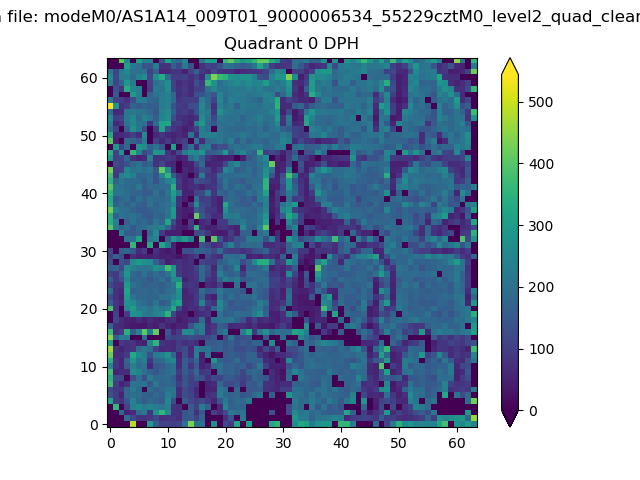 |
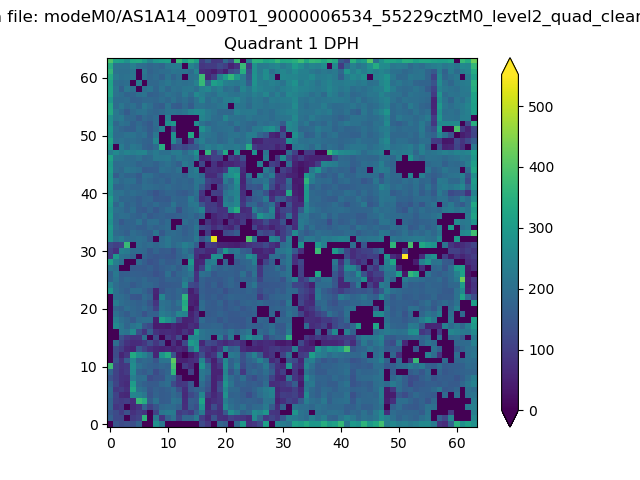 |
Quadrant B |
|---|---|---|---|
| Quadrant D | 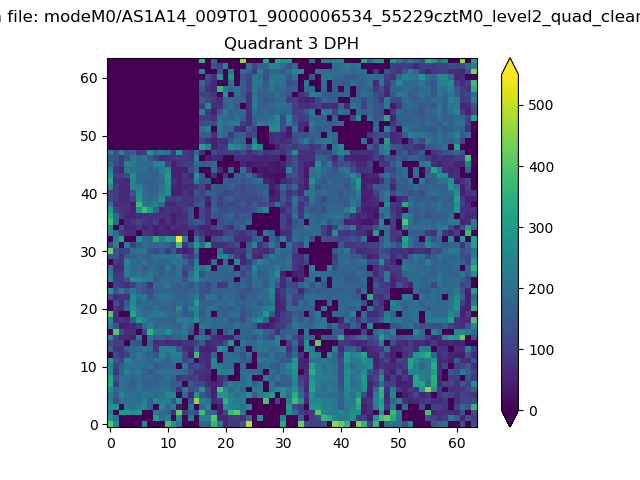 |
 |
Quadrant C |
| Plot type | Count rate plots | Images |
|---|---|---|
| Comparison with Poisson distribution Blue bars denote a histogram of data divided into 1 sec bins. Red curve is a Poisson curve with rate = median count rate of data. |
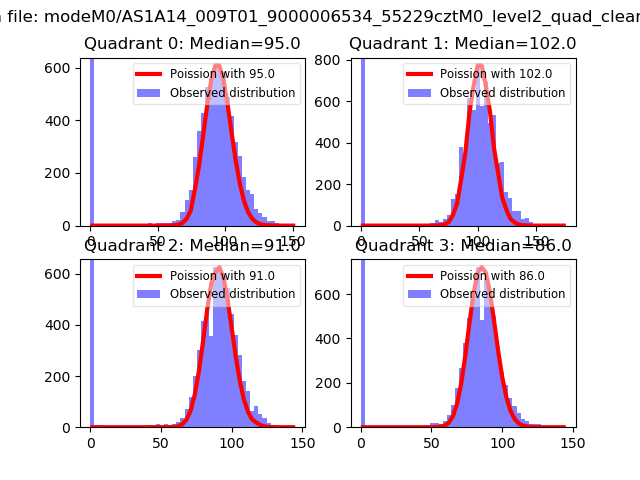 |
 |
| Quadrant-wise count rates Data is divided into 100 sec bins |
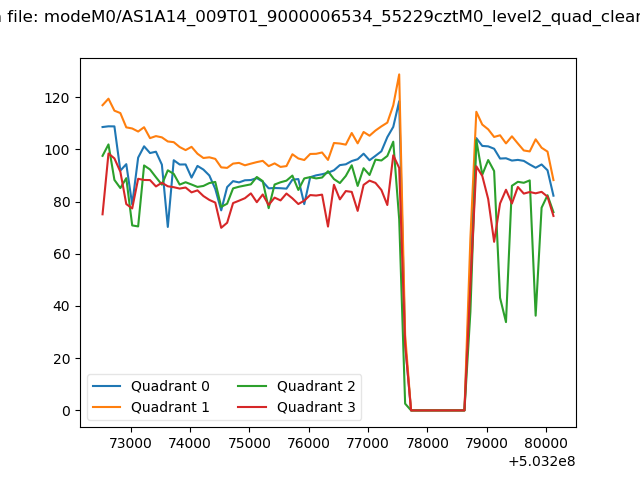 |
|
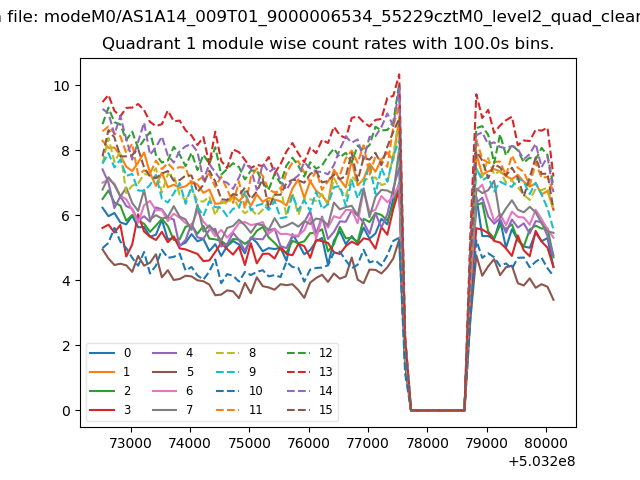
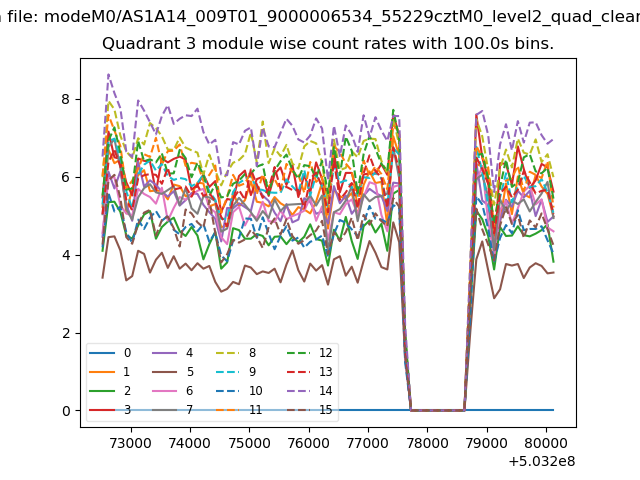
| Module-wise count rates for Quadrant A Data is divided into 100 sec bins |
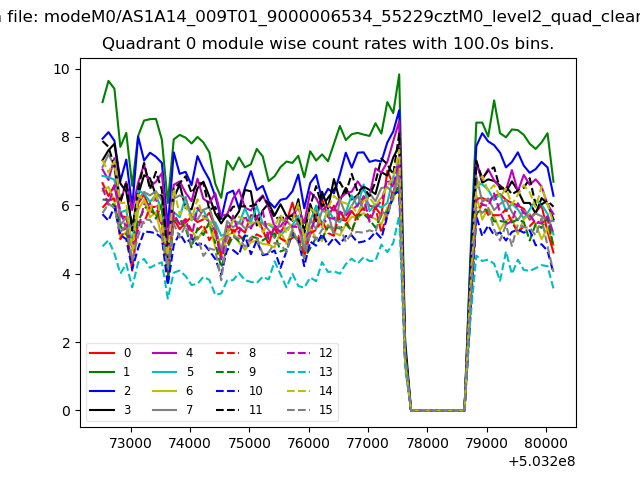 |
 |
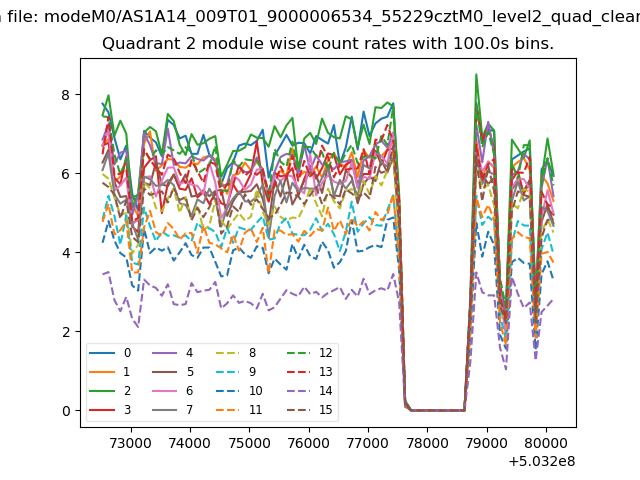
| Module-wise count rates for Quadrant B Data is divided into 100 sec bins |
 |
 |
| Module-wise count rates for Quadrant C Data is divided into 100 sec bins |
 |
 |
| Module-wise count rates for Quadrant D Data is divided into 100 sec bins |
 |
 |
| Parameter | Plot |
|---|---|
| CZT HV Monitor | 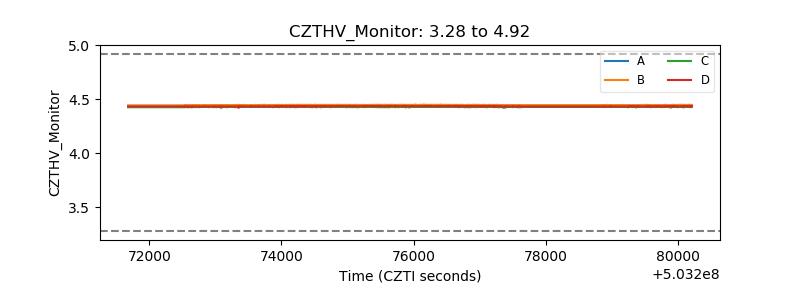 |
| D_VDD | 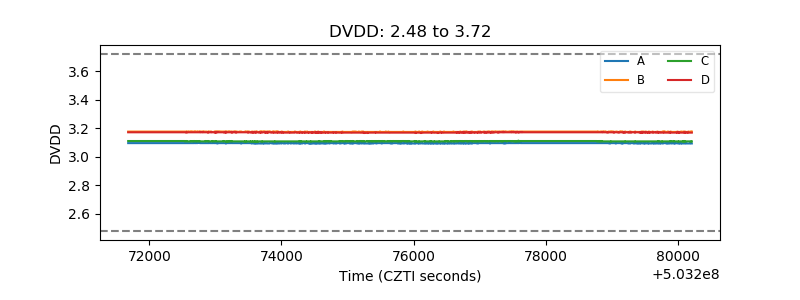 |
| Temperature 1 | 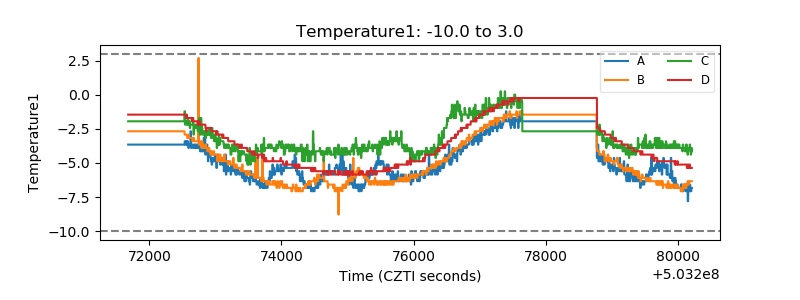 |
| Veto HV Monitor | 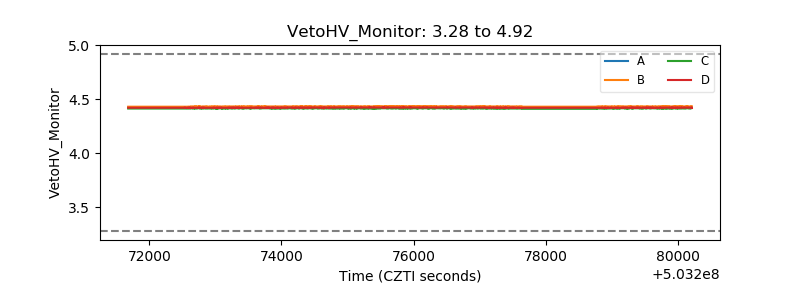 |
| Veto LLD | 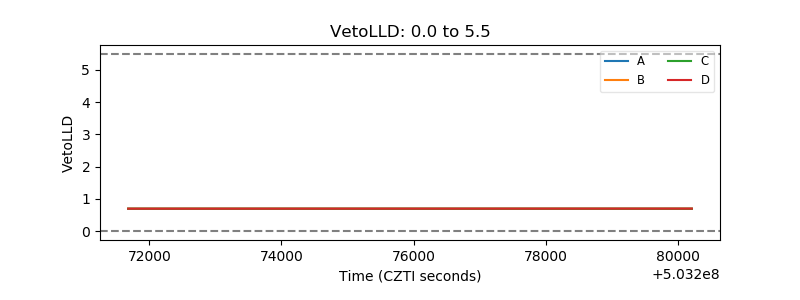 |
| Alpha Counter | 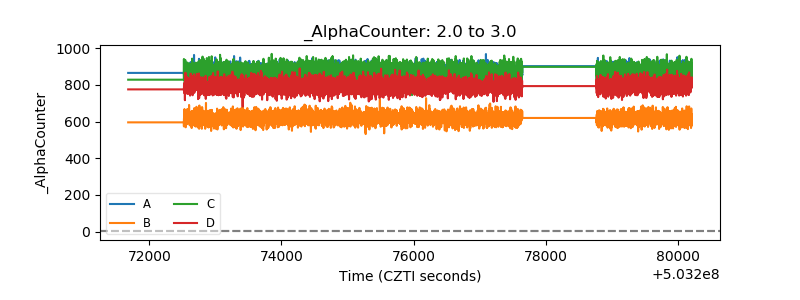 |
| _CPM_Rate | 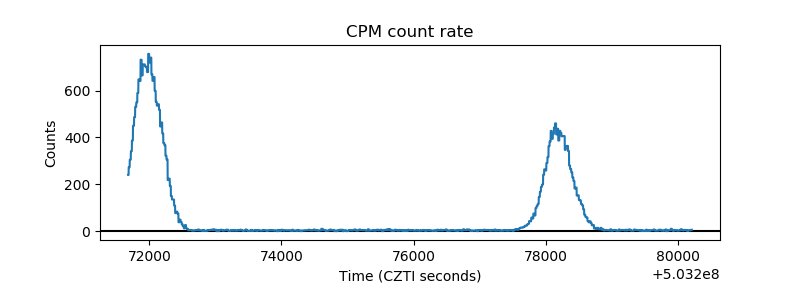 |
| CZT Counter | 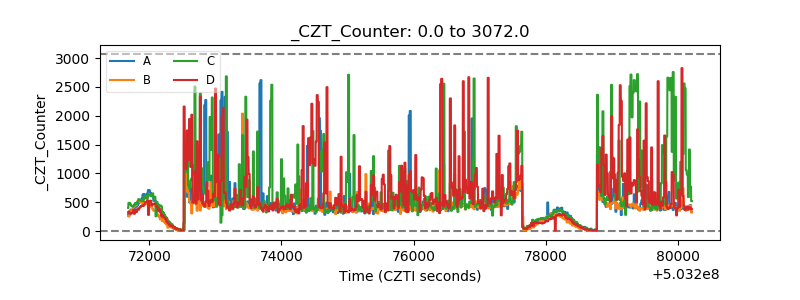 |
| +2.5 Volts monitor | 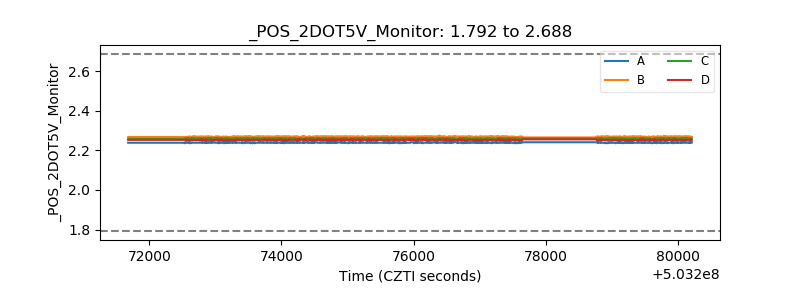 |
| +5 Volts monitor | 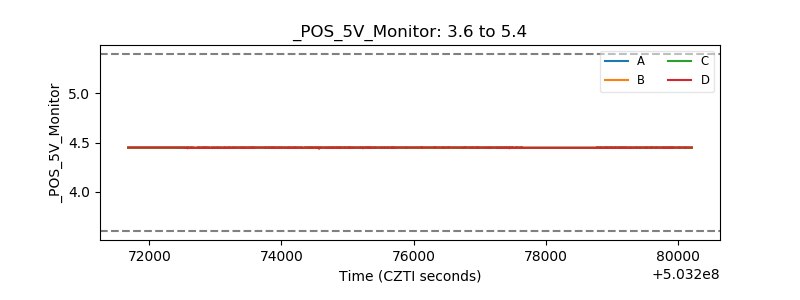 |
| _ROLL_ROT | 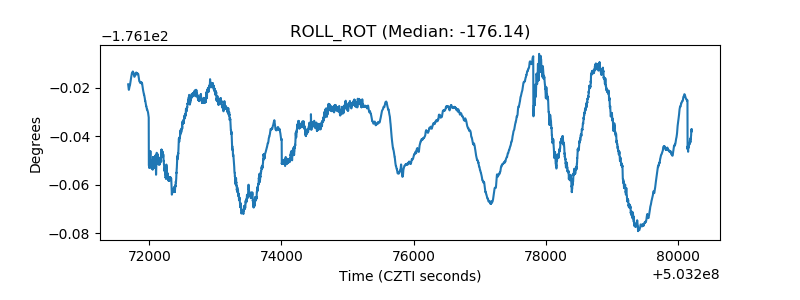 |
| _Roll_DEC | 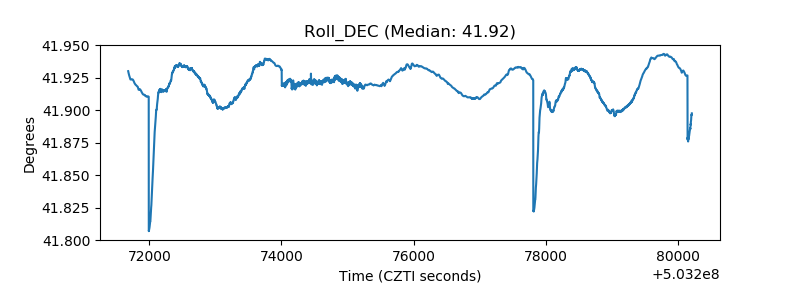 |
| _Roll_RA | 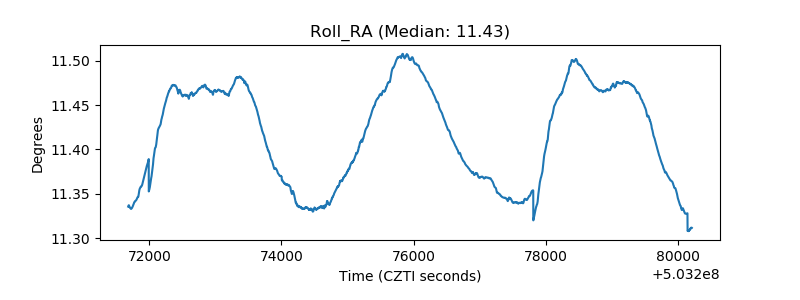 |
| Veto Counter | 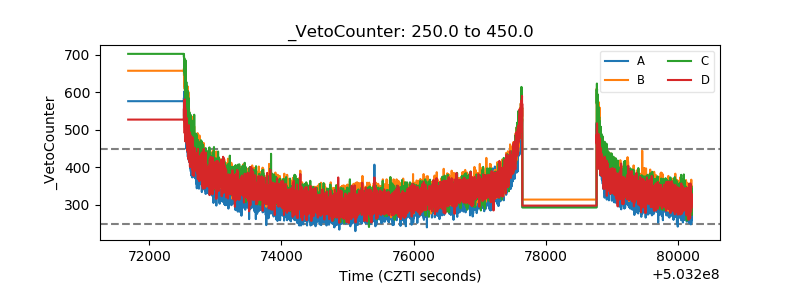 |