| Param | Original file | Final file |
|---|---|---|
| Filename | modeM0/AS1A14_009T01_9000006534_55230cztM0_level2.fits | modeM0/AS1A14_009T01_9000006534_55230cztM0_level2_quad_clean.evt |
| Size (bytes) | 475,073,280 | 96,111,360 |
| Size | 453.1 MB | 91.7 MB |
| Events in quadrant A | 3,623,604 | 632,130 |
| Events in quadrant B | 3,125,854 | 676,346 |
| Events in quadrant C | 5,346,656 | 571,651 |
| Events in quadrant D | 4,965,686 | 559,703 |
| Mode SS | |||
|---|---|---|---|
| Quadrant | BADHDUFLAG | Total packets | Discarded packets |
| A | 0 | 138 | 0 |
| B | 0 | 138 | 0 |
| C | 0 | 138 | 0 |
| D | 0 | 138 | 0 |
| Mode M0 | |||
|---|---|---|---|
| Quadrant | BADHDUFLAG | Total packets | Discarded packets |
| A | 0 | 15816 | 3 |
| B | 0 | 14535 | 2 |
| C | 0 | 20540 | 2 |
| D | 0 | 19634 | 2 |
| Mode M9 | |||
|---|---|---|---|
| Quadrant | BADHDUFLAG | Total packets | Discarded packets |
| A | 0 | 11 | 0 |
| B | 0 | 12 | 0 |
| C | 0 | 12 | 0 |
| D | 0 | 12 | 0 |
| Quadrant | Total seconds | Saturated seconds | Saturation percentage |
|---|---|---|---|
| A | 6742 | 111 | 1.646396% |
| B | 6742 | 126 | 1.868882% |
| C | 6742 | 532 | 7.890834% |
| D | 6742 | 338 | 5.013349% |
Noise dominated data is calculated using 1-second bins in cleaned event files. If a bin has >2000 counts, and if more than 50% of those come from <1% of pixels, then it is considered to be noise-dominated and hence unusable.
| Quadrant | # 1 sec bins | Bins with >0 counts | Bins with >2000 counts | High rate bins dominated by noise | Noise dominated (total time) | Noise dominated (detector-on time) | Marked lightcurve |
|---|---|---|---|---|---|---|---|
| A | 7712 | 6742 | 103 | 103 | 1.34% | 1.53% | 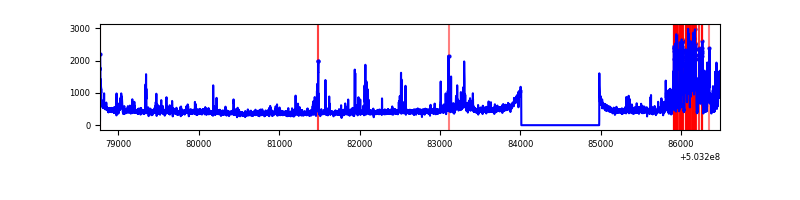 |
| B | 7712 | 6742 | 67 | 67 | 0.87% | 0.99% | 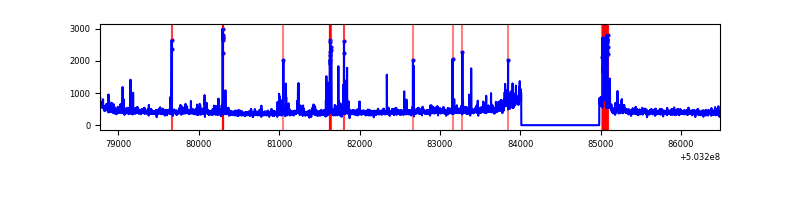 |
| C | 7712 | 6743 | 524 | 524 | 6.79% | 7.77% | 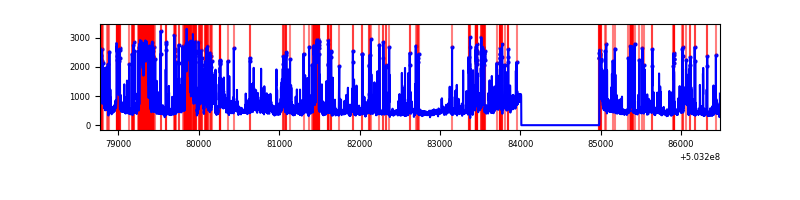 |
| D | 7712 | 6742 | 310 | 310 | 4.02% | 4.60% | 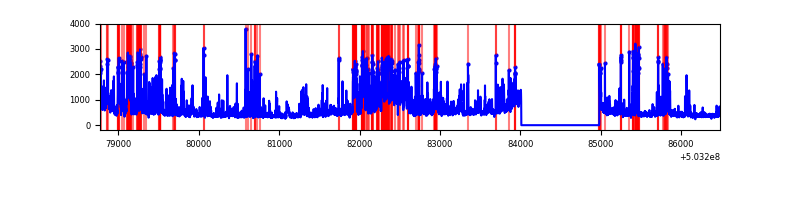 |
Top three noisy pixels from each quadrant. If the there are fewer than three noisy pixels in the level2.evt file, extra rows are filled as -1
| Pixel properties | Quadrant properties | ||||||
|---|---|---|---|---|---|---|---|
| Quadrant | DetID | PixID | Counts | Sigma | Mean | Median | Sigma |
| A | 12 | 115 | 594782 | 3452.97 | 700 | 685 | 172.1 |
| A | 4 | 205 | 184726 | 1069.67 | 700 | 685 | 172.1 |
| A | 3 | 14 | 45801 | 262.22 | 700 | 685 | 172.1 |
| B | 2 | 249 | 131726 | 883.14 | 693 | 667 | 148.4 |
| B | 10 | 247 | 88871 | 594.36 | 693 | 667 | 148.4 |
| B | 0 | 182 | 47253 | 313.92 | 693 | 667 | 148.4 |
| C | 7 | 220 | 548615 | 3028.74 | 660 | 655 | 180.9 |
| C | 10 | 22 | 496260 | 2739.36 | 660 | 655 | 180.9 |
| C | 12 | 252 | 472113 | 2605.89 | 660 | 655 | 180.9 |
| D | 11 | 129 | 1308041 | 6804.06 | 671 | 642 | 192.1 |
| D | 2 | 249 | 476557 | 2476.79 | 671 | 642 | 192.1 |
| D | 8 | 245 | 98345 | 508.47 | 671 | 642 | 192.1 |
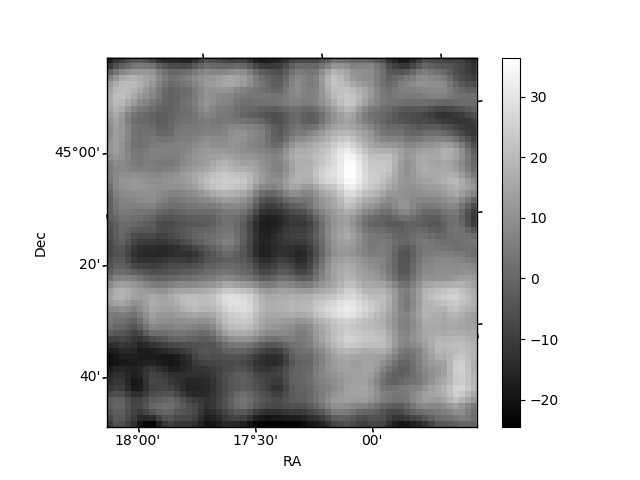
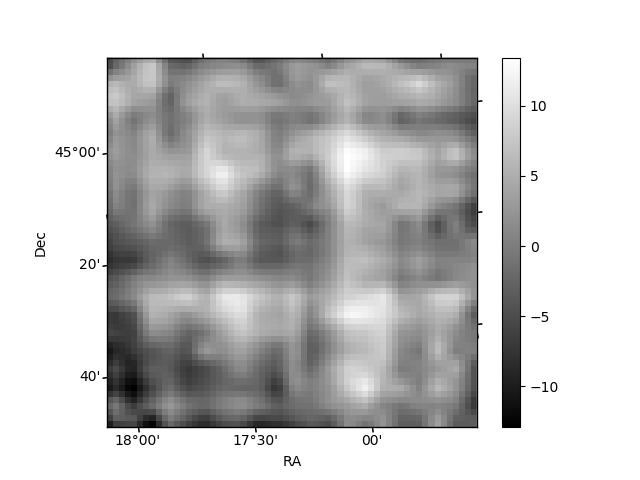
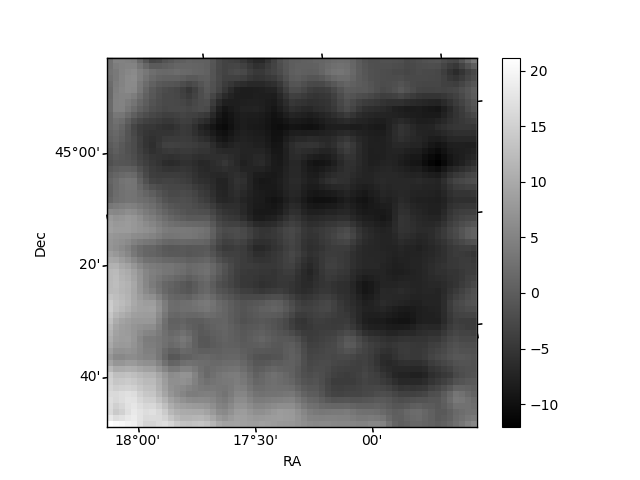
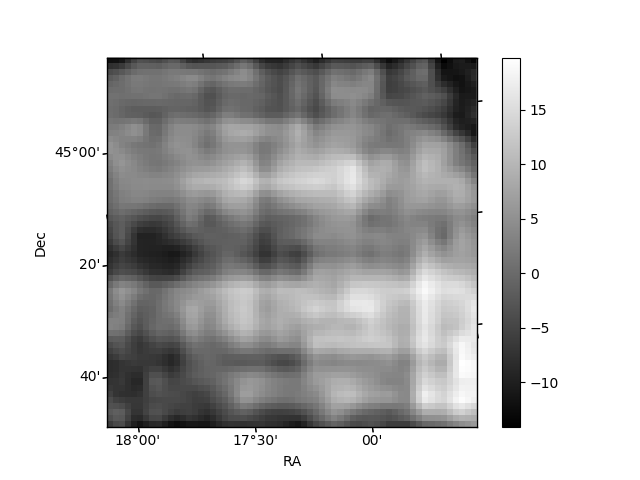
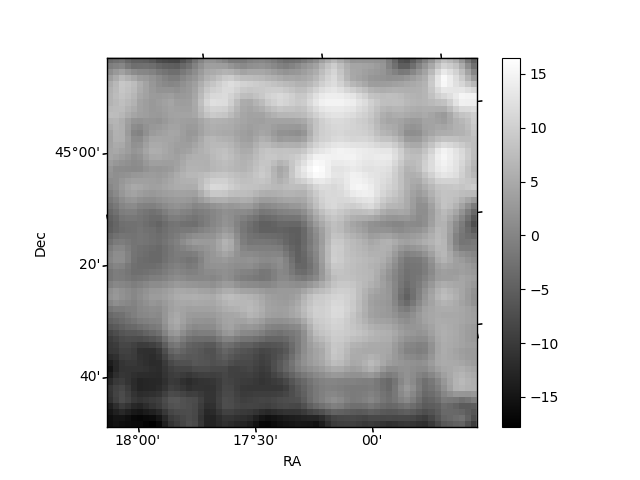
Histogram calculated using DETX and DETY for each event in the final _common_clean file
| Quadrant A | 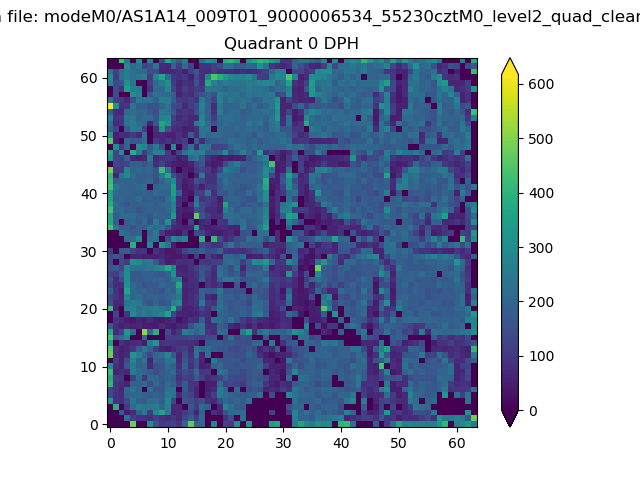 |
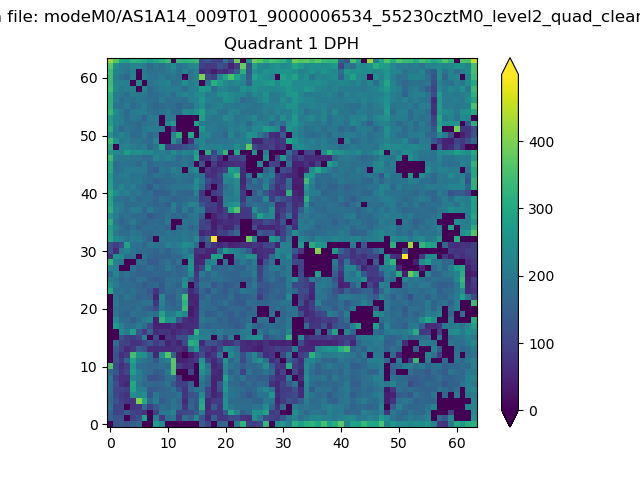 |
Quadrant B |
|---|---|---|---|
| Quadrant D | 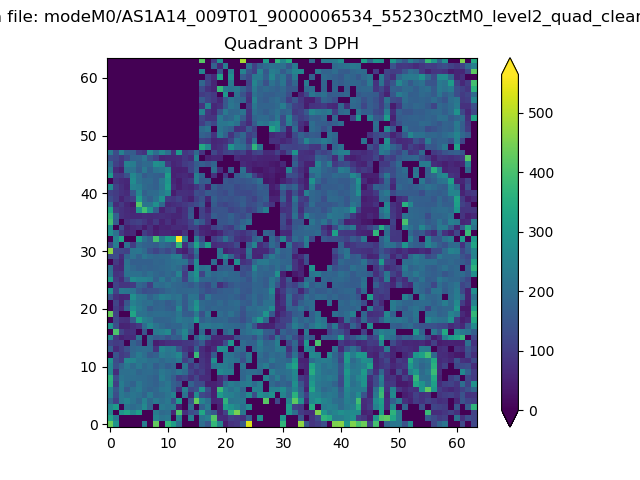 |
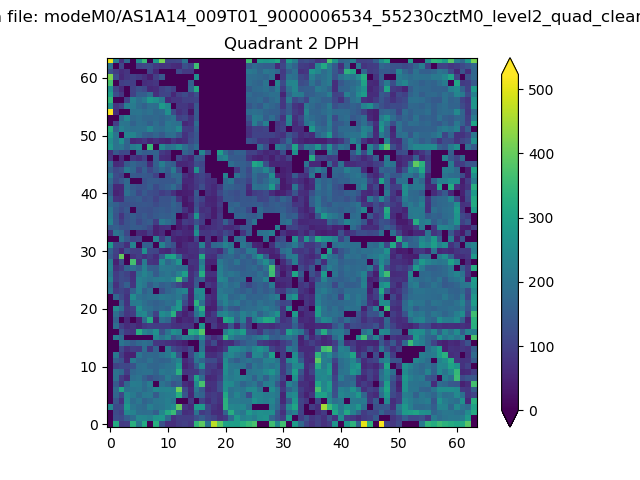 |
Quadrant C |
| Plot type | Count rate plots | Images |
|---|---|---|
| Comparison with Poisson distribution Blue bars denote a histogram of data divided into 1 sec bins. Red curve is a Poisson curve with rate = median count rate of data. |
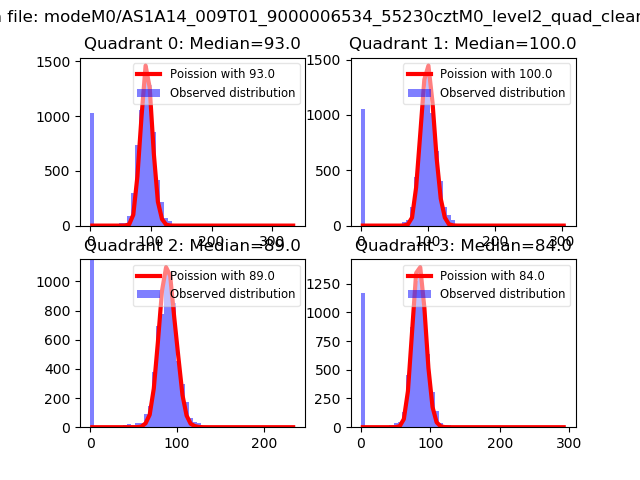 |
 |
| Quadrant-wise count rates Data is divided into 100 sec bins |
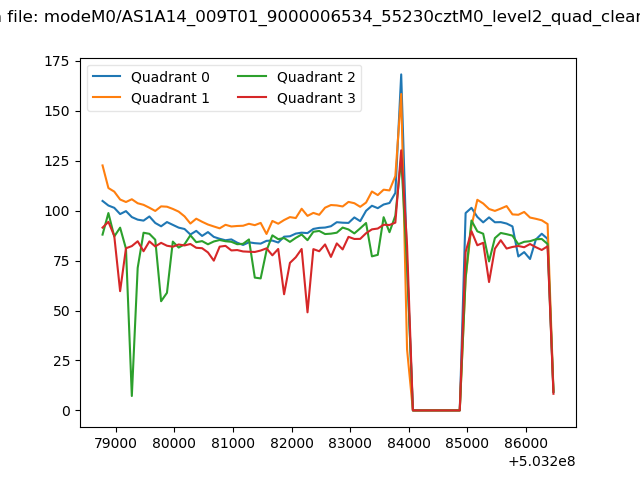 |
|
| Module-wise count rates for Quadrant A Data is divided into 100 sec bins |
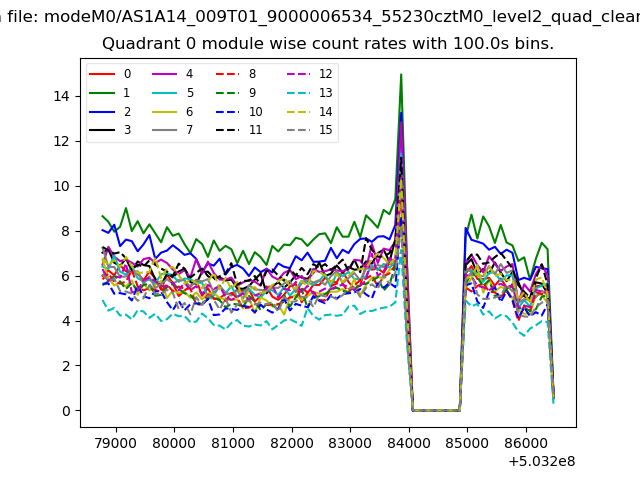 |
 |
| Module-wise count rates for Quadrant B Data is divided into 100 sec bins |
 |
 |
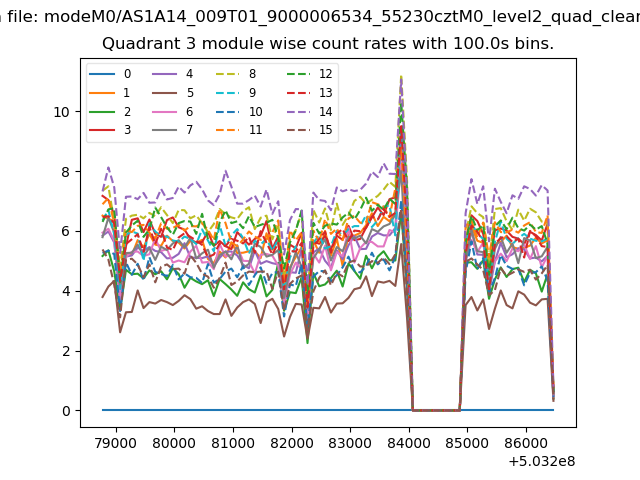
| Module-wise count rates for Quadrant C Data is divided into 100 sec bins |
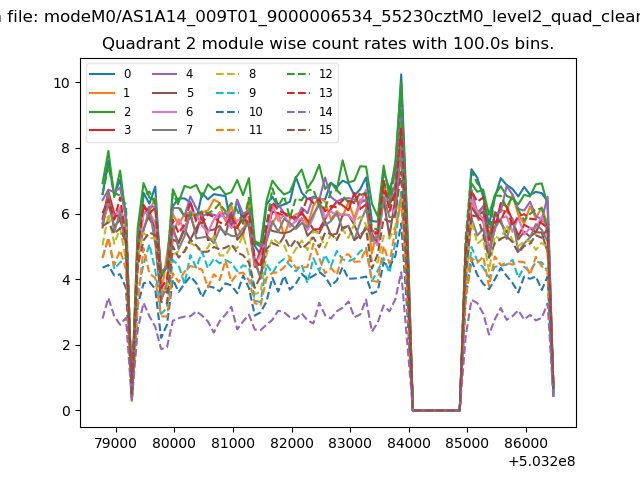 |
 |
| Module-wise count rates for Quadrant D Data is divided into 100 sec bins |
 |
 |
| Parameter | Plot |
|---|---|
| CZT HV Monitor | 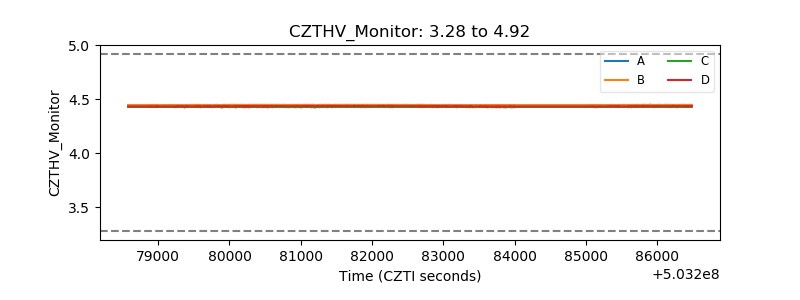 |
| D_VDD | 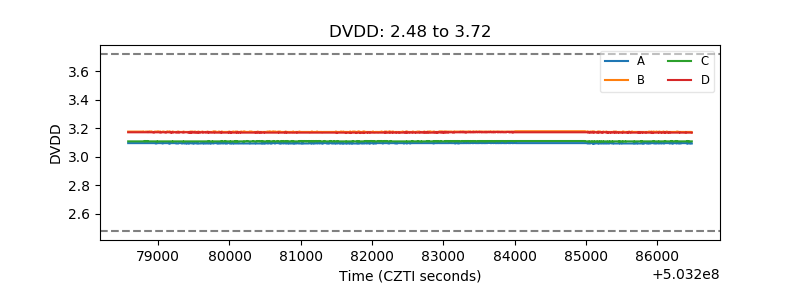 |
| Temperature 1 | 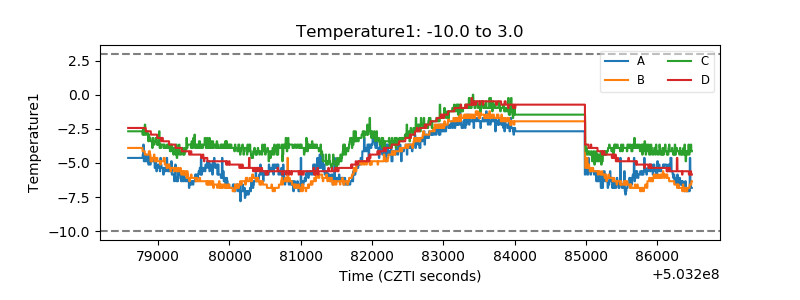 |
| Veto HV Monitor |  |
| Veto LLD | 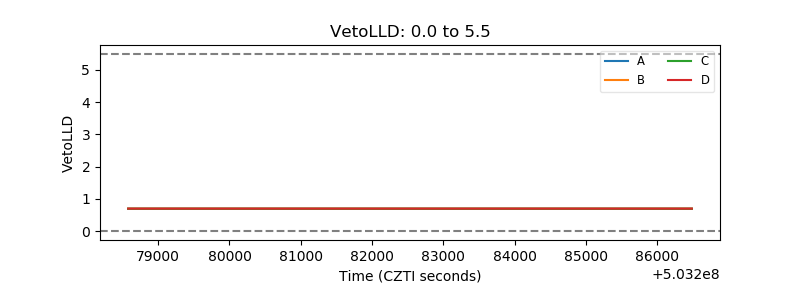 |
| Alpha Counter | 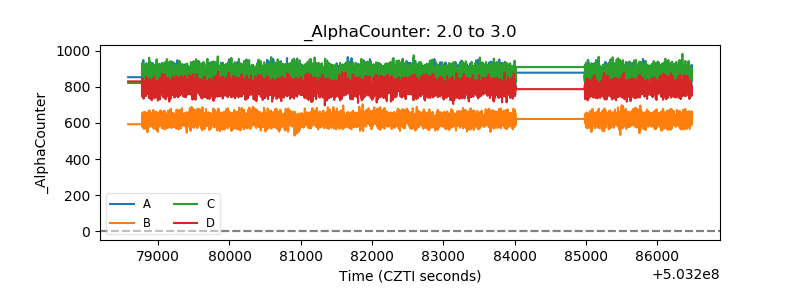 |
| _CPM_Rate | 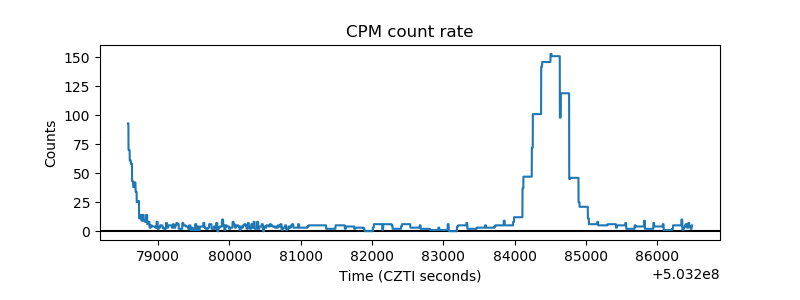 |
| CZT Counter | 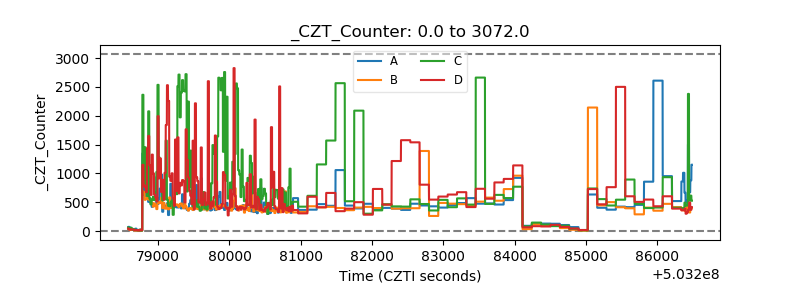 |
| +2.5 Volts monitor | 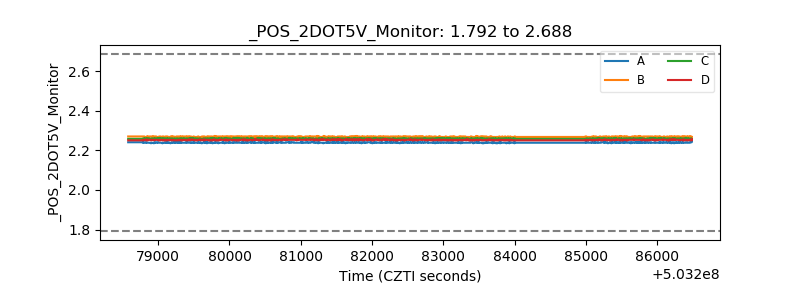 |
| +5 Volts monitor | 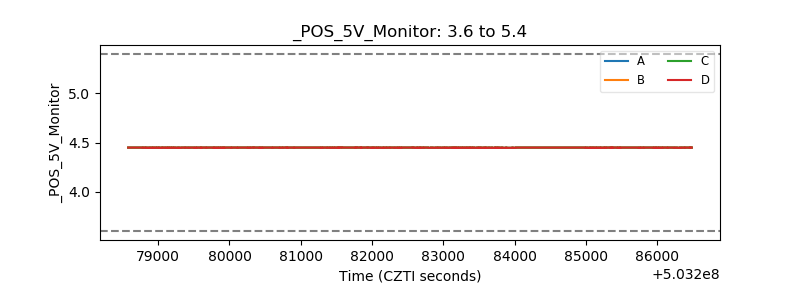 |
| _ROLL_ROT | 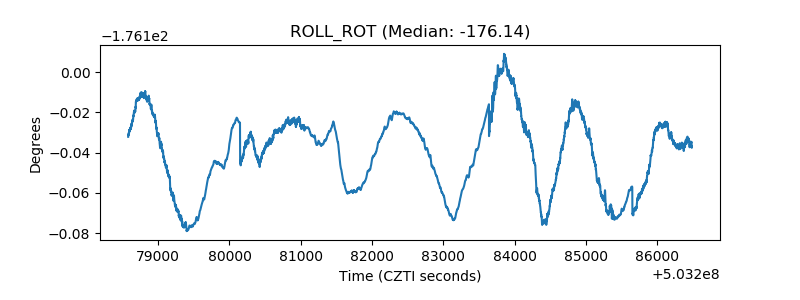 |
| _Roll_DEC | 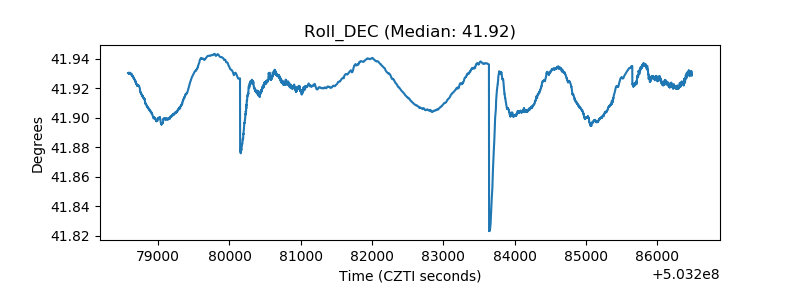 |
| _Roll_RA | 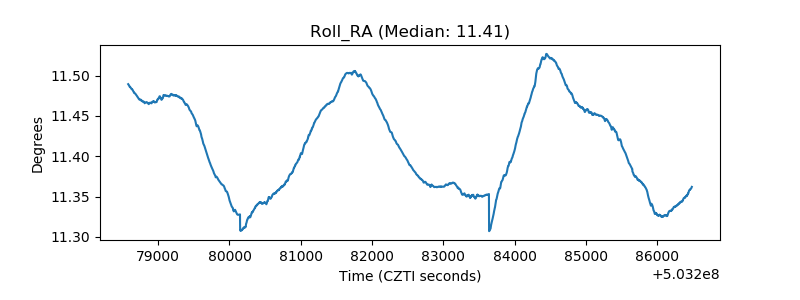 |
| Veto Counter | 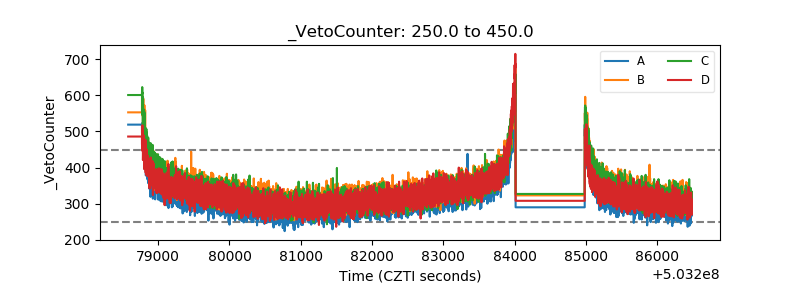 |