| Param | Original file | Final file |
|---|---|---|
| Filename | modeM0/AS1A14_009T01_9000006534_55231cztM0_level2.fits | modeM0/AS1A14_009T01_9000006534_55231cztM0_level2_quad_clean.evt |
| Size (bytes) | 525,196,800 | 111,479,040 |
| Size | 500.9 MB | 106.3 MB |
| Events in quadrant A | 4,396,831 | 743,329 |
| Events in quadrant B | 3,637,265 | 779,446 |
| Events in quadrant C | 4,978,983 | 687,302 |
| Events in quadrant D | 5,834,245 | 633,904 |
| Mode SS | |||
|---|---|---|---|
| Quadrant | BADHDUFLAG | Total packets | Discarded packets |
| A | 0 | 156 | 0 |
| B | 0 | 156 | 0 |
| C | 0 | 156 | 0 |
| D | 0 | 156 | 0 |
| Mode M0 | |||
|---|---|---|---|
| Quadrant | BADHDUFLAG | Total packets | Discarded packets |
| A | 0 | 18624 | 2 |
| B | 0 | 16778 | 2 |
| C | 0 | 20254 | 2 |
| D | 0 | 22823 | 2 |
| Mode M9 | |||
|---|---|---|---|
| Quadrant | BADHDUFLAG | Total packets | Discarded packets |
| A | 0 | 16 | 0 |
| B | 0 | 16 | 0 |
| C | 0 | 16 | 0 |
| D | 0 | 16 | 0 |
| Quadrant | Total seconds | Saturated seconds | Saturation percentage |
|---|---|---|---|
| A | 7643 | 143 | 1.870993% |
| B | 7643 | 191 | 2.499019% |
| C | 7643 | 356 | 4.657857% |
| D | 7643 | 601 | 7.863404% |
Noise dominated data is calculated using 1-second bins in cleaned event files. If a bin has >2000 counts, and if more than 50% of those come from <1% of pixels, then it is considered to be noise-dominated and hence unusable.
| Quadrant | # 1 sec bins | Bins with >0 counts | Bins with >2000 counts | High rate bins dominated by noise | Noise dominated (total time) | Noise dominated (detector-on time) | Marked lightcurve |
|---|---|---|---|---|---|---|---|
| A | 9218 | 7644 | 123 | 123 | 1.33% | 1.61% | 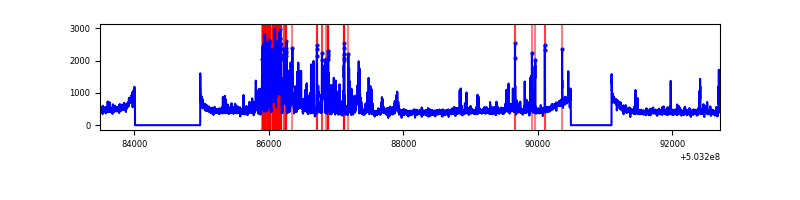 |
| B | 9218 | 7644 | 54 | 54 | 0.59% | 0.71% | 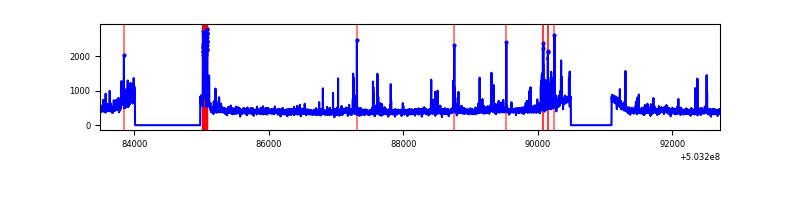 |
| C | 9218 | 7645 | 274 | 274 | 2.97% | 3.58% | 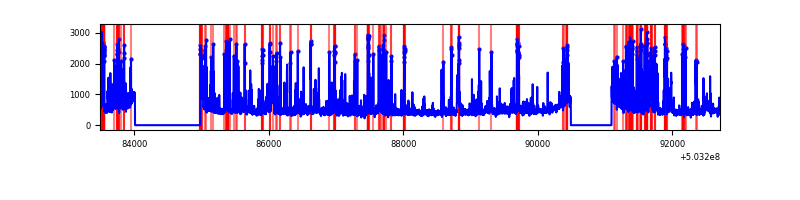 |
| D | 9218 | 7644 | 556 | 556 | 6.03% | 7.27% | 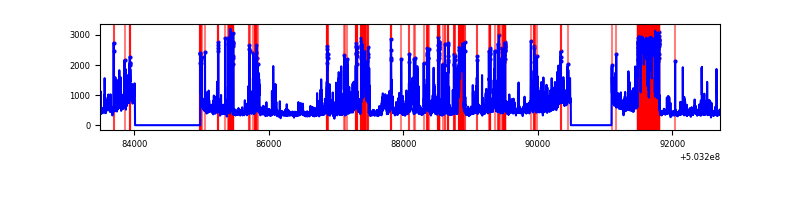 |
Top three noisy pixels from each quadrant. If the there are fewer than three noisy pixels in the level2.evt file, extra rows are filled as -1
| Pixel properties | Quadrant properties | ||||||
|---|---|---|---|---|---|---|---|
| Quadrant | DetID | PixID | Counts | Sigma | Mean | Median | Sigma |
| A | 12 | 115 | 915952 | 4473.95 | 827 | 808 | 204.5 |
| A | 4 | 205 | 164429 | 799.91 | 827 | 808 | 204.5 |
| A | 3 | 14 | 28540 | 135.58 | 827 | 808 | 204.5 |
| B | 2 | 249 | 150526 | 850.57 | 812 | 780 | 176.1 |
| B | 10 | 247 | 141823 | 801.14 | 812 | 780 | 176.1 |
| B | 0 | 182 | 47214 | 263.75 | 812 | 780 | 176.1 |
| C | 13 | 3 | 378145 | 1741.01 | 790 | 782 | 216.7 |
| C | 12 | 254 | 340219 | 1566.03 | 790 | 782 | 216.7 |
| C | 10 | 22 | 332235 | 1529.2 | 790 | 782 | 216.7 |
| D | 2 | 249 | 1443636 | 6589.83 | 773 | 737 | 219.0 |
| D | 11 | 129 | 895147 | 4084.84 | 773 | 737 | 219.0 |
| D | 2 | 31 | 151865 | 690.21 | 773 | 737 | 219.0 |
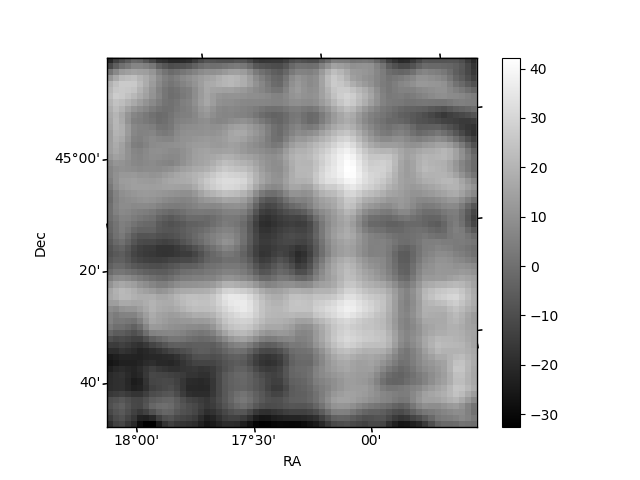
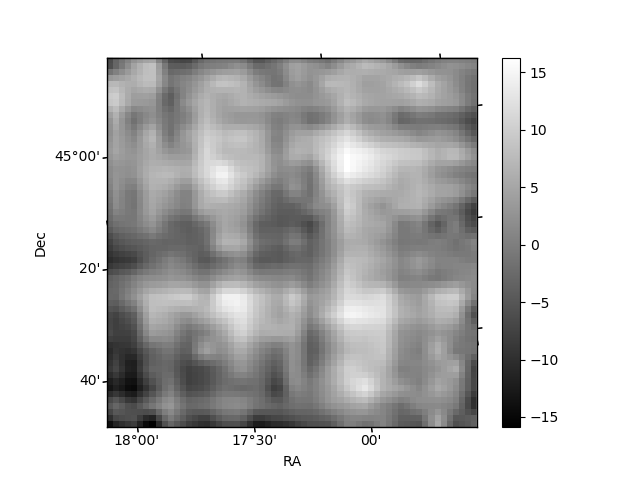
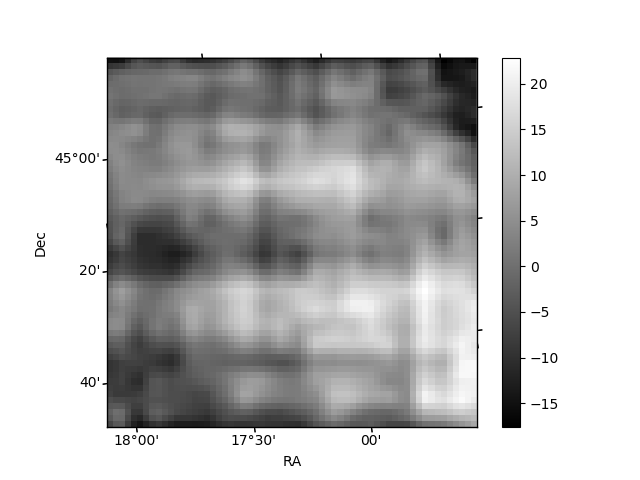
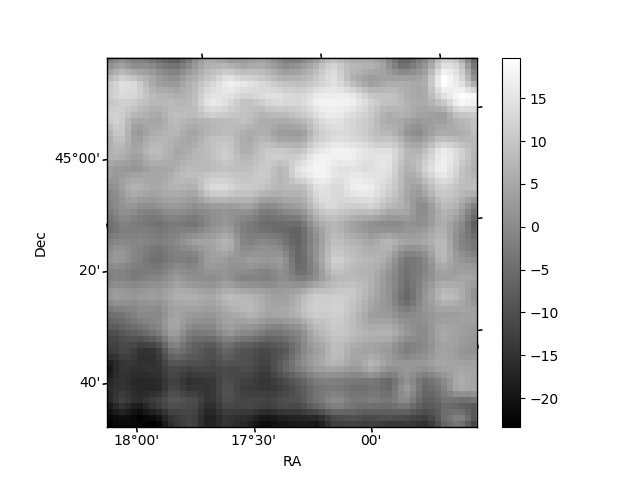
Histogram calculated using DETX and DETY for each event in the final _common_clean file
| Quadrant A | 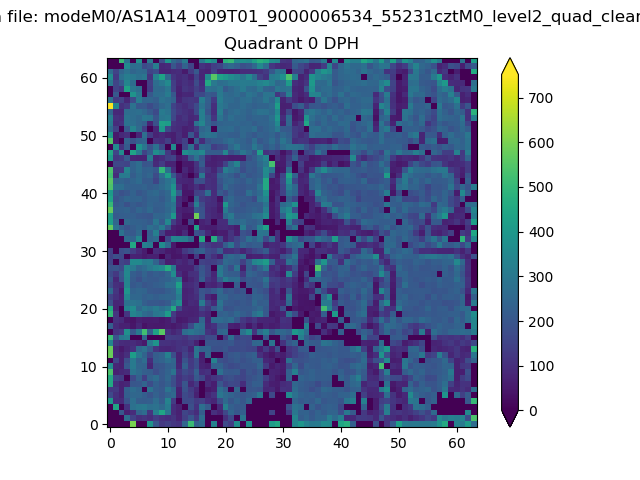 |
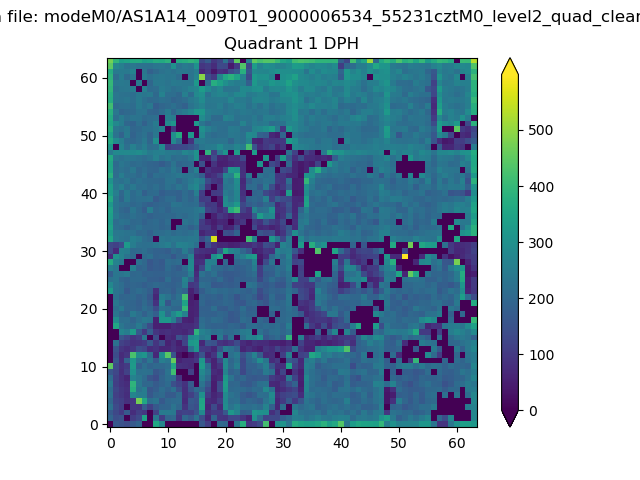 |
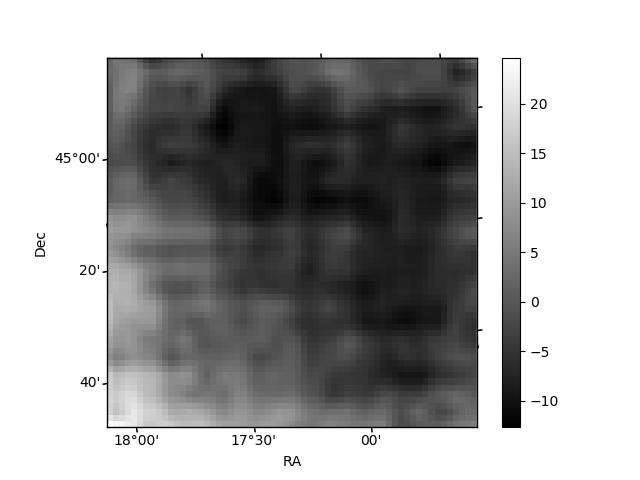
Quadrant B |
|---|---|---|---|
| Quadrant D | 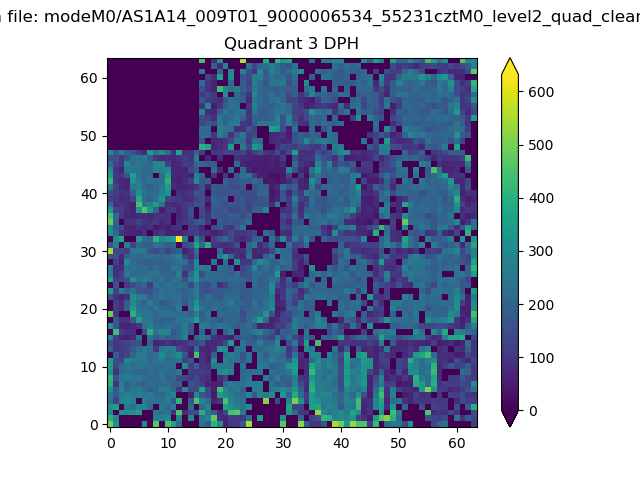 |
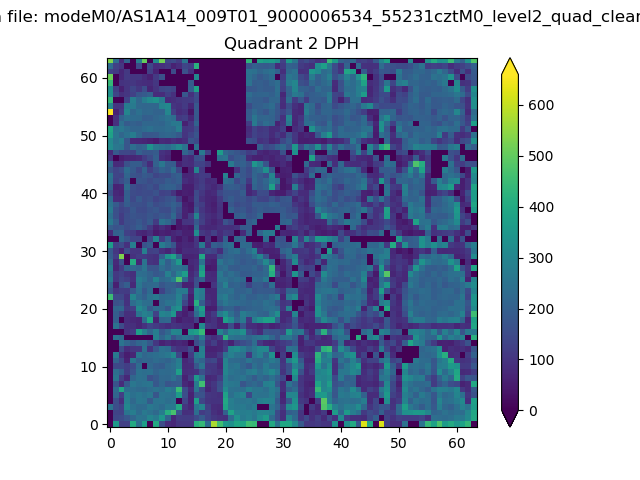 |
Quadrant C |
| Plot type | Count rate plots | Images |
|---|---|---|
| Comparison with Poisson distribution Blue bars denote a histogram of data divided into 1 sec bins. Red curve is a Poisson curve with rate = median count rate of data. |
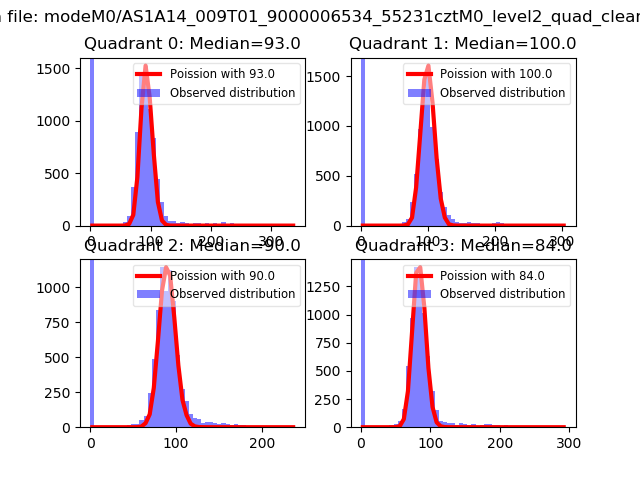 |
 |
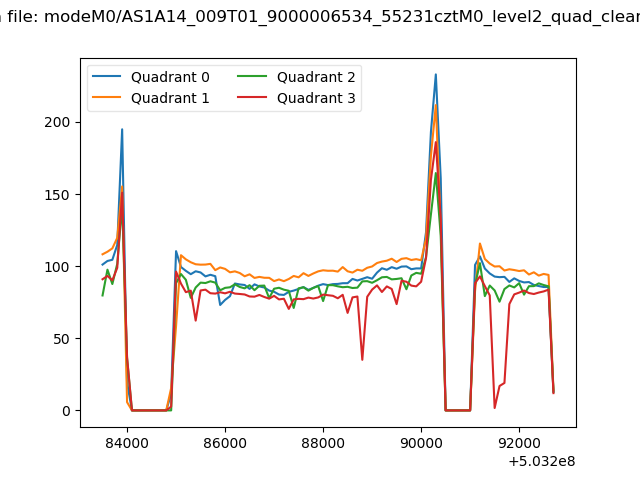
| Quadrant-wise count rates Data is divided into 100 sec bins |
 |
|
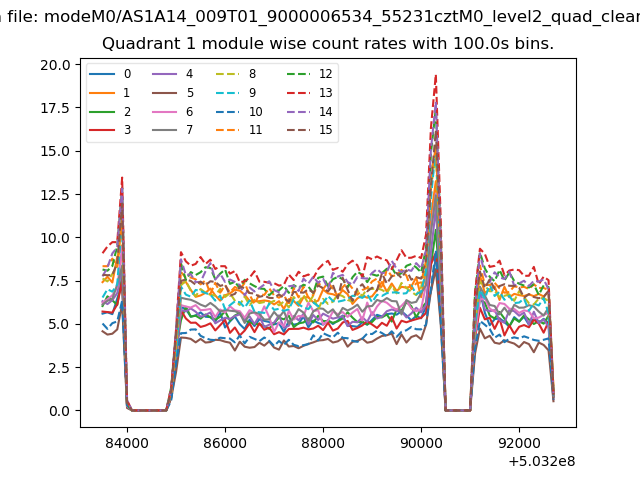
| Module-wise count rates for Quadrant A Data is divided into 100 sec bins |
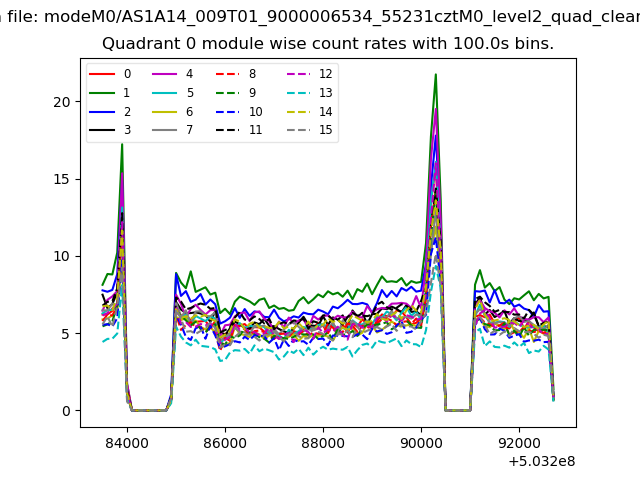 |
 |
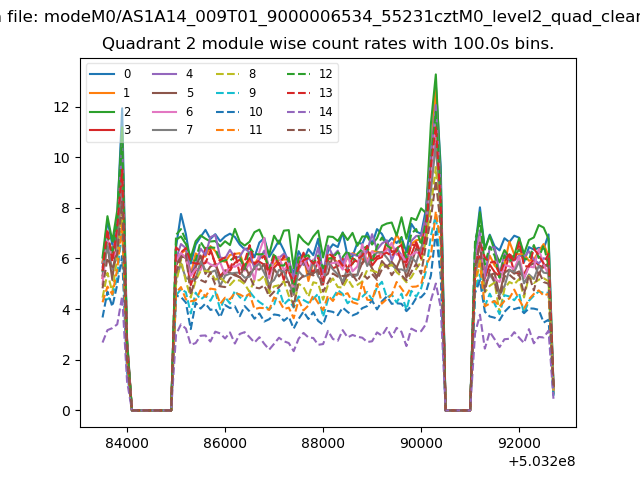
| Module-wise count rates for Quadrant B Data is divided into 100 sec bins |
 |
 |
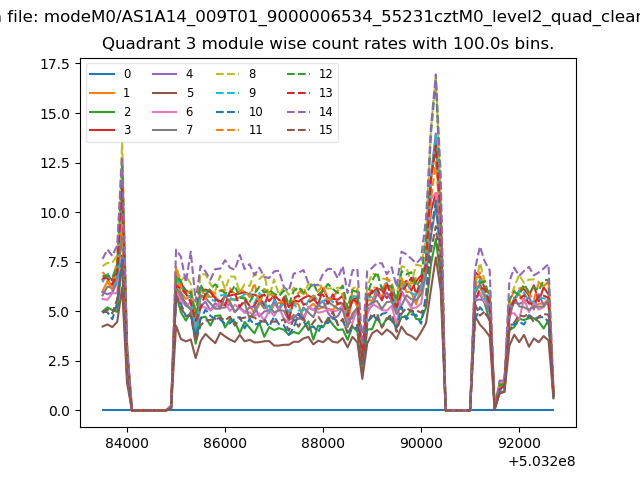
| Module-wise count rates for Quadrant C Data is divided into 100 sec bins |
 |
 |
| Module-wise count rates for Quadrant D Data is divided into 100 sec bins |
 |
 |
| Parameter | Plot |
|---|---|
| CZT HV Monitor |  |
| D_VDD | 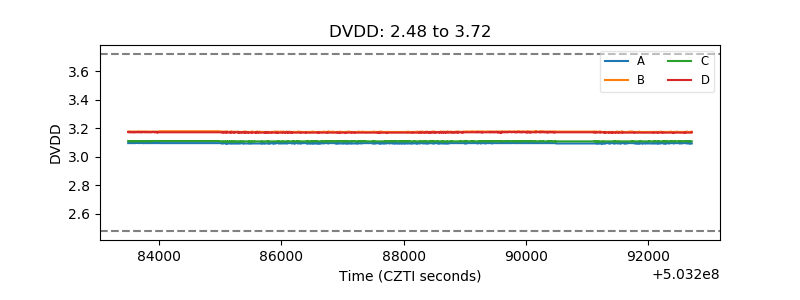 |
| Temperature 1 | 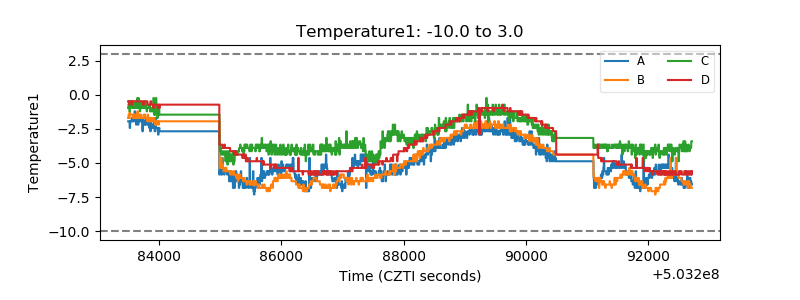 |
| Veto HV Monitor | 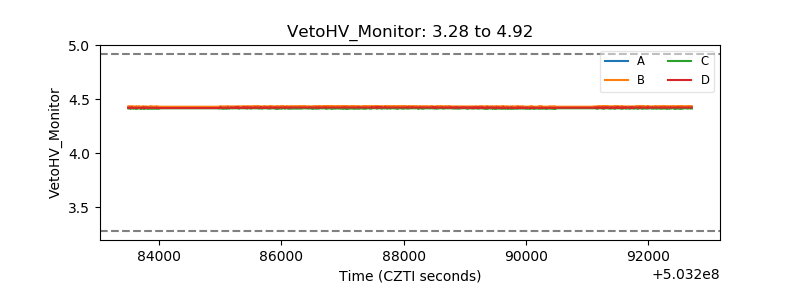 |
| Veto LLD | 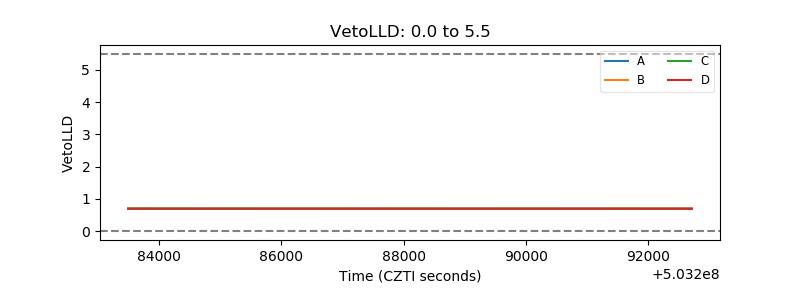 |
| Alpha Counter | 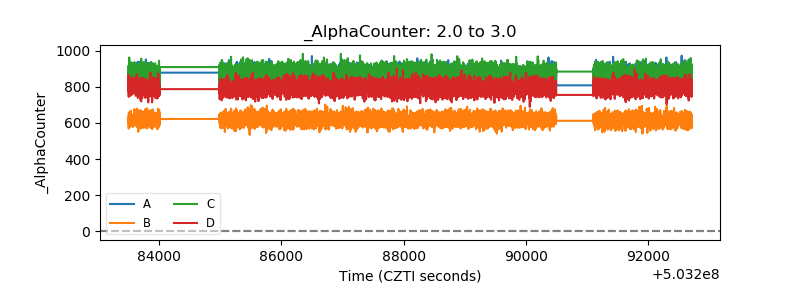 |
| _CPM_Rate | 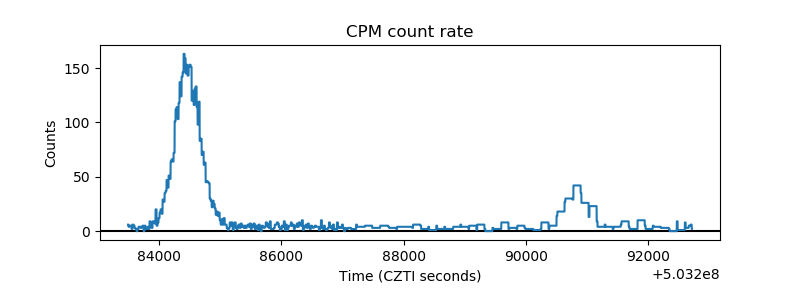 |
| CZT Counter | 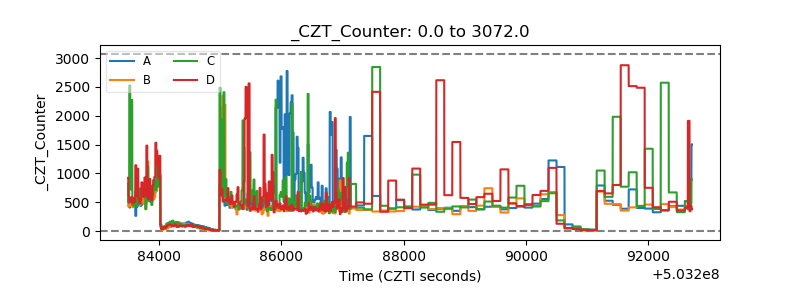 |
| +2.5 Volts monitor |  |
| +5 Volts monitor |  |
| _ROLL_ROT | 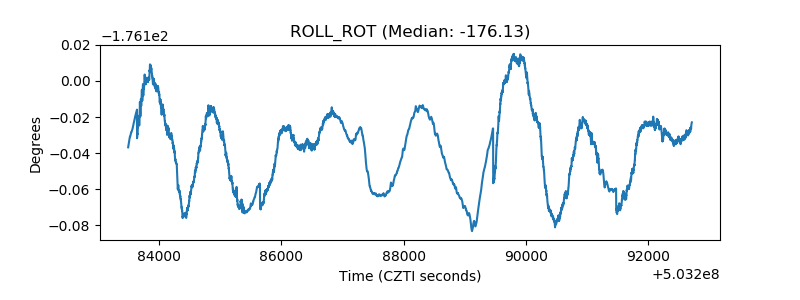 |
| _Roll_DEC | 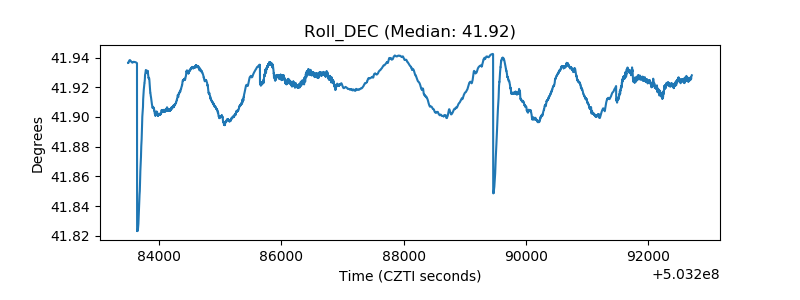 |
| _Roll_RA | 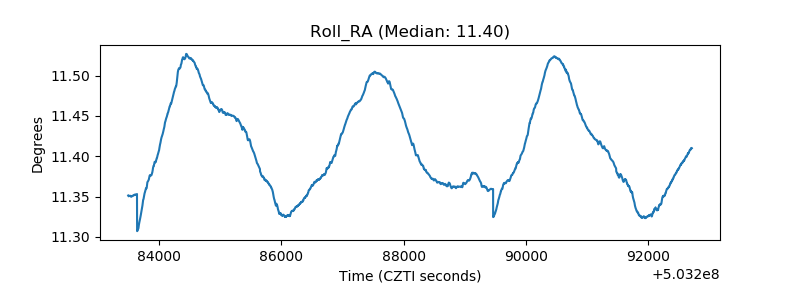 |
| Veto Counter | 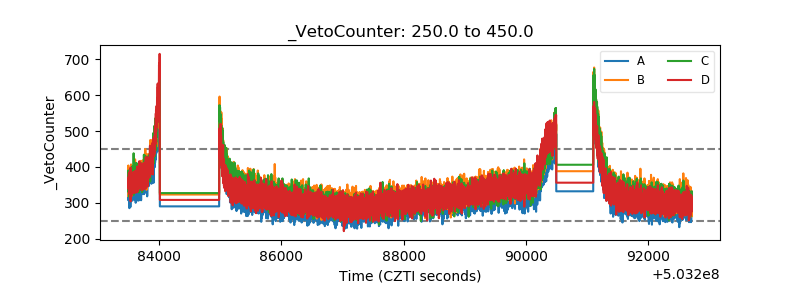 |