| Param | Original file | Final file |
|---|---|---|
| Filename | modeM0/AS1A14_009T01_9000006534_55233cztM0_level2.fits | modeM0/AS1A14_009T01_9000006534_55233cztM0_level2_quad_clean.evt |
| Size (bytes) | 587,134,080 | 114,791,040 |
| Size | 559.9 MB | 109.5 MB |
| Events in quadrant A | 3,804,894 | 757,422 |
| Events in quadrant B | 3,793,148 | 817,883 |
| Events in quadrant C | 7,648,106 | 641,920 |
| Events in quadrant D | 5,843,115 | 681,712 |
| Mode SS | |||
|---|---|---|---|
| Quadrant | BADHDUFLAG | Total packets | Discarded packets |
| A | 0 | 166 | 0 |
| B | 0 | 166 | 0 |
| C | 0 | 166 | 0 |
| D | 0 | 166 | 0 |
| Mode M0 | |||
|---|---|---|---|
| Quadrant | BADHDUFLAG | Total packets | Discarded packets |
| A | 0 | 17769 | 0 |
| B | 0 | 17731 | 0 |
| C | 0 | 28370 | 0 |
| D | 0 | 23131 | 0 |
| Quadrant | Total seconds | Saturated seconds | Saturation percentage |
|---|---|---|---|
| A | 8299 | 81 | 0.976021% |
| B | 8300 | 135 | 1.626506% |
| C | 8300 | 1291 | 15.554217% |
| D | 8300 | 306 | 3.686747% |
Noise dominated data is calculated using 1-second bins in cleaned event files. If a bin has >2000 counts, and if more than 50% of those come from <1% of pixels, then it is considered to be noise-dominated and hence unusable.
| Quadrant | # 1 sec bins | Bins with >0 counts | Bins with >2000 counts | High rate bins dominated by noise | Noise dominated (total time) | Noise dominated (detector-on time) | Marked lightcurve |
|---|---|---|---|---|---|---|---|
| A | 8299 | 8299 | 58 | 58 | 0.70% | 0.70% | 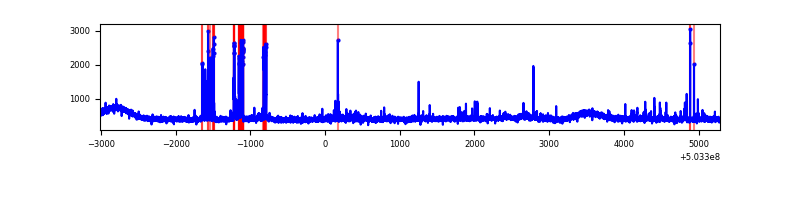 |
| B | 8300 | 8300 | 28 | 28 | 0.34% | 0.34% | 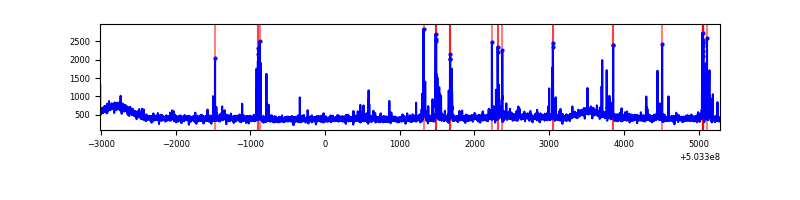 |
| C | 8300 | 8300 | 1014 | 1014 | 12.22% | 12.22% | 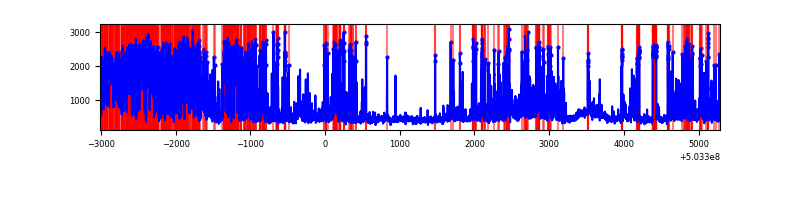 |
| D | 8300 | 8300 | 273 | 273 | 3.29% | 3.29% | 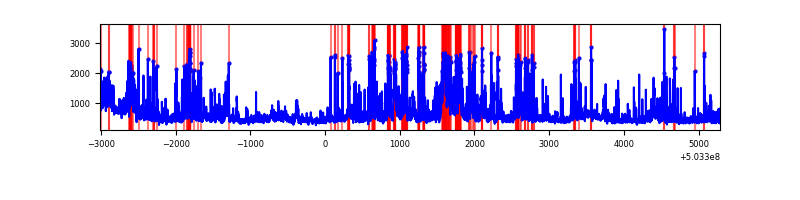 |
Top three noisy pixels from each quadrant. If the there are fewer than three noisy pixels in the level2.evt file, extra rows are filled as -1
| Pixel properties | Quadrant properties | ||||||
|---|---|---|---|---|---|---|---|
| Quadrant | DetID | PixID | Counts | Sigma | Mean | Median | Sigma |
| A | 0 | 8 | 239915 | 1102.22 | 883 | 857 | 216.9 |
| A | 4 | 3 | 29299 | 131.14 | 883 | 857 | 216.9 |
| A | 4 | 205 | 25610 | 114.13 | 883 | 857 | 216.9 |
| B | 10 | 247 | 160805 | 840.8 | 880 | 844 | 190.2 |
| B | 4 | 81 | 66695 | 346.13 | 880 | 844 | 190.2 |
| B | 10 | 245 | 41480 | 213.59 | 880 | 844 | 190.2 |
| C | 12 | 254 | 2906765 | 13157.83 | 807 | 797 | 220.9 |
| C | 13 | 3 | 462742 | 2091.62 | 807 | 797 | 220.9 |
| C | 10 | 22 | 411701 | 1860.52 | 807 | 797 | 220.9 |
| D | 11 | 129 | 1719078 | 7160.76 | 853 | 817 | 240.0 |
| D | 2 | 249 | 397830 | 1654.53 | 853 | 817 | 240.0 |
| D | 10 | 181 | 148656 | 616.11 | 853 | 817 | 240.0 |
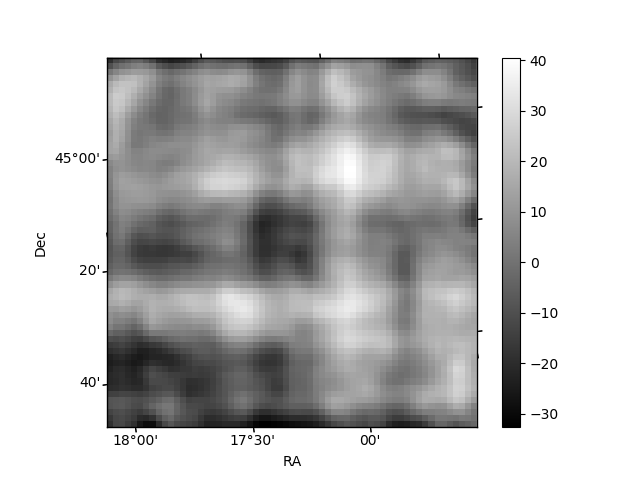
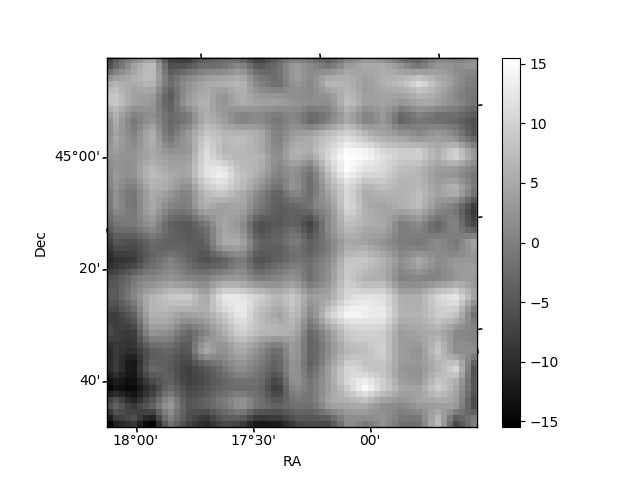
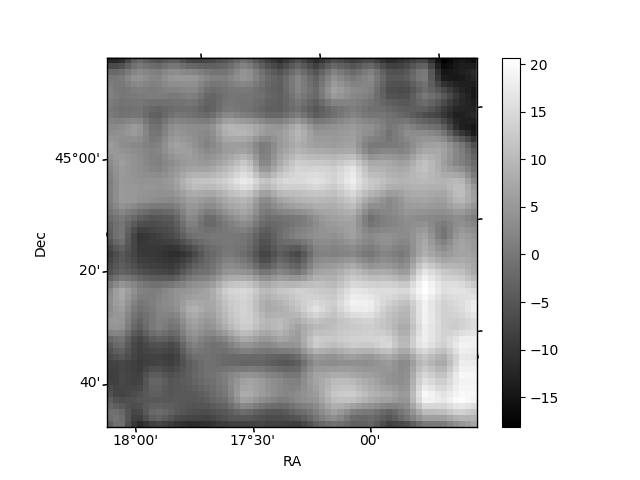
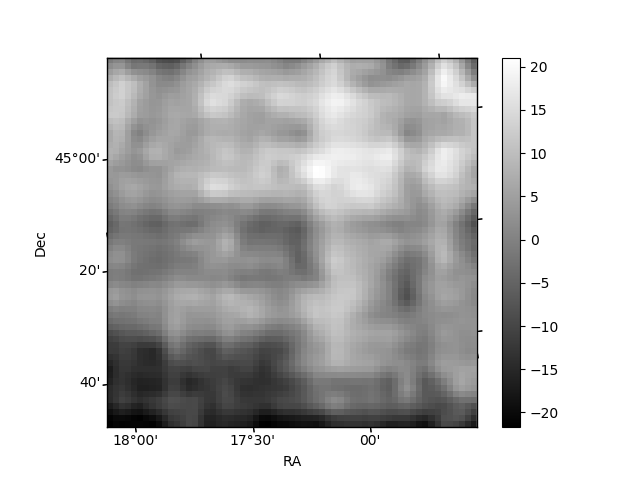
Histogram calculated using DETX and DETY for each event in the final _common_clean file
| Quadrant A | 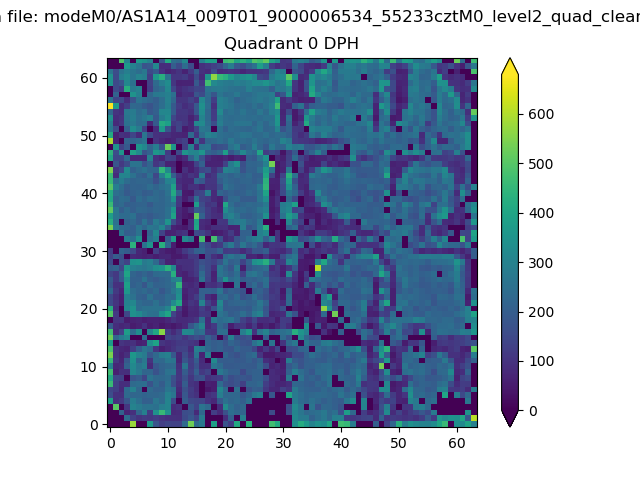 |
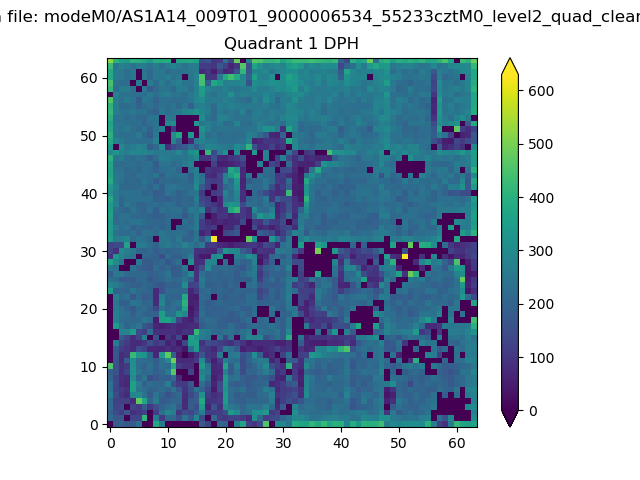 |
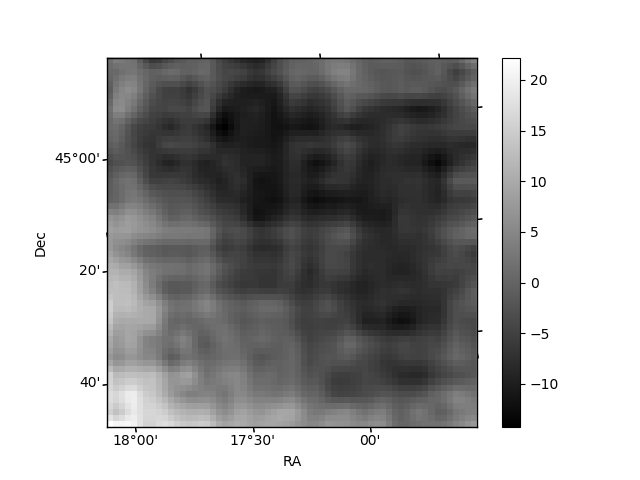
Quadrant B |
|---|---|---|---|
| Quadrant D | 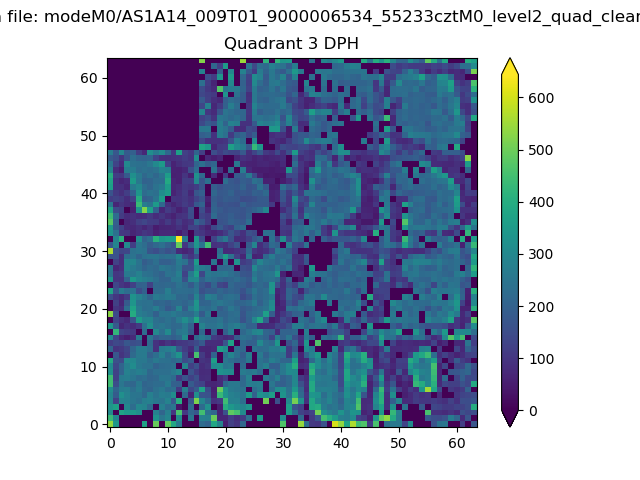 |
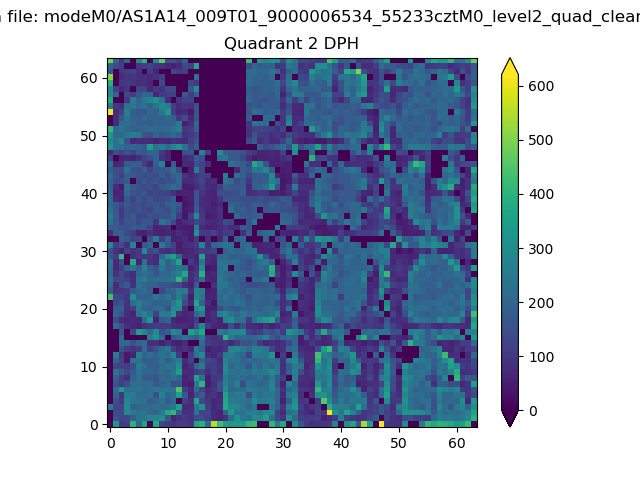 |
Quadrant C |
| Plot type | Count rate plots | Images |
|---|---|---|
| Comparison with Poisson distribution Blue bars denote a histogram of data divided into 1 sec bins. Red curve is a Poisson curve with rate = median count rate of data. |
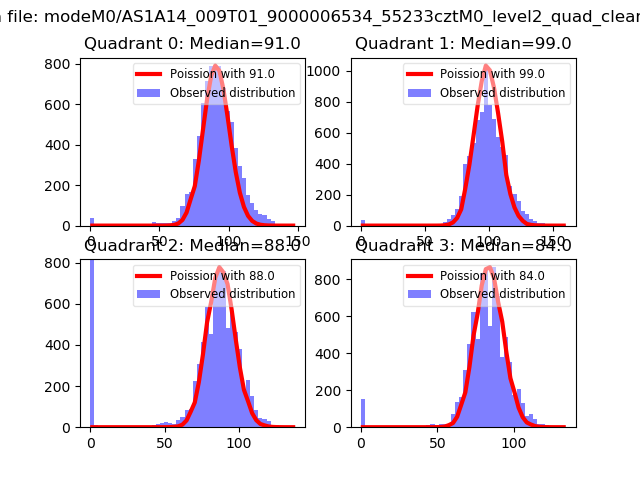 |
 |
| Quadrant-wise count rates Data is divided into 100 sec bins |
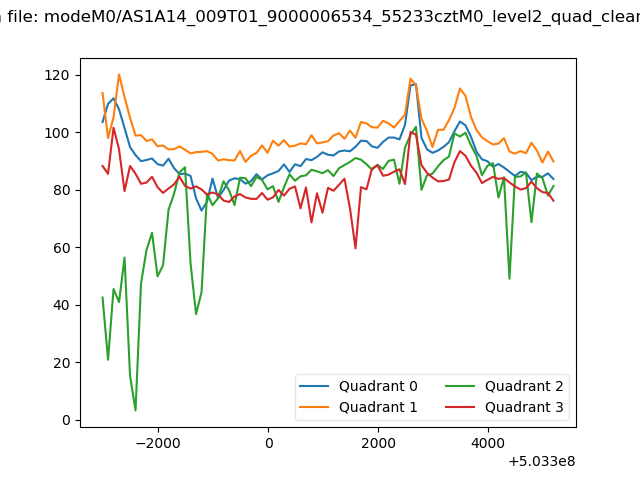 |
|
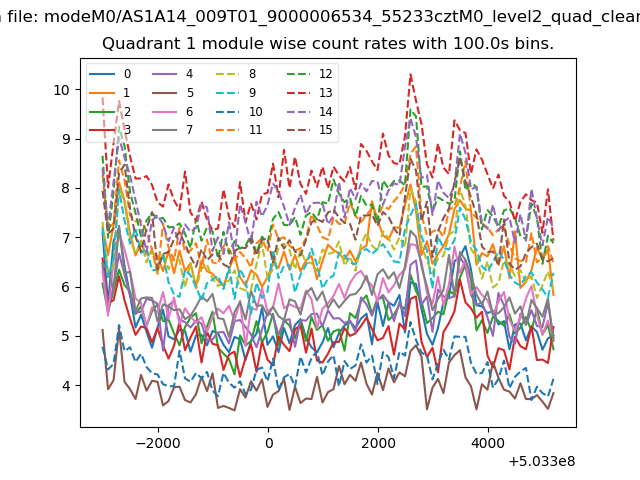
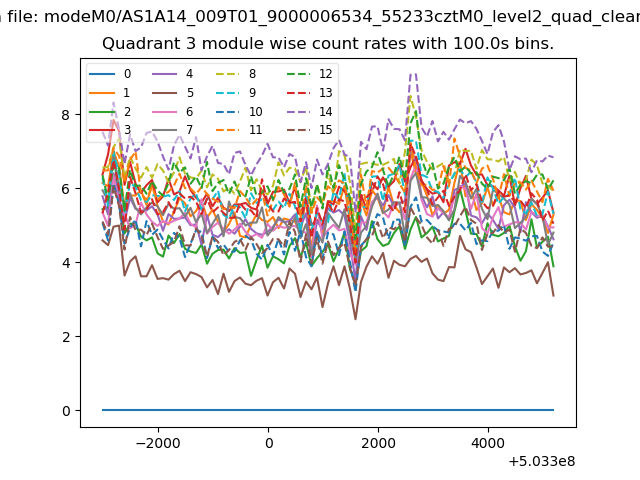
| Module-wise count rates for Quadrant A Data is divided into 100 sec bins |
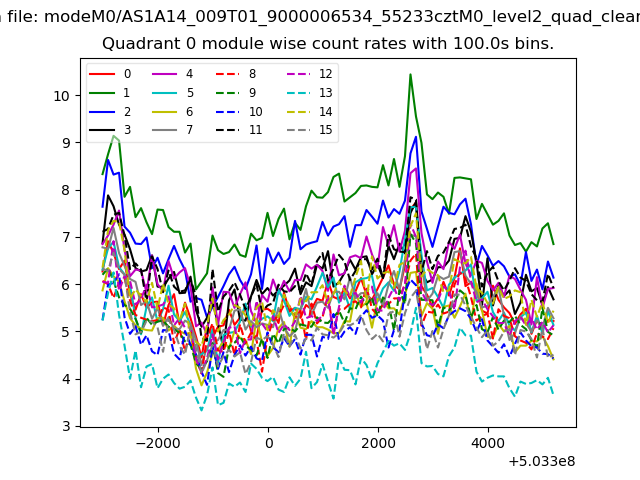 |
 |
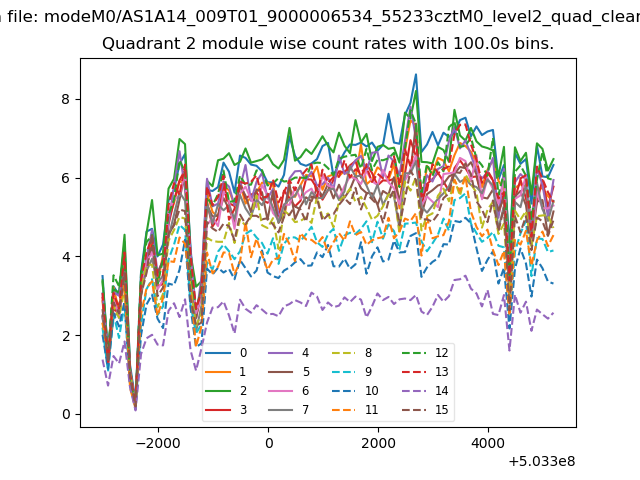
| Module-wise count rates for Quadrant B Data is divided into 100 sec bins |
 |
 |
| Module-wise count rates for Quadrant C Data is divided into 100 sec bins |
 |
 |
| Module-wise count rates for Quadrant D Data is divided into 100 sec bins |
 |
 |
| Parameter | Plot |
|---|---|
| CZT HV Monitor | 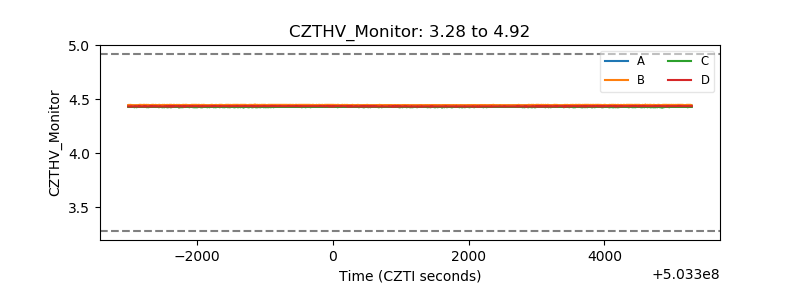 |
| D_VDD | 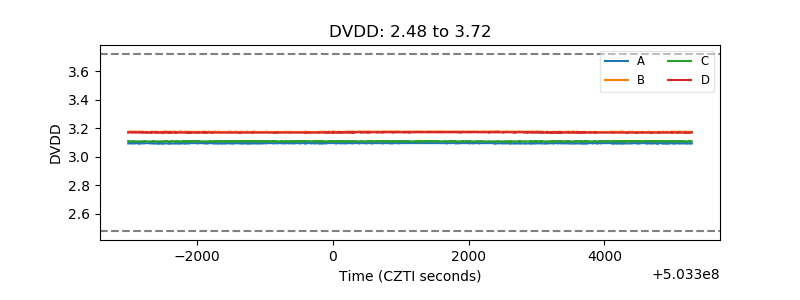 |
| Temperature 1 | 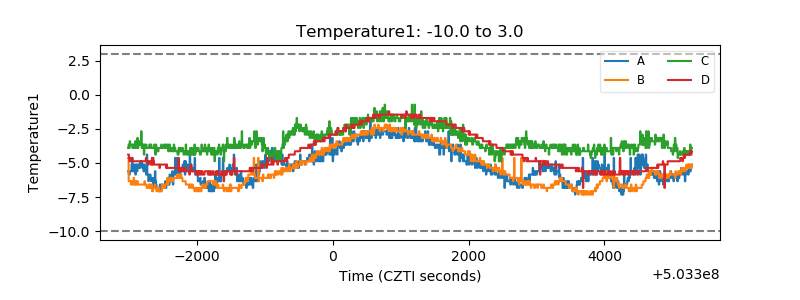 |
| Veto HV Monitor | 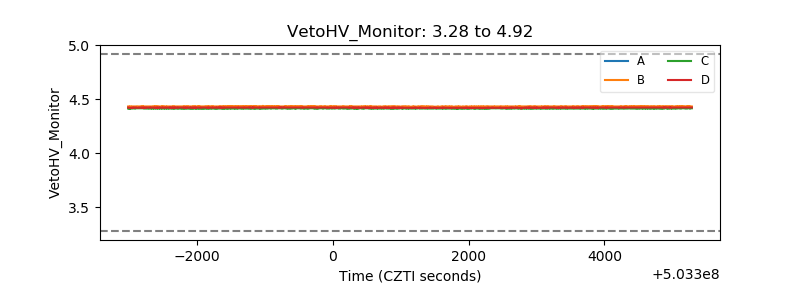 |
| Veto LLD | 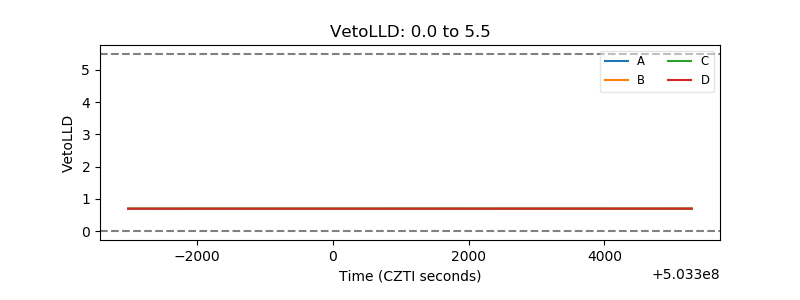 |
| Alpha Counter | 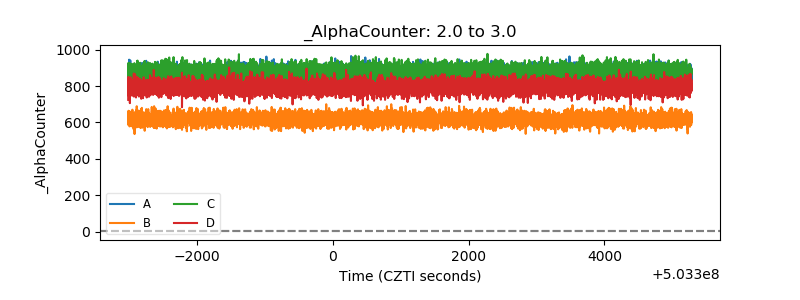 |
| _CPM_Rate | 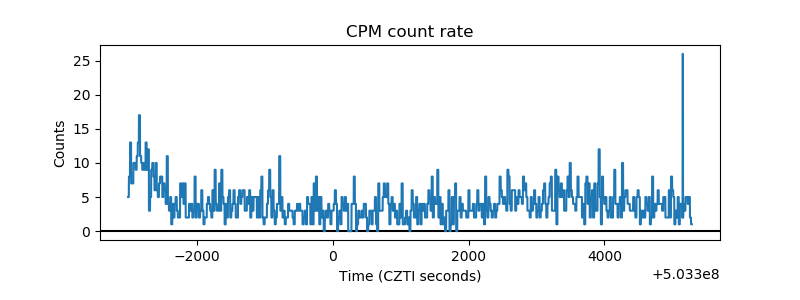 |
| CZT Counter | 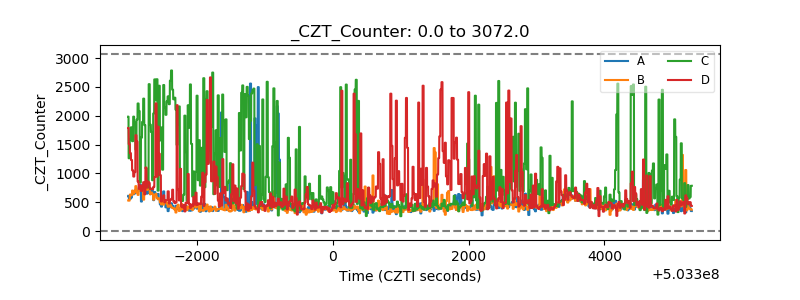 |
| +2.5 Volts monitor | 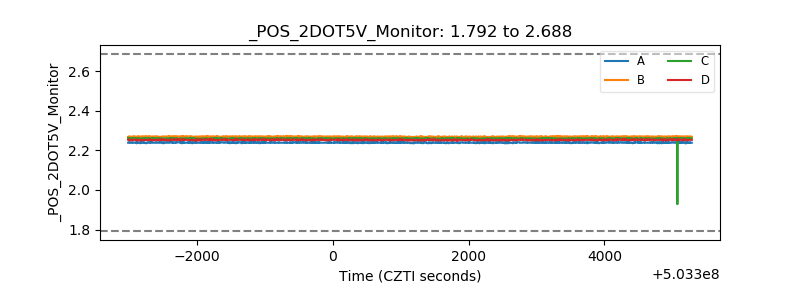 |
| +5 Volts monitor | 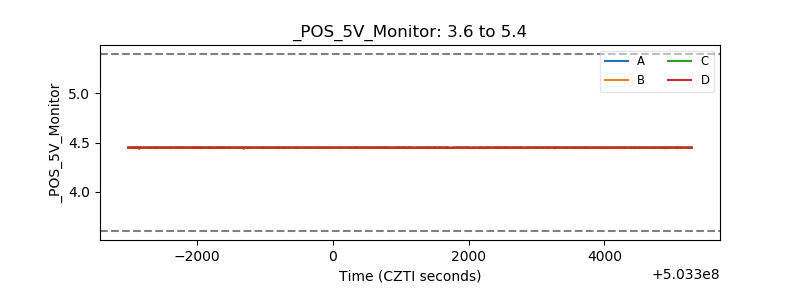 |
| _ROLL_ROT | 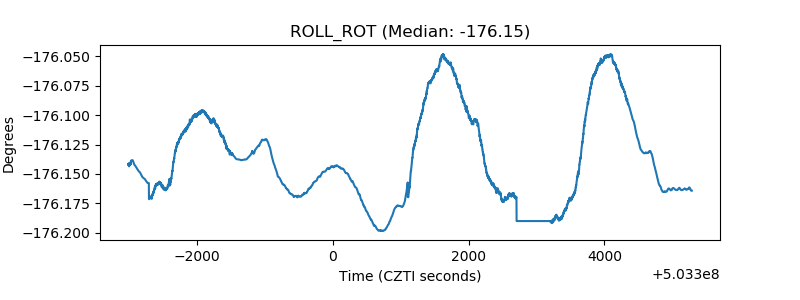 |
| _Roll_DEC | 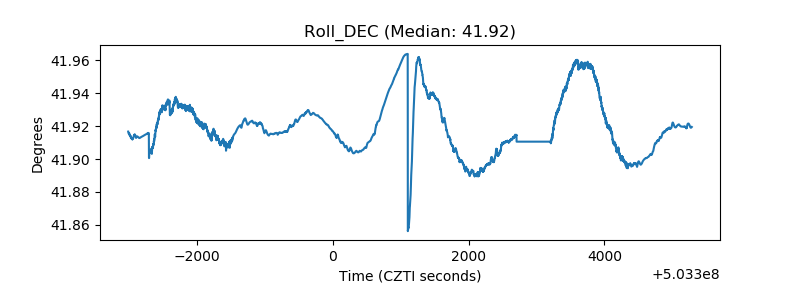 |
| _Roll_RA | 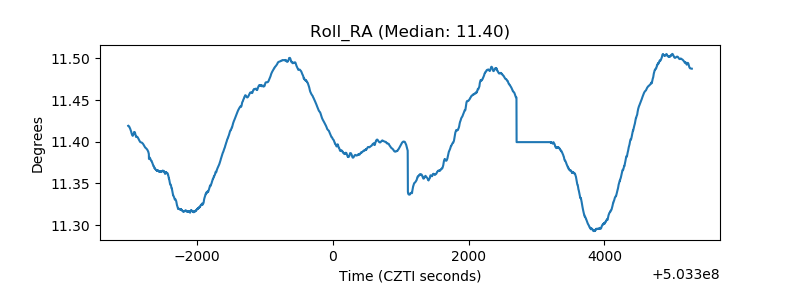 |
| Veto Counter | 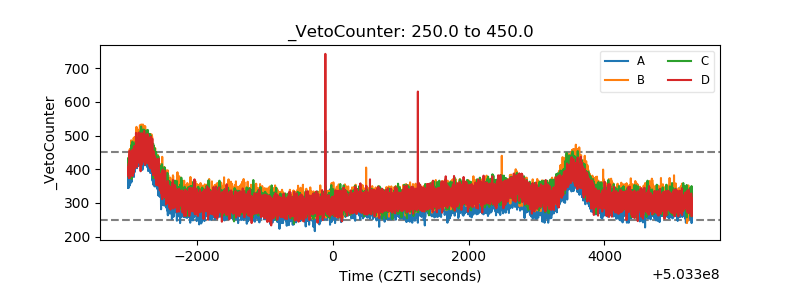 |