| Param | Original file | Final file |
|---|---|---|
| Filename | modeM0/AS1A14_009T01_9000006534_55234cztM0_level2.fits | modeM0/AS1A14_009T01_9000006534_55234cztM0_level2_quad_clean.evt |
| Size (bytes) | 513,374,400 | 118,437,120 |
| Size | 489.6 MB | 113.0 MB |
| Events in quadrant A | 3,944,857 | 764,053 |
| Events in quadrant B | 3,884,767 | 824,880 |
| Events in quadrant C | 5,099,521 | 732,566 |
| Events in quadrant D | 5,421,426 | 681,208 |
| Mode SS | |||
|---|---|---|---|
| Quadrant | BADHDUFLAG | Total packets | Discarded packets |
| A | 0 | 168 | 0 |
| B | 0 | 168 | 0 |
| C | 0 | 168 | 0 |
| D | 0 | 168 | 0 |
| Mode M0 | |||
|---|---|---|---|
| Quadrant | BADHDUFLAG | Total packets | Discarded packets |
| A | 0 | 18138 | 0 |
| B | 0 | 17983 | 0 |
| C | 0 | 21031 | 0 |
| D | 0 | 22031 | 0 |
| Quadrant | Total seconds | Saturated seconds | Saturation percentage |
|---|---|---|---|
| A | 8400 | 87 | 1.035714% |
| B | 8401 | 141 | 1.678372% |
| C | 8401 | 267 | 3.178193% |
| D | 8401 | 343 | 4.082847% |
Noise dominated data is calculated using 1-second bins in cleaned event files. If a bin has >2000 counts, and if more than 50% of those come from <1% of pixels, then it is considered to be noise-dominated and hence unusable.
| Quadrant | # 1 sec bins | Bins with >0 counts | Bins with >2000 counts | High rate bins dominated by noise | Noise dominated (total time) | Noise dominated (detector-on time) | Marked lightcurve |
|---|---|---|---|---|---|---|---|
| A | 8400 | 8400 | 70 | 70 | 0.83% | 0.83% | 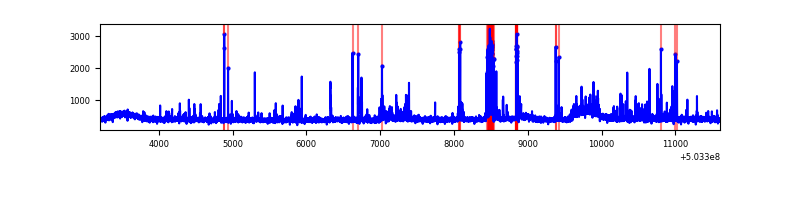 |
| B | 8401 | 8401 | 70 | 70 | 0.83% | 0.83% | 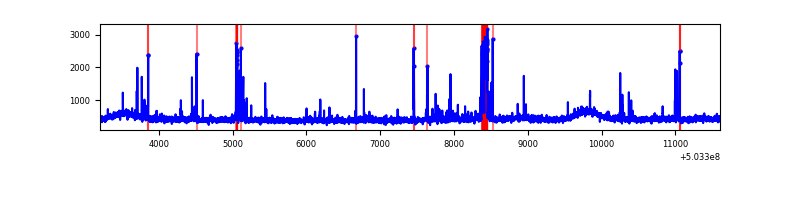 |
| C | 8401 | 8401 | 257 | 257 | 3.06% | 3.06% | 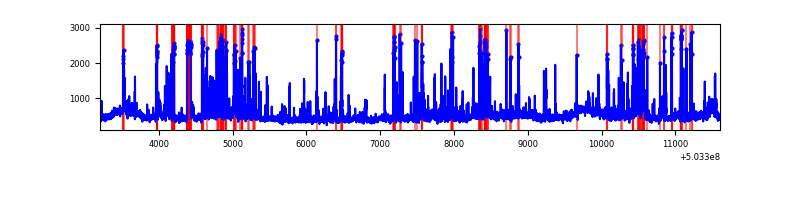 |
| D | 8401 | 8401 | 352 | 352 | 4.19% | 4.19% | 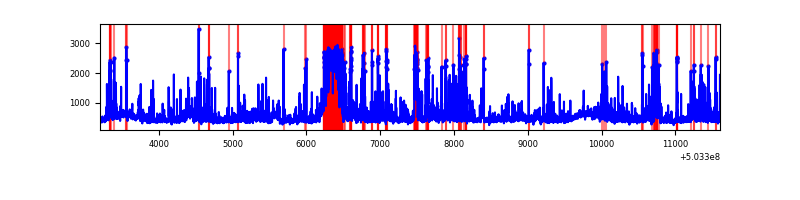 |
Top three noisy pixels from each quadrant. If the there are fewer than three noisy pixels in the level2.evt file, extra rows are filled as -1
| Pixel properties | Quadrant properties | ||||||
|---|---|---|---|---|---|---|---|
| Quadrant | DetID | PixID | Counts | Sigma | Mean | Median | Sigma |
| A | 0 | 8 | 190000 | 859.96 | 887 | 861 | 219.9 |
| A | 11 | 191 | 131743 | 595.08 | 887 | 861 | 219.9 |
| A | 4 | 205 | 78612 | 353.51 | 887 | 861 | 219.9 |
| B | 2 | 249 | 178604 | 935.38 | 879 | 844 | 190.0 |
| B | 10 | 247 | 131724 | 688.69 | 879 | 844 | 190.0 |
| B | 12 | 111 | 24007 | 121.88 | 879 | 844 | 190.0 |
| C | 10 | 22 | 408222 | 1702.27 | 863 | 851 | 239.3 |
| C | 13 | 3 | 370247 | 1543.59 | 863 | 851 | 239.3 |
| C | 12 | 252 | 261452 | 1088.97 | 863 | 851 | 239.3 |
| D | 11 | 129 | 952248 | 4024.38 | 851 | 816 | 236.4 |
| D | 8 | 160 | 580525 | 2452.06 | 851 | 816 | 236.4 |
| D | 2 | 249 | 172268 | 725.21 | 851 | 816 | 236.4 |
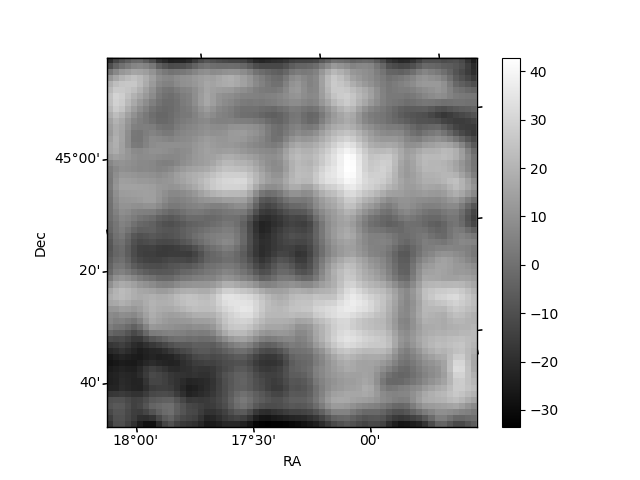
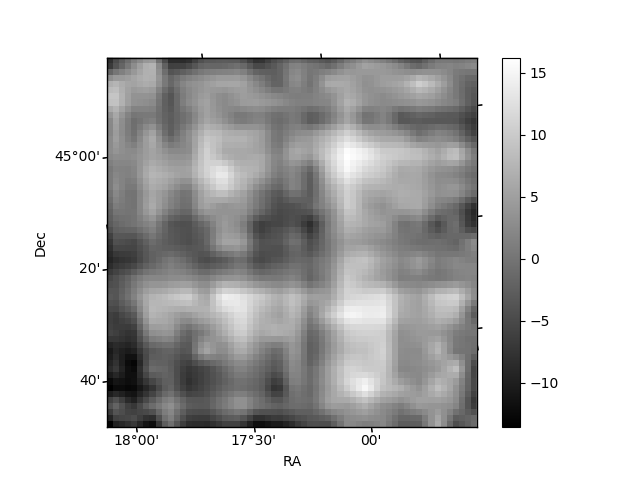
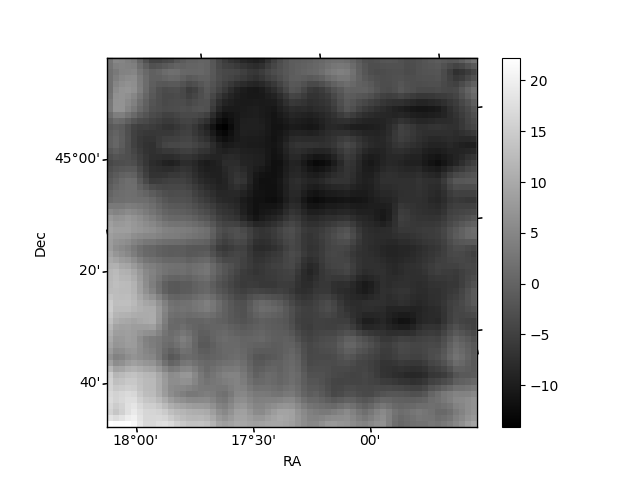
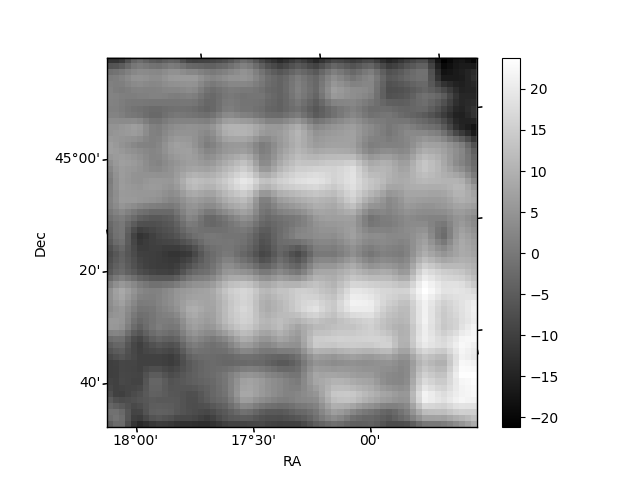
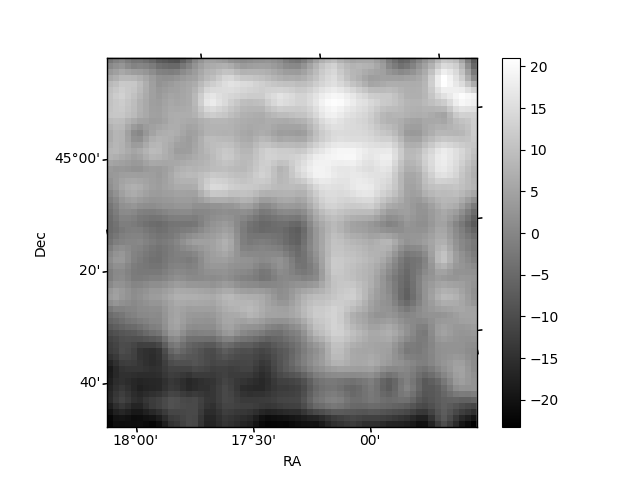
Histogram calculated using DETX and DETY for each event in the final _common_clean file
| Quadrant A | 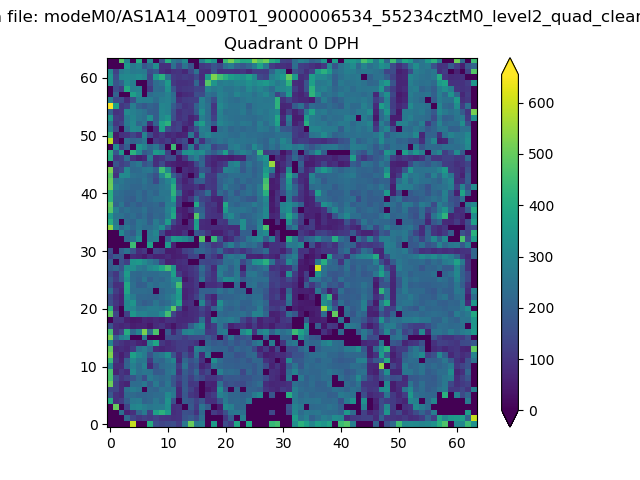 |
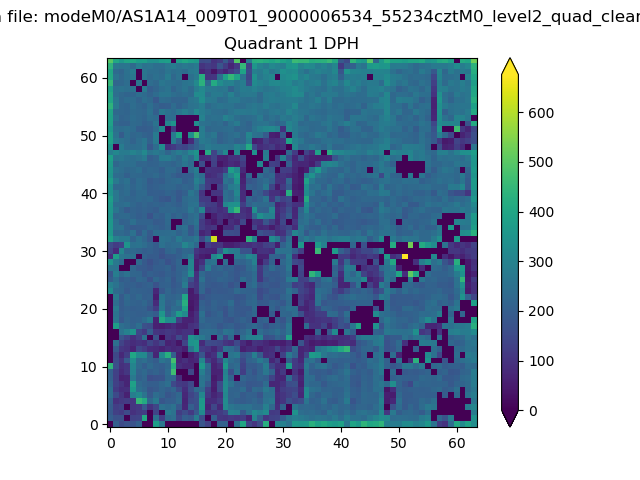 |
Quadrant B |
|---|---|---|---|
| Quadrant D | 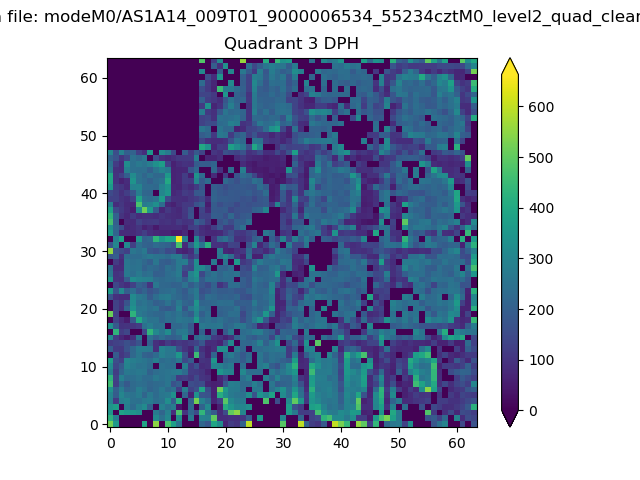 |
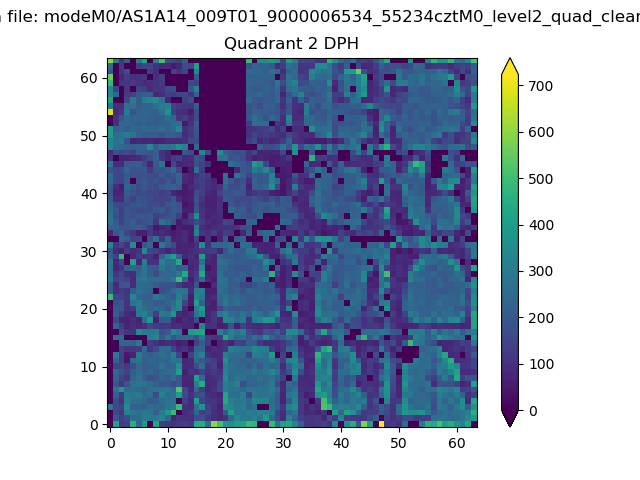 |
Quadrant C |
| Plot type | Count rate plots | Images |
|---|---|---|
| Comparison with Poisson distribution Blue bars denote a histogram of data divided into 1 sec bins. Red curve is a Poisson curve with rate = median count rate of data. |
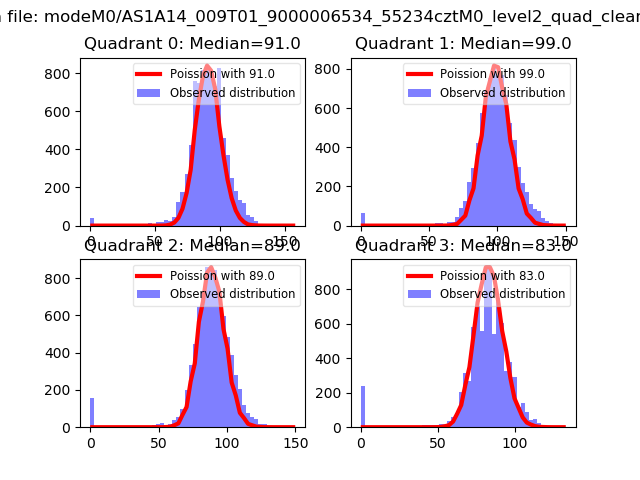 |
 |
| Quadrant-wise count rates Data is divided into 100 sec bins |
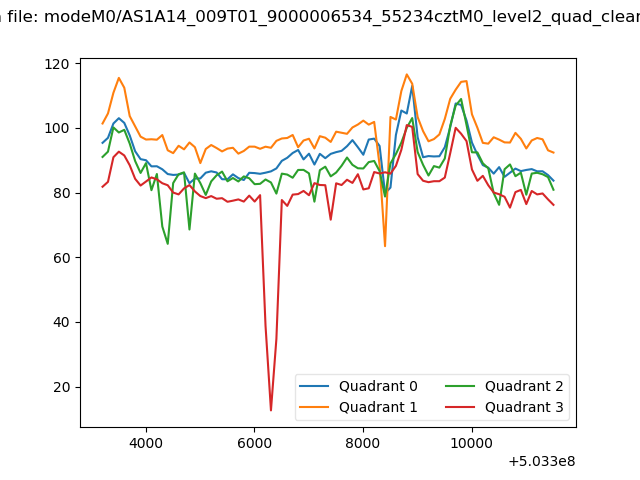 |
|
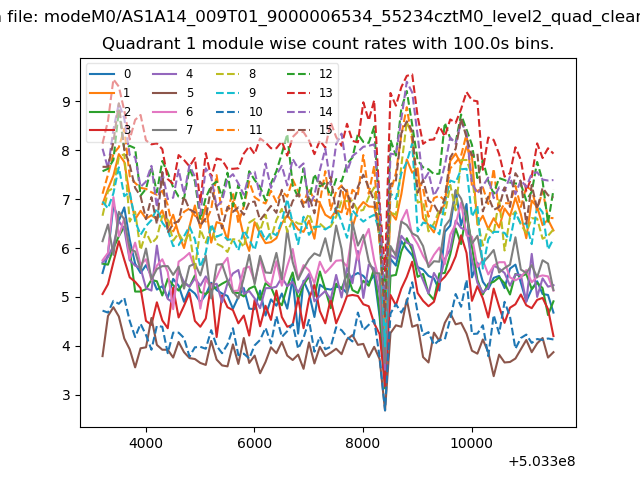
| Module-wise count rates for Quadrant A Data is divided into 100 sec bins |
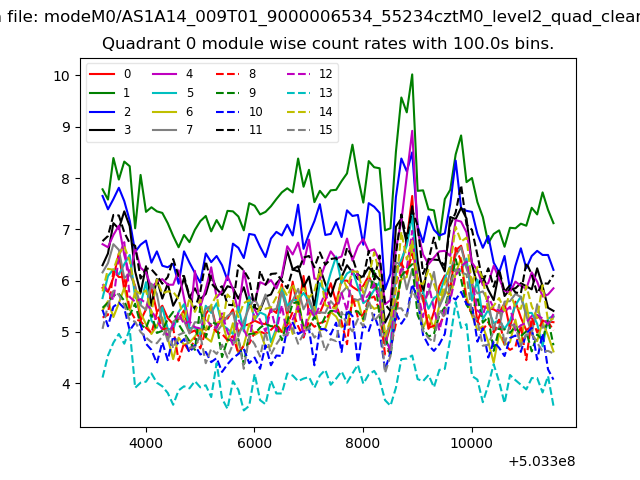 |
 |
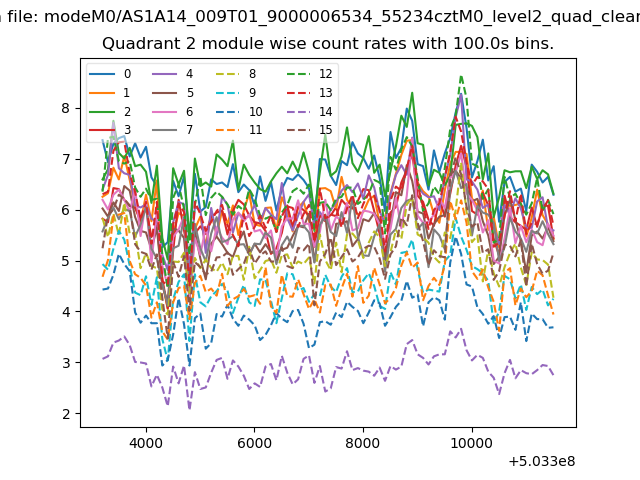
| Module-wise count rates for Quadrant B Data is divided into 100 sec bins |
 |
 |
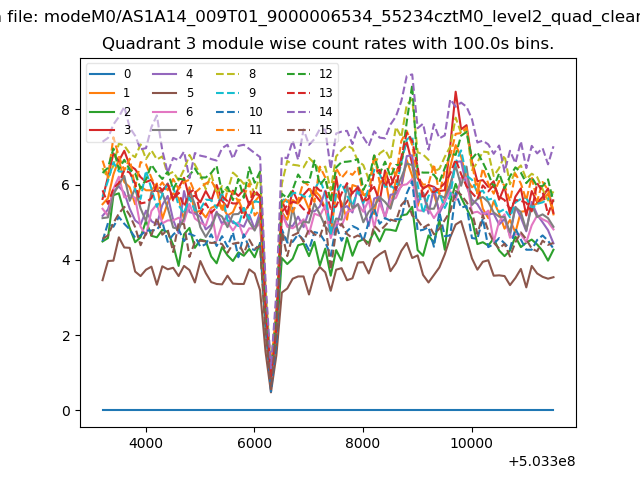
| Module-wise count rates for Quadrant C Data is divided into 100 sec bins |
 |
 |
| Module-wise count rates for Quadrant D Data is divided into 100 sec bins |
 |
 |
| Parameter | Plot |
|---|---|
| CZT HV Monitor | 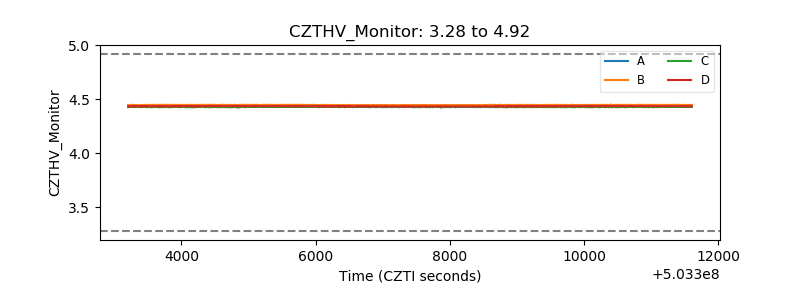 |
| D_VDD | 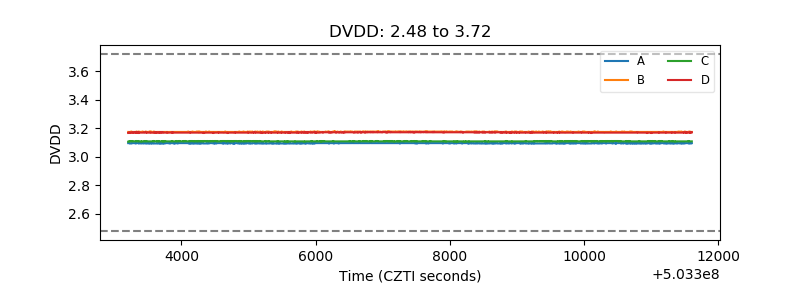 |
| Temperature 1 | 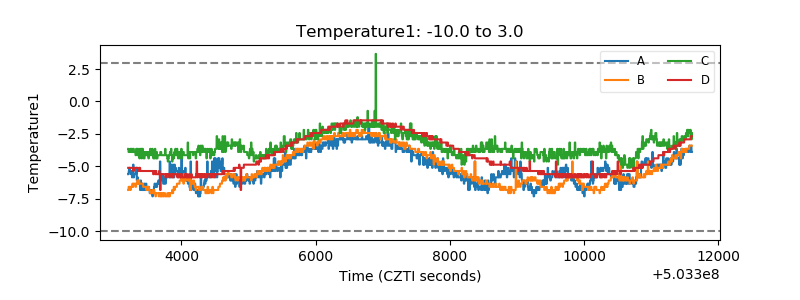 |
| Veto HV Monitor | 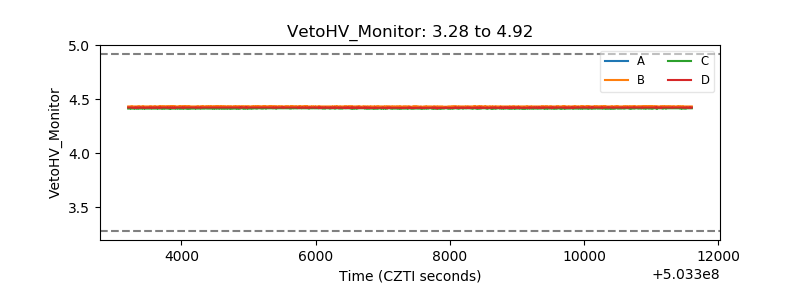 |
| Veto LLD | 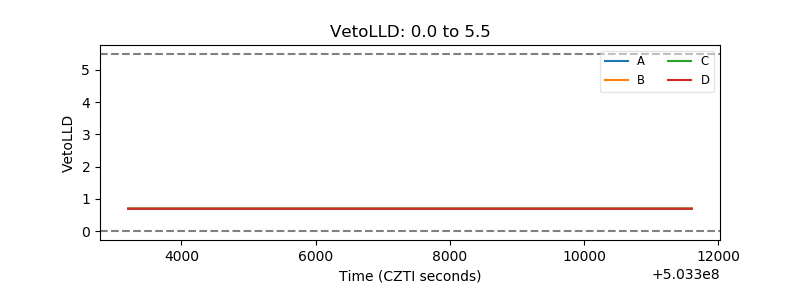 |
| Alpha Counter | 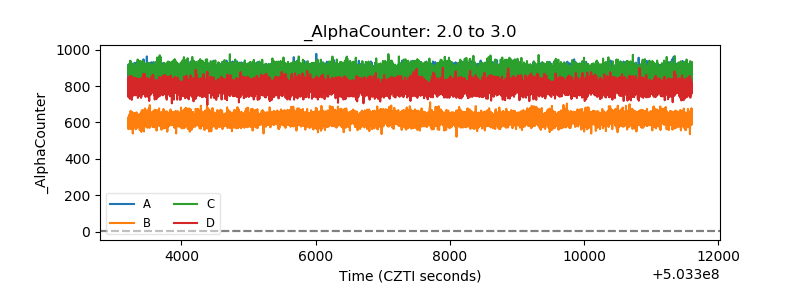 |
| _CPM_Rate | 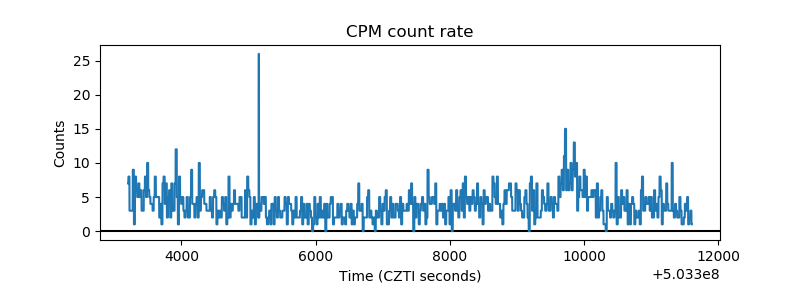 |
| CZT Counter | 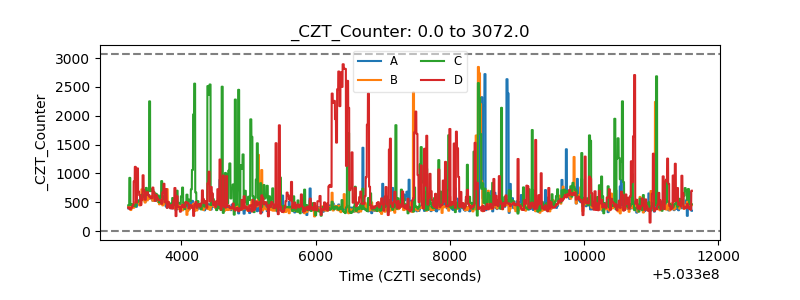 |
| +2.5 Volts monitor | 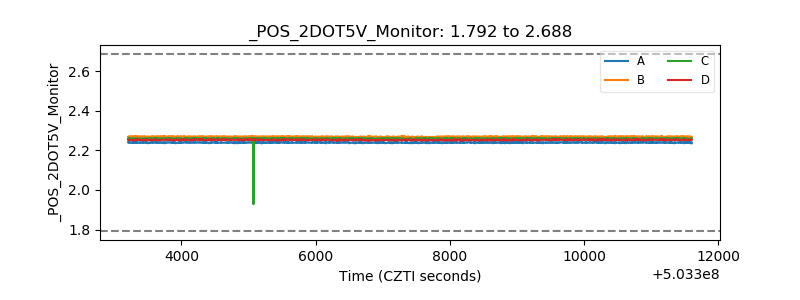 |
| +5 Volts monitor | 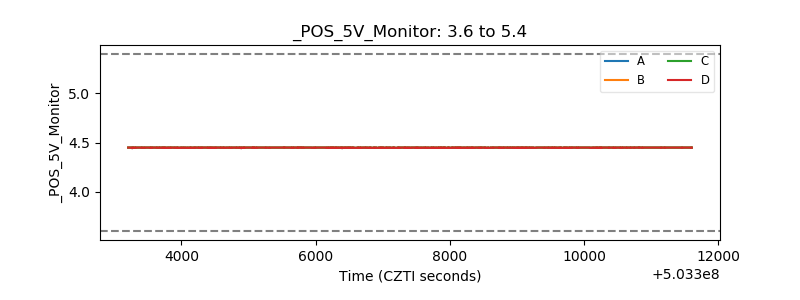 |
| _ROLL_ROT | 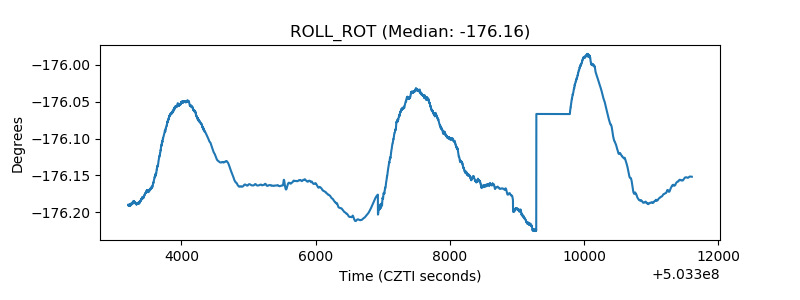 |
| _Roll_DEC | 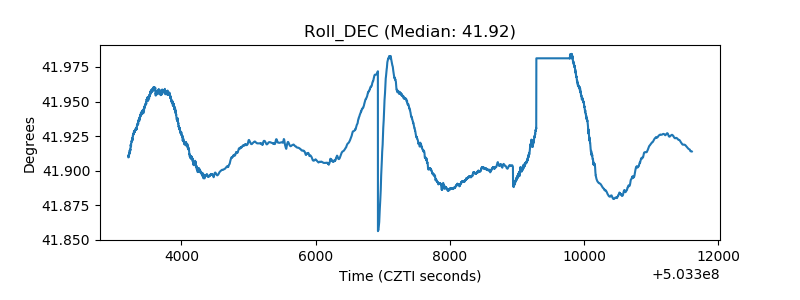 |
| _Roll_RA | 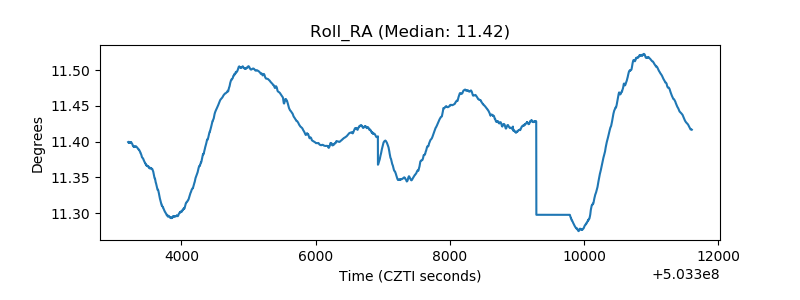 |
| Veto Counter | 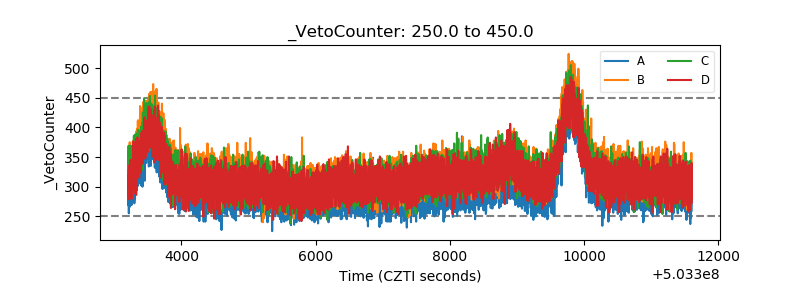 |