| Param | Original file | Final file |
|---|---|---|
| Filename | modeM0/AS1A14_009T01_9000006534_55237cztM0_level2.fits | modeM0/AS1A14_009T01_9000006534_55237cztM0_level2_quad_clean.evt |
| Size (bytes) | 1,243,244,160 | 266,506,560 |
| Size | 1.2 GB | 254.2 MB |
| Events in quadrant A | 10,682,762 | 1,692,324 |
| Events in quadrant B | 9,567,195 | 1,854,941 |
| Events in quadrant C | 12,407,677 | 1,640,379 |
| Events in quadrant D | 11,867,977 | 1,551,637 |
| Mode SS | |||
|---|---|---|---|
| Quadrant | BADHDUFLAG | Total packets | Discarded packets |
| A | 0 | 392 | 0 |
| B | 0 | 392 | 0 |
| C | 0 | 392 | 0 |
| D | 0 | 392 | 0 |
| Mode M0 | |||
|---|---|---|---|
| Quadrant | BADHDUFLAG | Total packets | Discarded packets |
| A | 0 | 46233 | 3 |
| B | 0 | 42970 | 3 |
| C | 0 | 50412 | 3 |
| D | 0 | 49209 | 3 |
| Mode M9 | |||
|---|---|---|---|
| Quadrant | BADHDUFLAG | Total packets | Discarded packets |
| A | 0 | 13 | 0 |
| B | 0 | 13 | 0 |
| C | 0 | 13 | 0 |
| D | 0 | 13 | 0 |
| Quadrant | Total seconds | Saturated seconds | Saturation percentage |
|---|---|---|---|
| A | 19305 | 877 | 4.542865% |
| B | 19305 | 626 | 3.242683% |
| C | 19305 | 957 | 4.957265% |
| D | 19305 | 796 | 4.123284% |
Noise dominated data is calculated using 1-second bins in cleaned event files. If a bin has >2000 counts, and if more than 50% of those come from <1% of pixels, then it is considered to be noise-dominated and hence unusable.
| Quadrant | # 1 sec bins | Bins with >0 counts | Bins with >2000 counts | High rate bins dominated by noise | Noise dominated (total time) | Noise dominated (detector-on time) | Marked lightcurve |
|---|---|---|---|---|---|---|---|
| A | 20529 | 19304 | 522 | 522 | 2.54% | 2.70% | 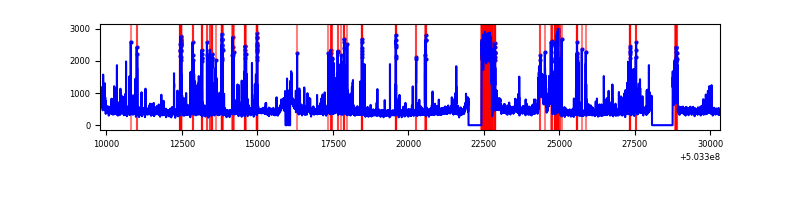 |
| B | 20529 | 19304 | 185 | 185 | 0.90% | 0.96% | 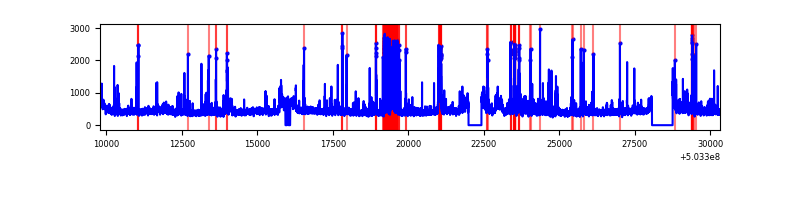 |
| C | 20530 | 19306 | 701 | 701 | 3.41% | 3.63% | 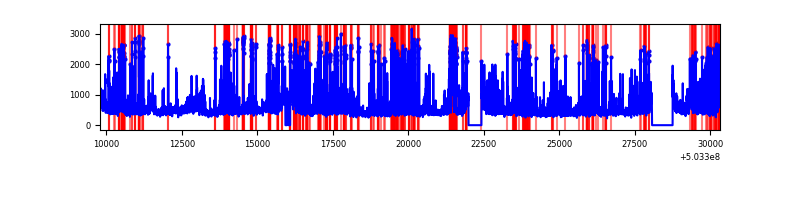 |
| D | 20529 | 19304 | 508 | 508 | 2.47% | 2.63% | 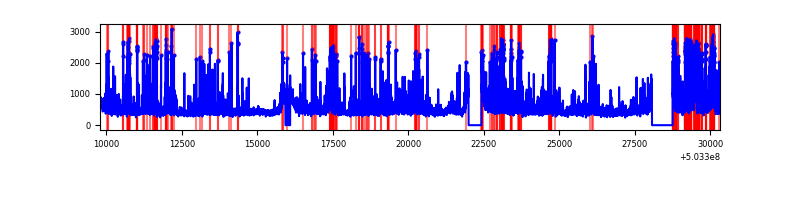 |
Top three noisy pixels from each quadrant. If the there are fewer than three noisy pixels in the level2.evt file, extra rows are filled as -1
| Pixel properties | Quadrant properties | ||||||
|---|---|---|---|---|---|---|---|
| Quadrant | DetID | PixID | Counts | Sigma | Mean | Median | Sigma |
| A | 12 | 115 | 1467723 | 2969.61 | 2007 | 1955 | 493.6 |
| A | 0 | 8 | 489664 | 988.09 | 2007 | 1955 | 493.6 |
| A | 4 | 205 | 266734 | 536.44 | 2007 | 1955 | 493.6 |
| B | 5 | 185 | 567003 | 1317.59 | 2003 | 1924 | 428.9 |
| B | 2 | 249 | 349948 | 811.48 | 2003 | 1924 | 428.9 |
| B | 10 | 245 | 177529 | 409.46 | 2003 | 1924 | 428.9 |
| C | 13 | 3 | 1846940 | 3446.78 | 1962 | 1946 | 535.3 |
| C | 12 | 252 | 755253 | 1407.31 | 1962 | 1946 | 535.3 |
| C | 9 | 38 | 635965 | 1184.46 | 1962 | 1946 | 535.3 |
| D | 8 | 160 | 1341177 | 2398.93 | 1974 | 1880 | 558.3 |
| D | 2 | 249 | 1021280 | 1825.94 | 1974 | 1880 | 558.3 |
| D | 11 | 129 | 918558 | 1641.94 | 1974 | 1880 | 558.3 |
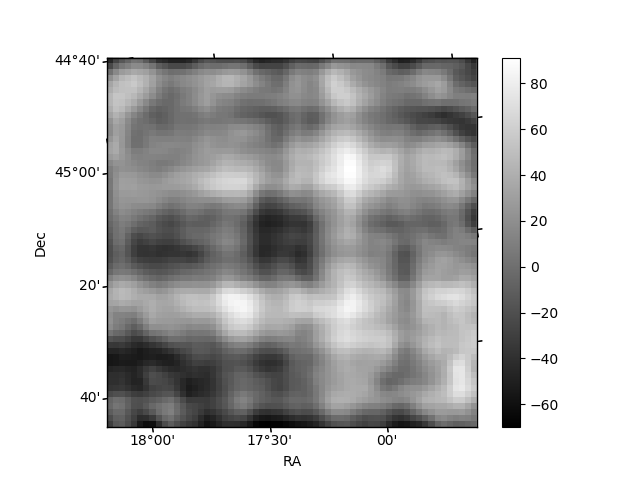
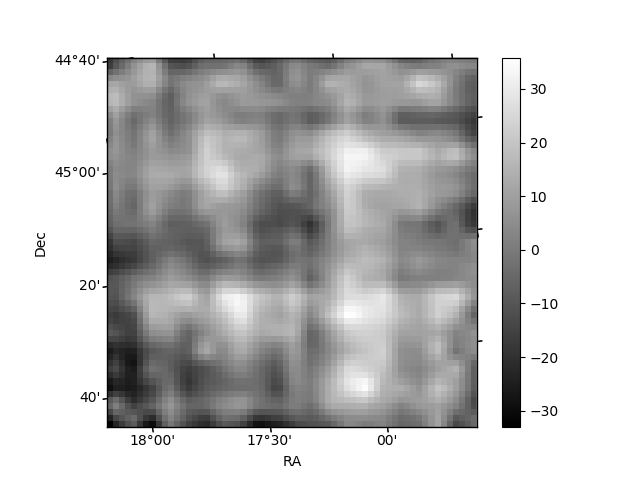
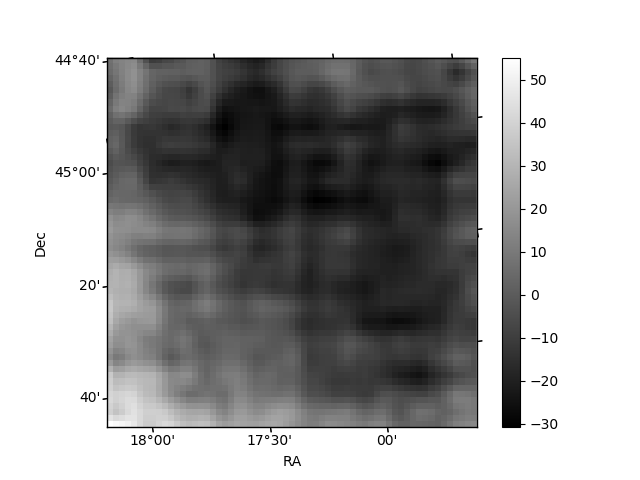
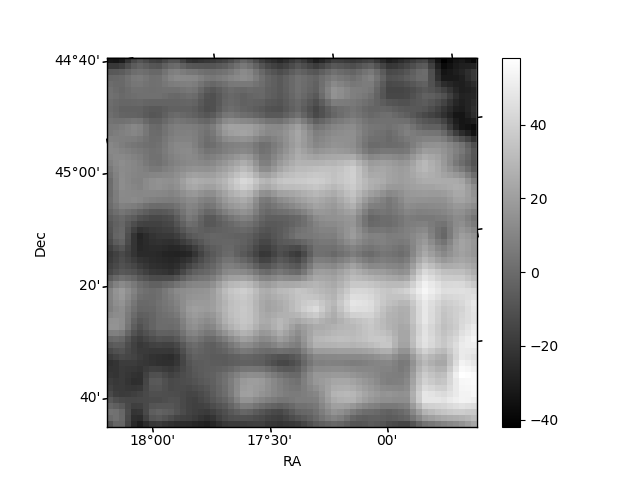
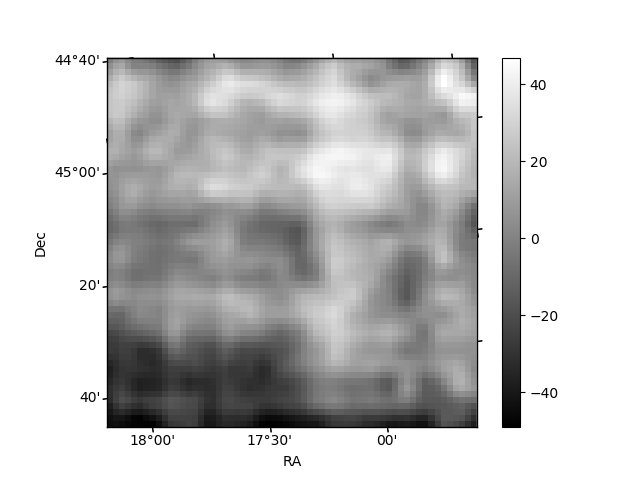
Histogram calculated using DETX and DETY for each event in the final _common_clean file
| Quadrant A | 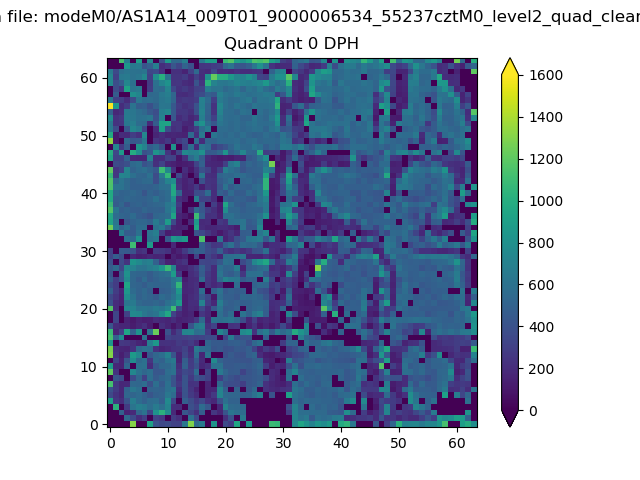 |
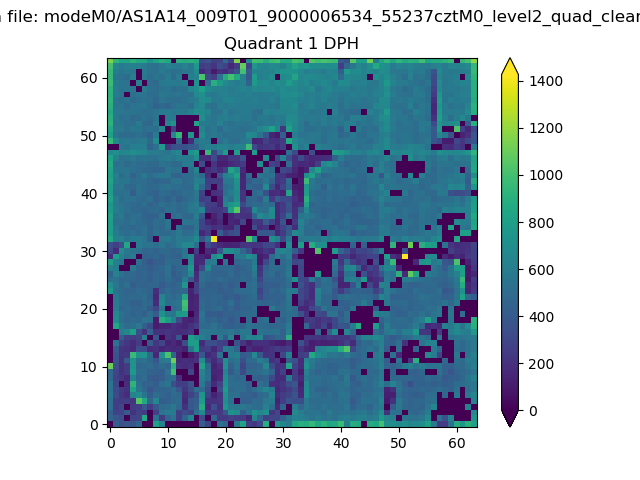 |
Quadrant B |
|---|---|---|---|
| Quadrant D | 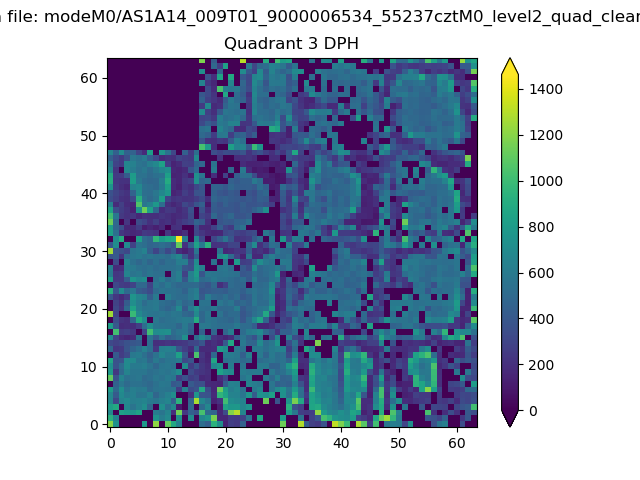 |
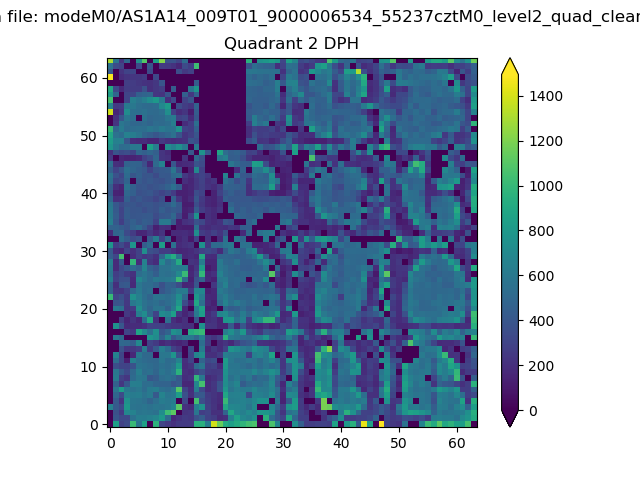 |
Quadrant C |
| Plot type | Count rate plots | Images |
|---|---|---|
| Comparison with Poisson distribution Blue bars denote a histogram of data divided into 1 sec bins. Red curve is a Poisson curve with rate = median count rate of data. |
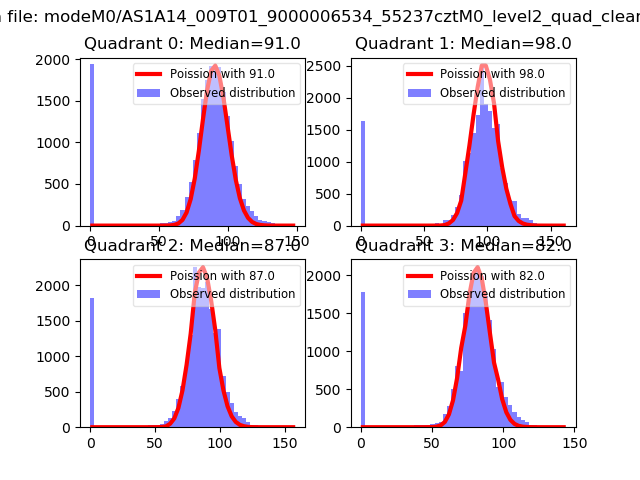 |
 |
| Quadrant-wise count rates Data is divided into 100 sec bins |
 |
|
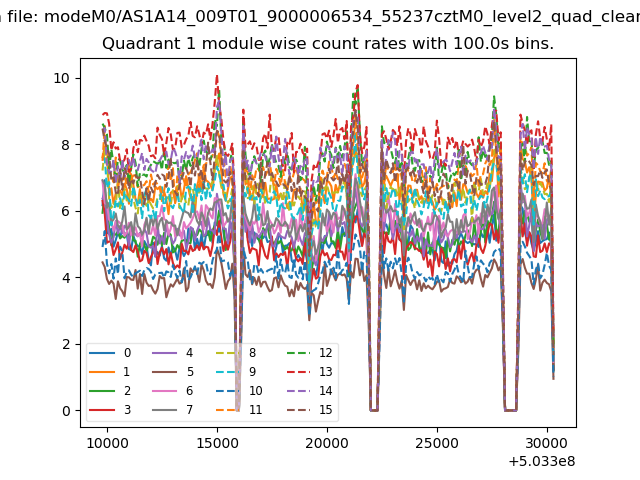
| Module-wise count rates for Quadrant A Data is divided into 100 sec bins |
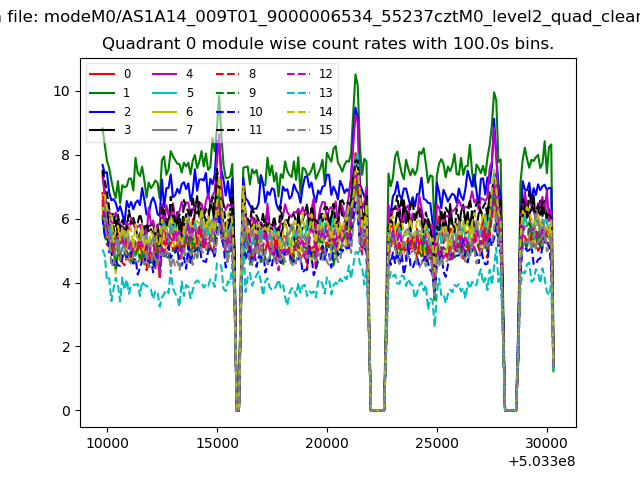 |
 |
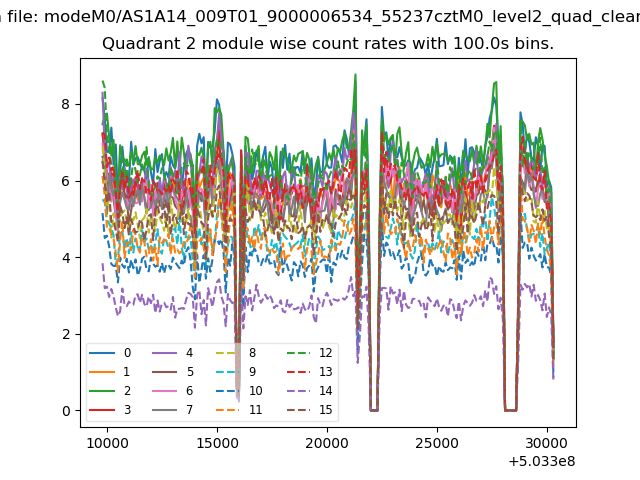
| Module-wise count rates for Quadrant B Data is divided into 100 sec bins |
 |
 |
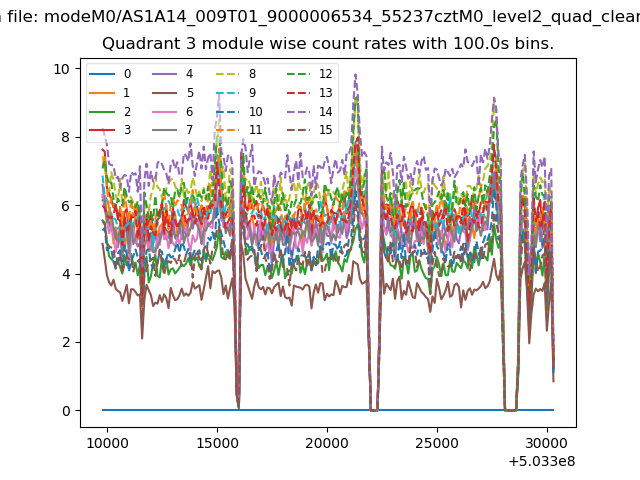
| Module-wise count rates for Quadrant C Data is divided into 100 sec bins |
 |
 |
| Module-wise count rates for Quadrant D Data is divided into 100 sec bins |
 |
 |
| Parameter | Plot |
|---|---|
| CZT HV Monitor | 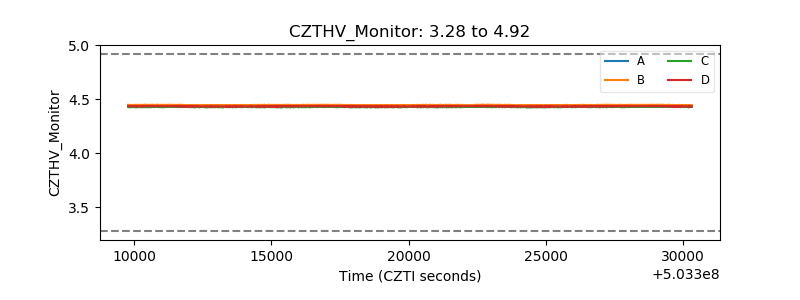 |
| D_VDD | 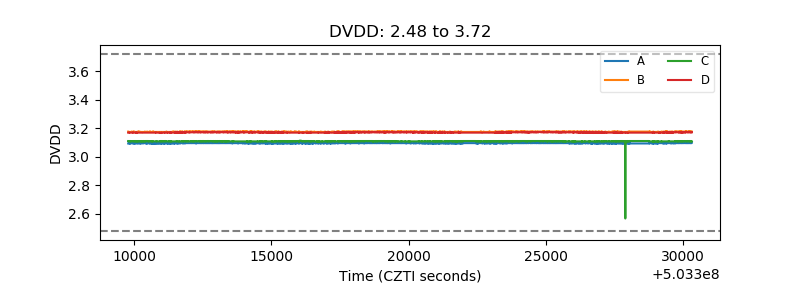 |
| Temperature 1 | 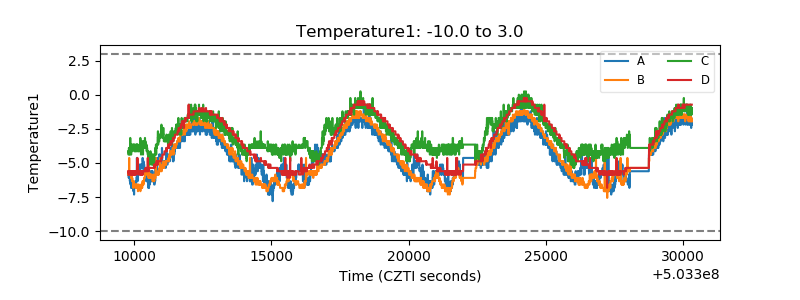 |
| Veto HV Monitor | 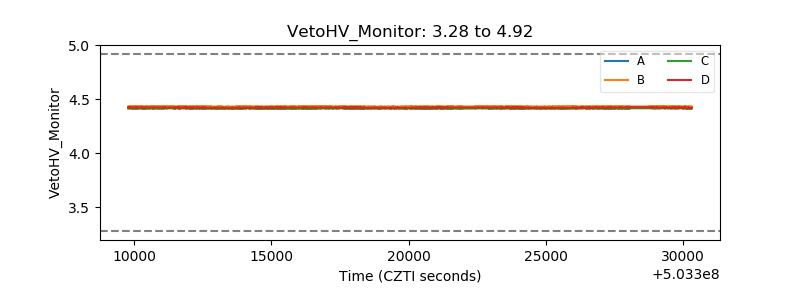 |
| Veto LLD | 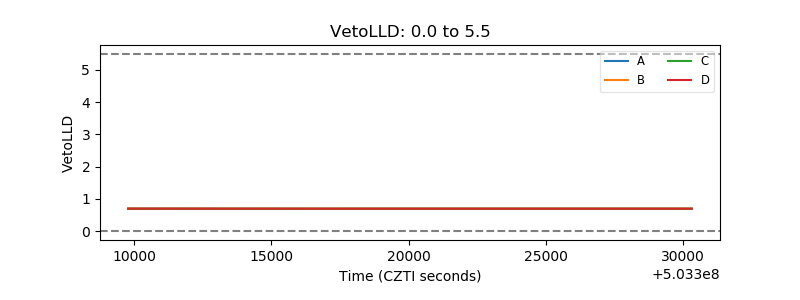 |
| Alpha Counter | 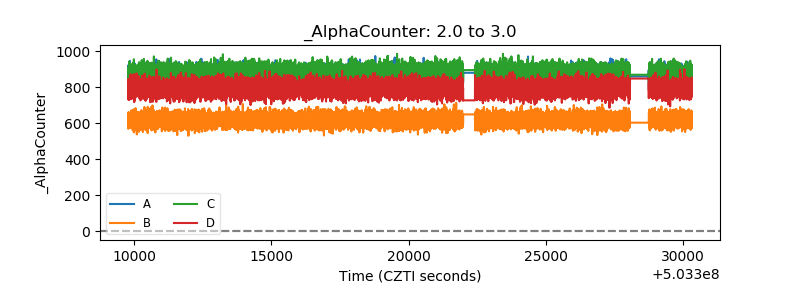 |
| _CPM_Rate | 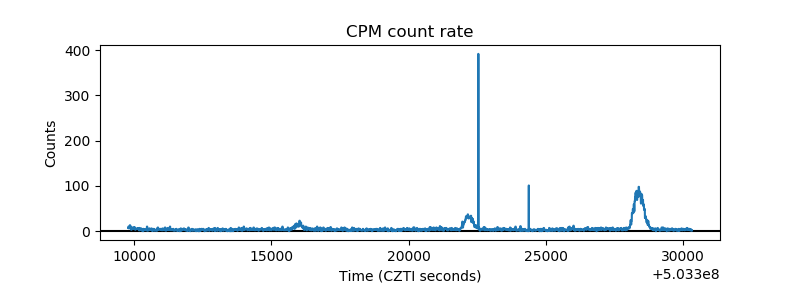 |
| CZT Counter | 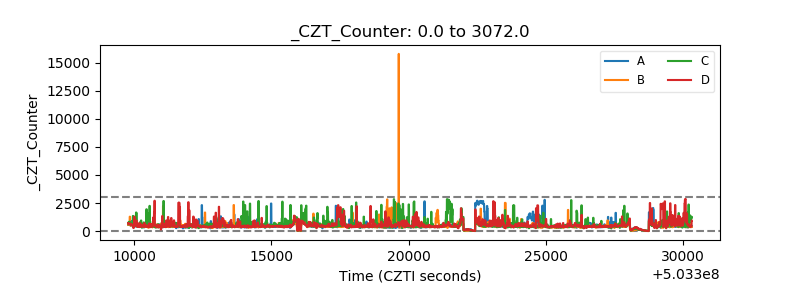 |
| +2.5 Volts monitor |  |
| +5 Volts monitor |  |
| _ROLL_ROT | 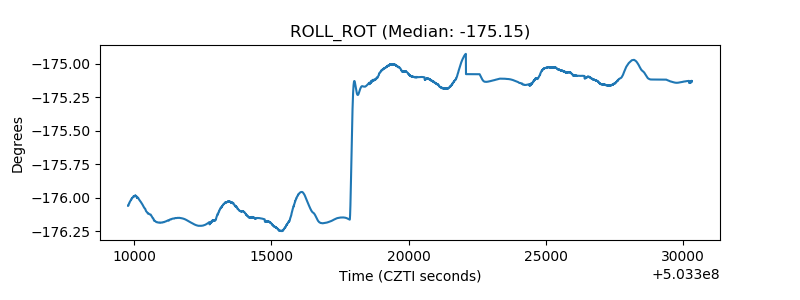 |
| _Roll_DEC | 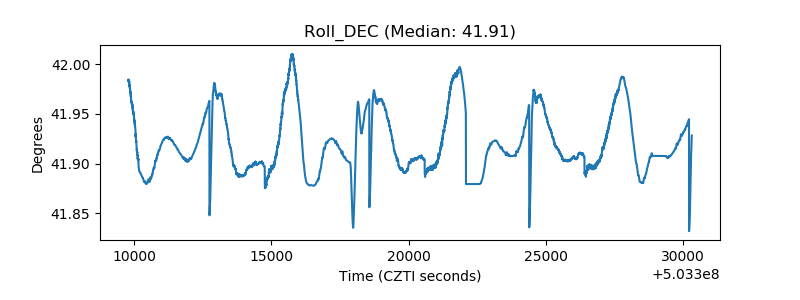 |
| _Roll_RA | 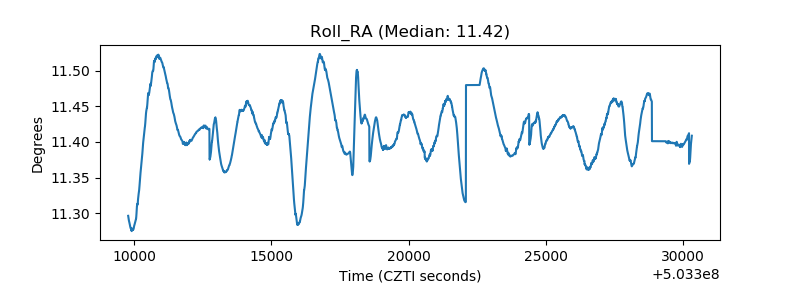 |
| Veto Counter | 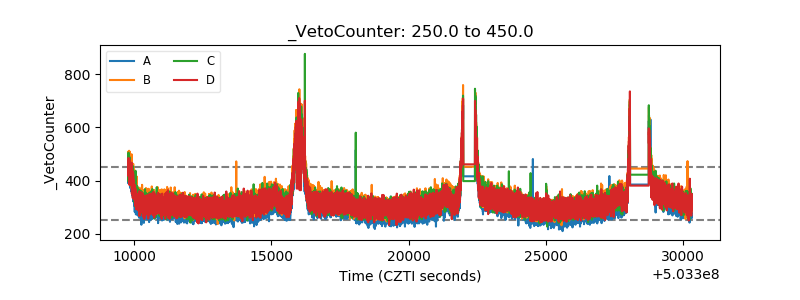 |