| Param | Original file | Final file |
|---|---|---|
| Filename | modeM0/AS1A14_009T01_9000006534_55240cztM0_level2.fits | modeM0/AS1A14_009T01_9000006534_55240cztM0_level2_quad_clean.evt |
| Size (bytes) | 570,790,080 | 92,960,640 |
| Size | 544.3 MB | 88.7 MB |
| Events in quadrant A | 4,824,017 | 602,752 |
| Events in quadrant B | 3,342,920 | 683,309 |
| Events in quadrant C | 7,539,252 | 508,639 |
| Events in quadrant D | 4,898,736 | 549,759 |
| Mode SS | |||
|---|---|---|---|
| Quadrant | BADHDUFLAG | Total packets | Discarded packets |
| A | 0 | 136 | 0 |
| B | 0 | 136 | 0 |
| C | 0 | 136 | 0 |
| D | 0 | 136 | 0 |
| Mode M0 | |||
|---|---|---|---|
| Quadrant | BADHDUFLAG | Total packets | Discarded packets |
| A | 0 | 19487 | 2 |
| B | 0 | 14991 | 2 |
| C | 0 | 27147 | 2 |
| D | 0 | 19577 | 3 |
| Mode M9 | |||
|---|---|---|---|
| Quadrant | BADHDUFLAG | Total packets | Discarded packets |
| A | 0 | 11 | 0 |
| B | 0 | 11 | 0 |
| C | 0 | 12 | 0 |
| D | 0 | 12 | 0 |
| Quadrant | Total seconds | Saturated seconds | Saturation percentage |
|---|---|---|---|
| A | 6746 | 639 | 9.472280% |
| B | 6746 | 100 | 1.482360% |
| C | 6746 | 1420 | 21.049511% |
| D | 6745 | 463 | 6.864344% |
Noise dominated data is calculated using 1-second bins in cleaned event files. If a bin has >2000 counts, and if more than 50% of those come from <1% of pixels, then it is considered to be noise-dominated and hence unusable.
| Quadrant | # 1 sec bins | Bins with >0 counts | Bins with >2000 counts | High rate bins dominated by noise | Noise dominated (total time) | Noise dominated (detector-on time) | Marked lightcurve |
|---|---|---|---|---|---|---|---|
| A | 7735 | 6746 | 453 | 453 | 5.86% | 6.72% | 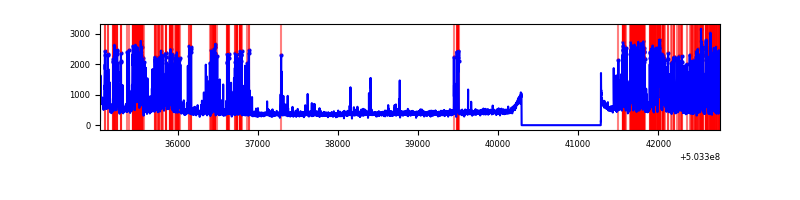 |
| B | 7736 | 6747 | 56 | 56 | 0.72% | 0.83% | 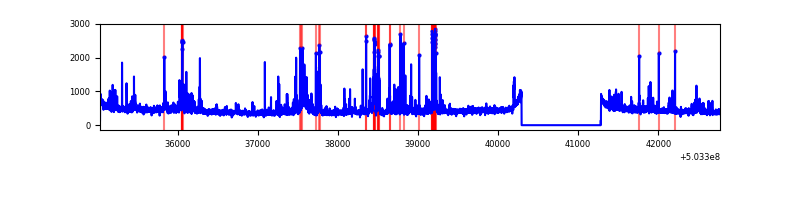 |
| C | 7736 | 6747 | 1334 | 1334 | 17.24% | 19.77% | 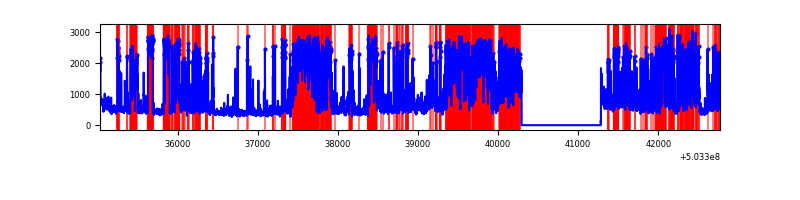 |
| D | 7735 | 6746 | 406 | 406 | 5.25% | 6.02% | 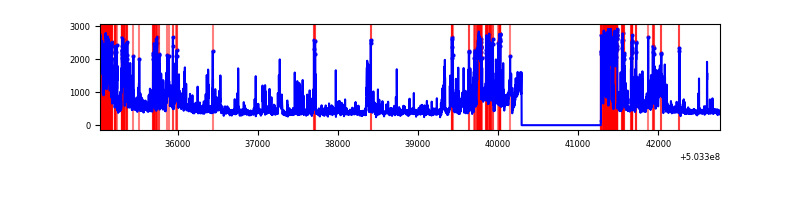 |
Top three noisy pixels from each quadrant. If the there are fewer than three noisy pixels in the level2.evt file, extra rows are filled as -1
| Pixel properties | Quadrant properties | ||||||
|---|---|---|---|---|---|---|---|
| Quadrant | DetID | PixID | Counts | Sigma | Mean | Median | Sigma |
| A | 12 | 3 | 1348296 | 7876.49 | 687 | 672 | 171.1 |
| A | 0 | 8 | 495911 | 2894.54 | 687 | 672 | 171.1 |
| A | 12 | 194 | 164389 | 956.88 | 687 | 672 | 171.1 |
| B | 5 | 185 | 180511 | 1193.27 | 700 | 673 | 150.7 |
| B | 2 | 249 | 153837 | 1016.28 | 700 | 673 | 150.7 |
| B | 0 | 182 | 100923 | 665.19 | 700 | 673 | 150.7 |
| C | 12 | 254 | 3058196 | 17482.37 | 629 | 622 | 174.9 |
| C | 9 | 38 | 731391 | 4178.34 | 629 | 622 | 174.9 |
| C | 1 | 16 | 428644 | 2447.31 | 629 | 622 | 174.9 |
| D | 8 | 160 | 1487327 | 7784.24 | 674 | 646 | 191.0 |
| D | 2 | 249 | 318553 | 1664.56 | 674 | 646 | 191.0 |
| D | 11 | 129 | 136216 | 709.84 | 674 | 646 | 191.0 |
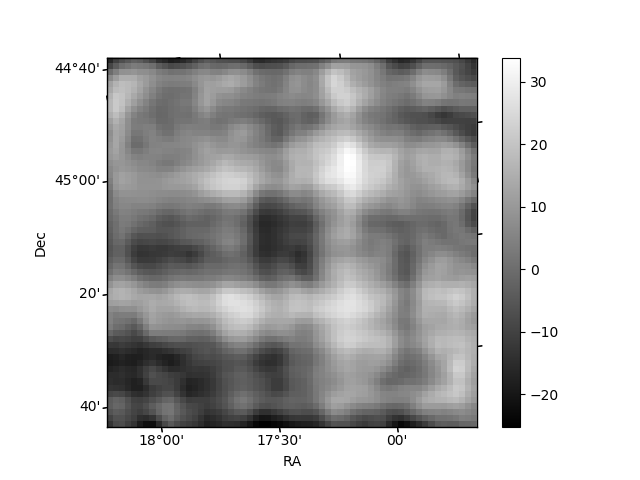
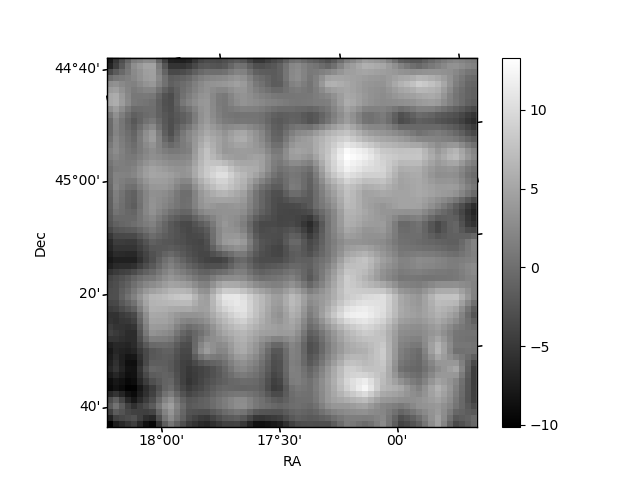
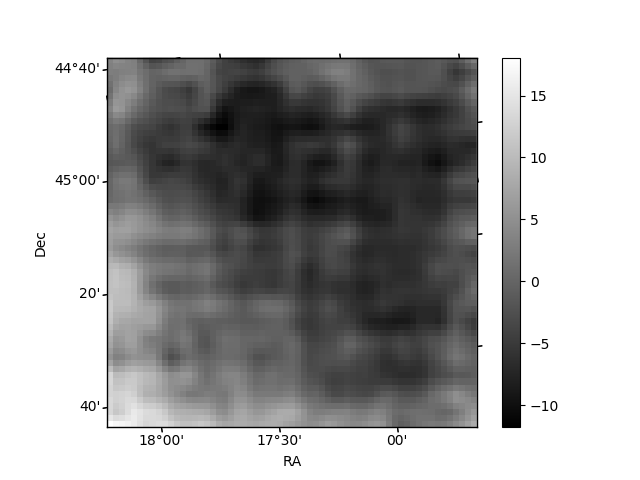
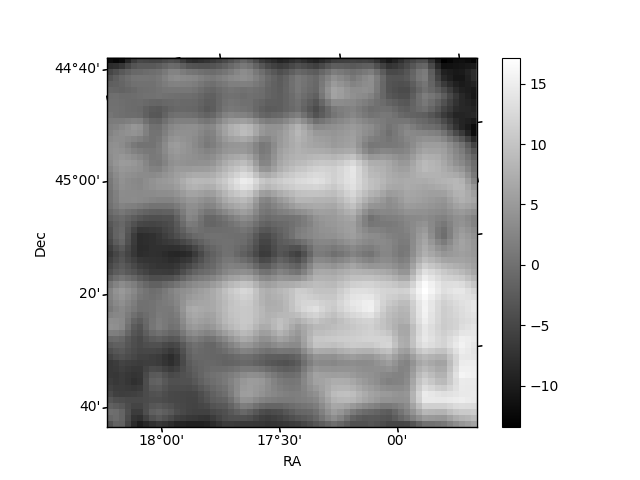
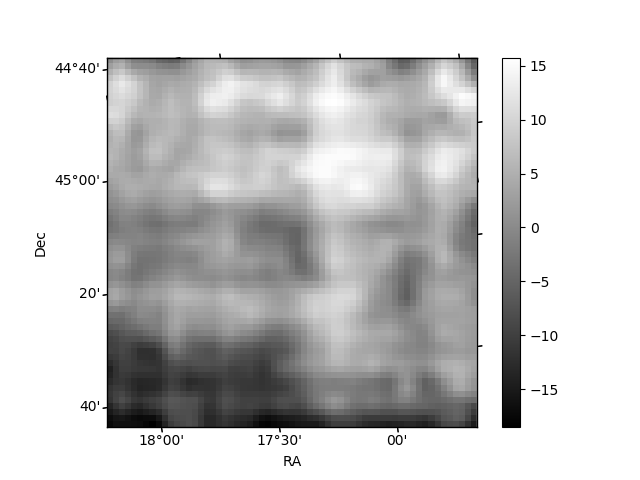
Histogram calculated using DETX and DETY for each event in the final _common_clean file
| Quadrant A | 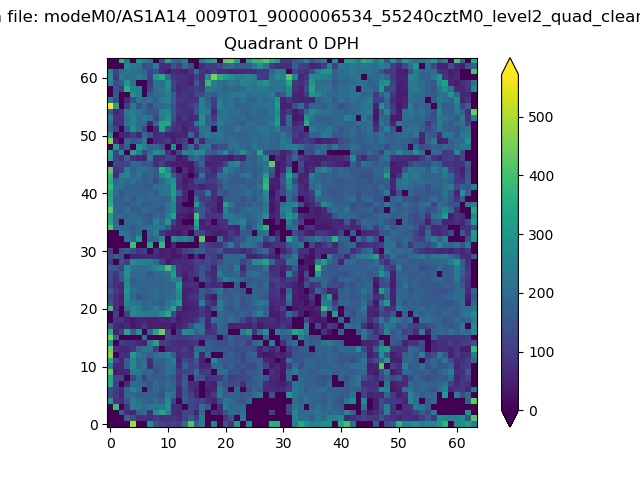 |
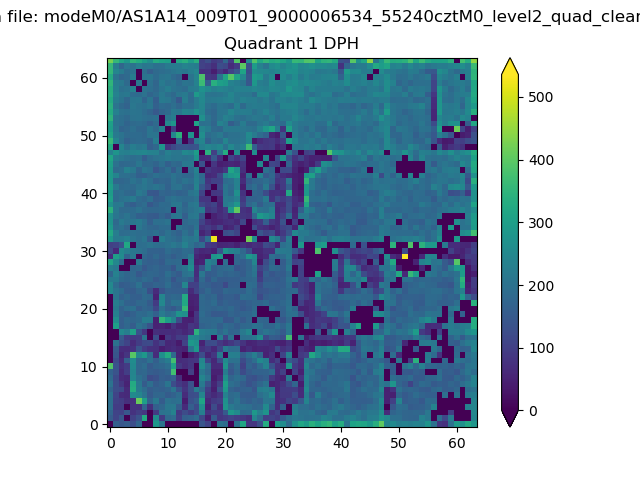 |
Quadrant B |
|---|---|---|---|
| Quadrant D | 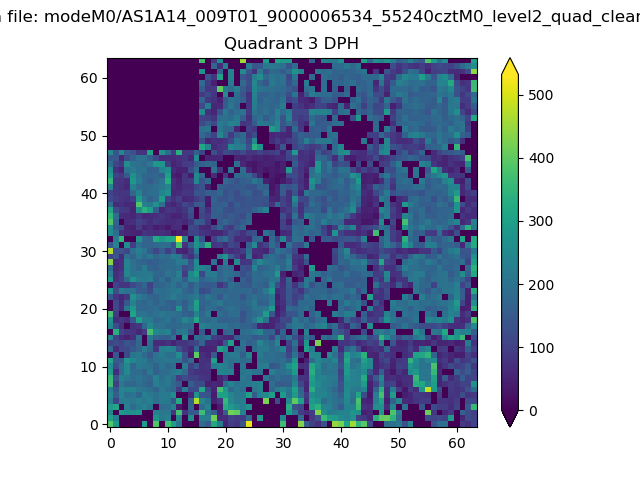 |
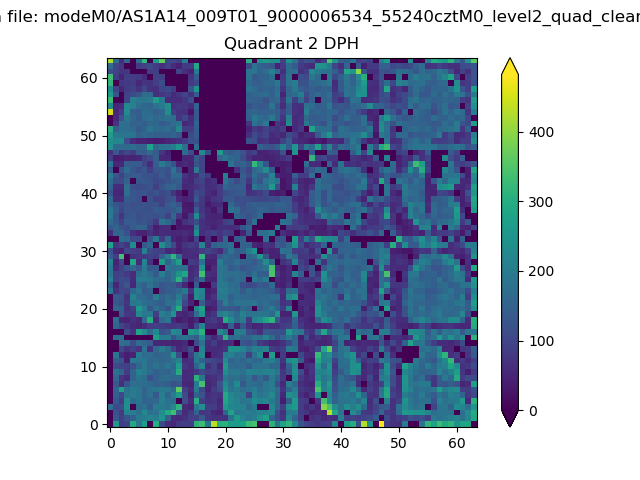 |
Quadrant C |
| Plot type | Count rate plots | Images |
|---|---|---|
| Comparison with Poisson distribution Blue bars denote a histogram of data divided into 1 sec bins. Red curve is a Poisson curve with rate = median count rate of data. |
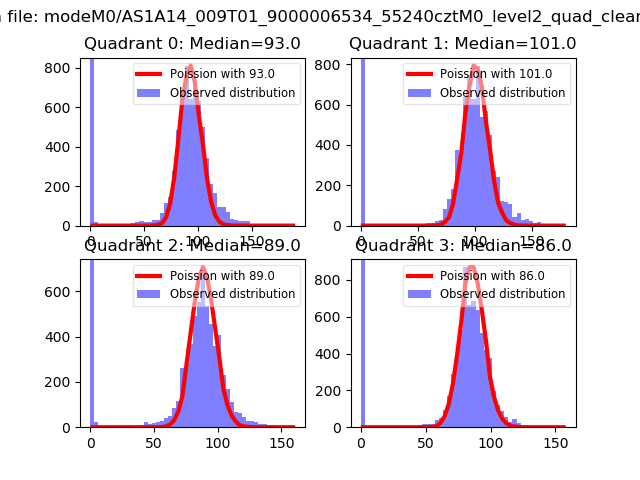 |
 |
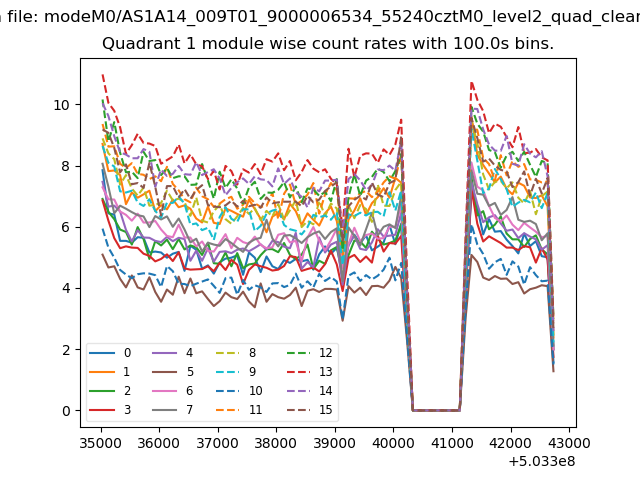
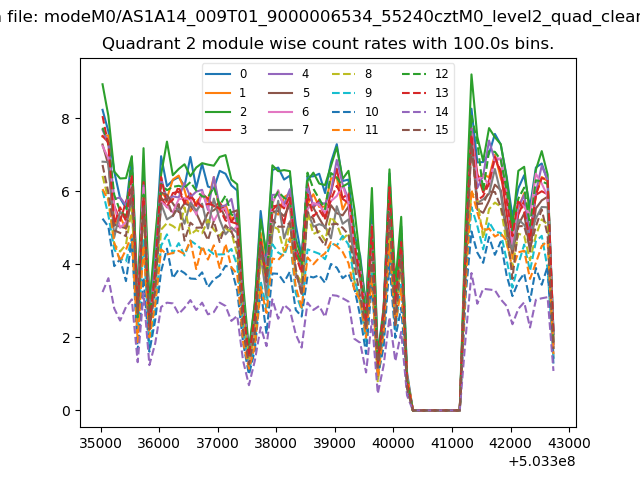
| Quadrant-wise count rates Data is divided into 100 sec bins |
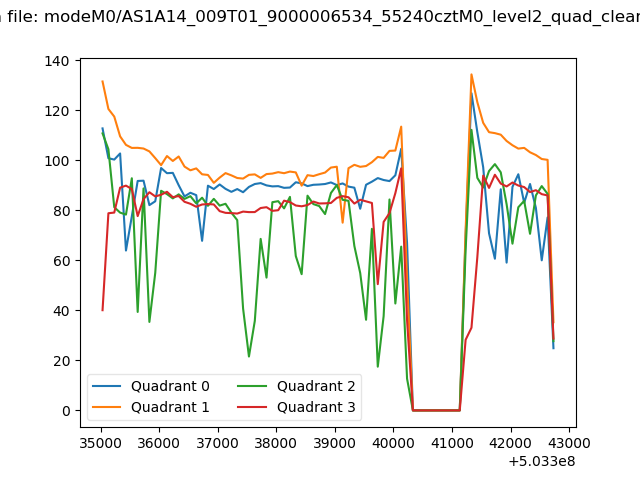 |
|
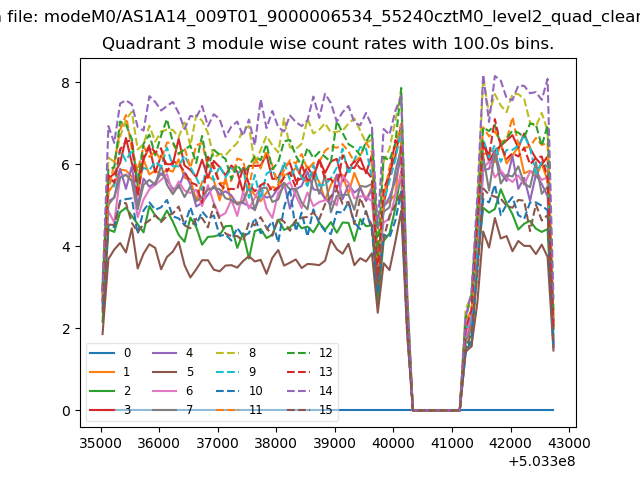
| Module-wise count rates for Quadrant A Data is divided into 100 sec bins |
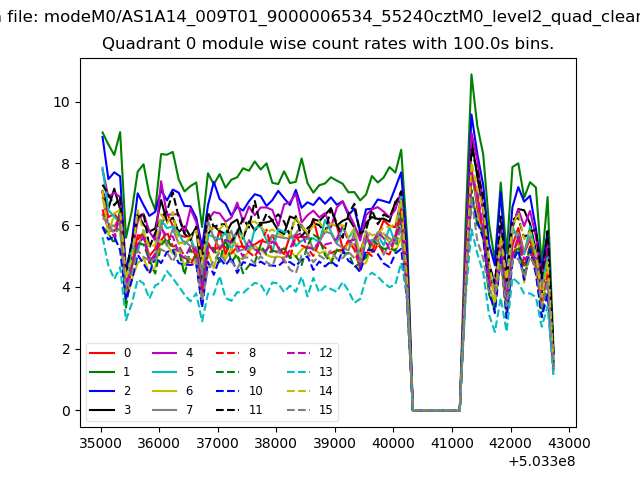 |
 |
| Module-wise count rates for Quadrant B Data is divided into 100 sec bins |
 |
 |
| Module-wise count rates for Quadrant C Data is divided into 100 sec bins |
 |
 |
| Module-wise count rates for Quadrant D Data is divided into 100 sec bins |
 |
 |
| Parameter | Plot |
|---|---|
| CZT HV Monitor | 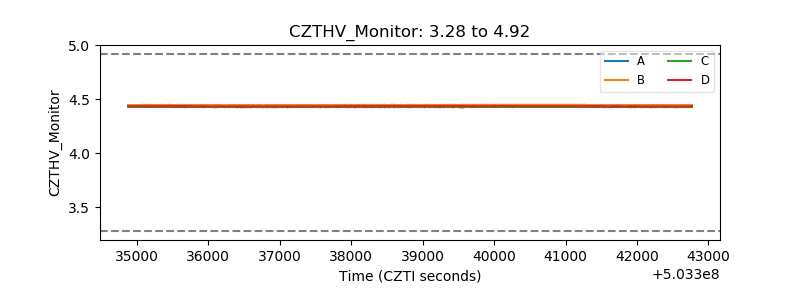 |
| D_VDD | 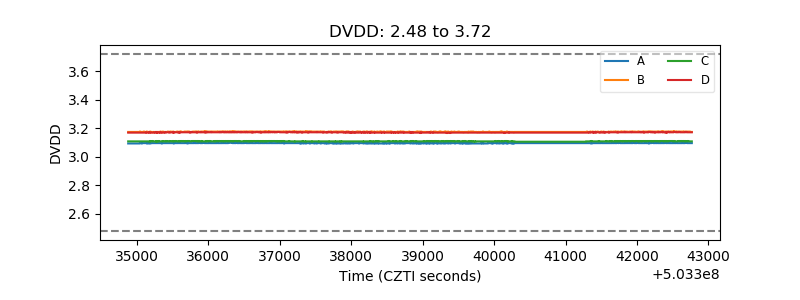 |
| Temperature 1 | 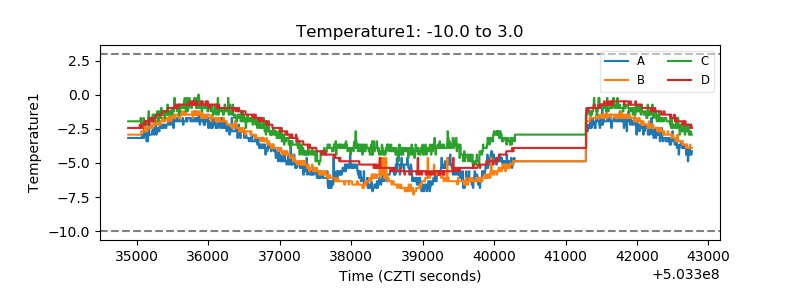 |
| Veto HV Monitor | 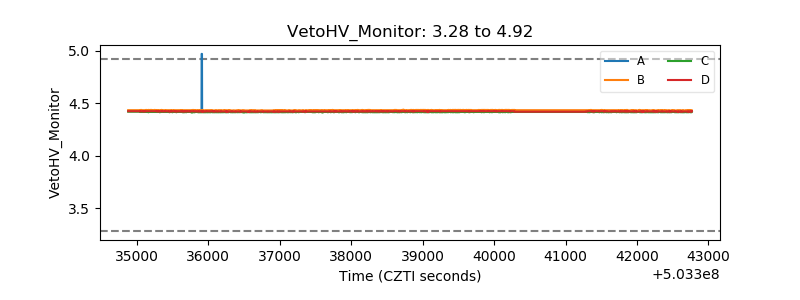 |
| Veto LLD | 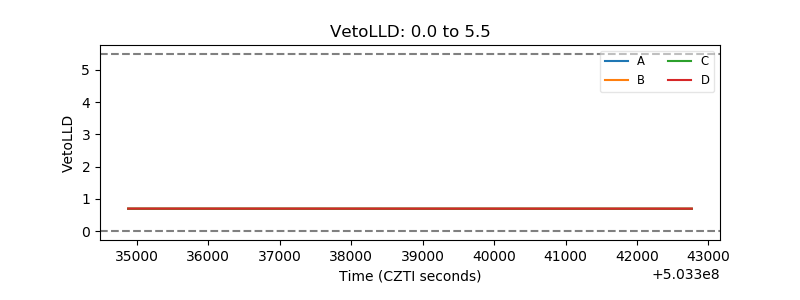 |
| Alpha Counter | 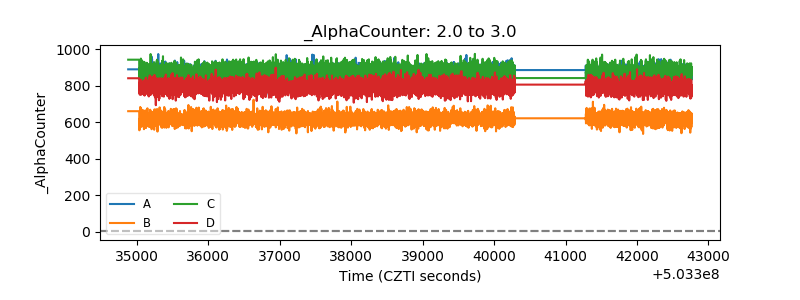 |
| _CPM_Rate | 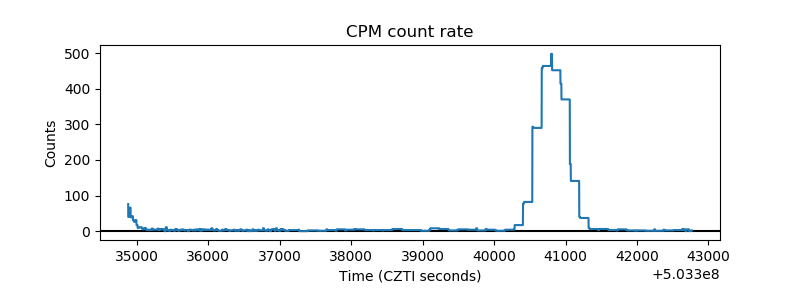 |
| CZT Counter | 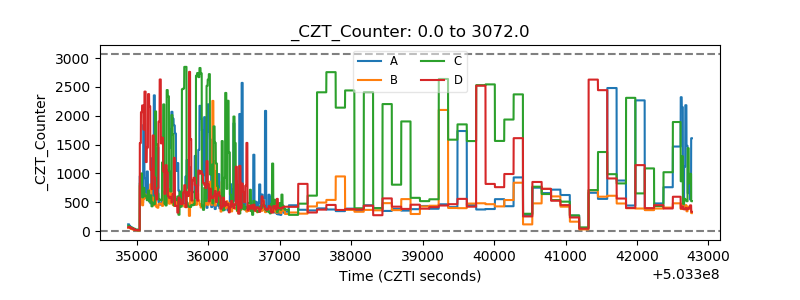 |
| +2.5 Volts monitor | 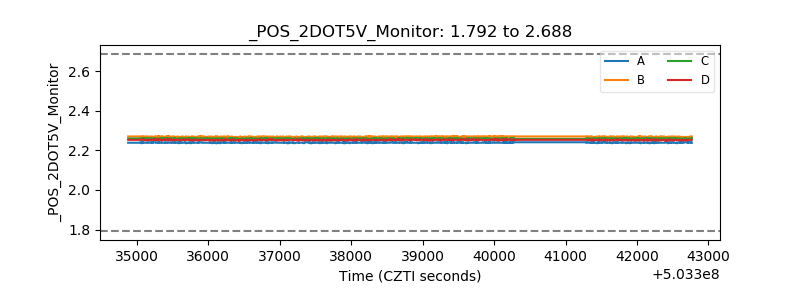 |
| +5 Volts monitor | 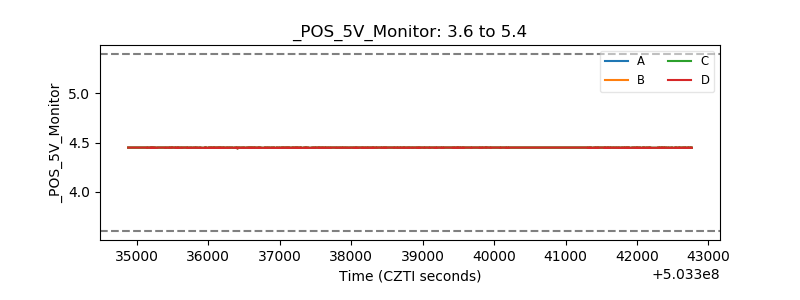 |
| _ROLL_ROT | 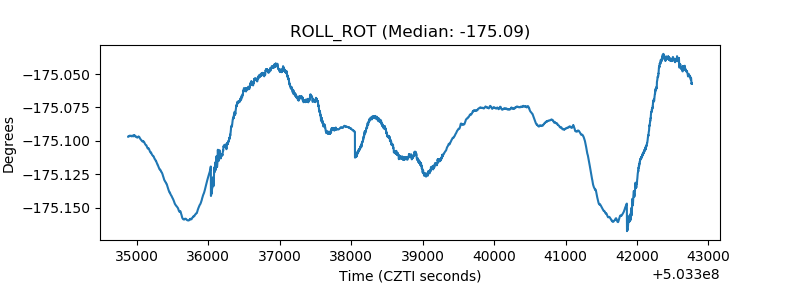 |
| _Roll_DEC | 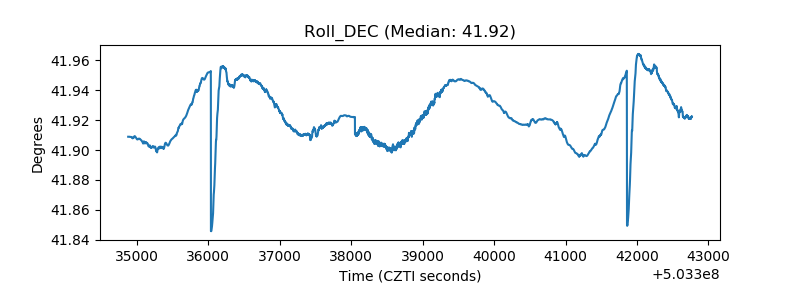 |
| _Roll_RA | 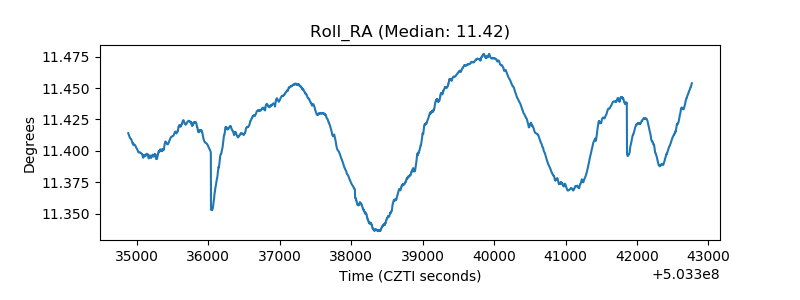 |
| Veto Counter | 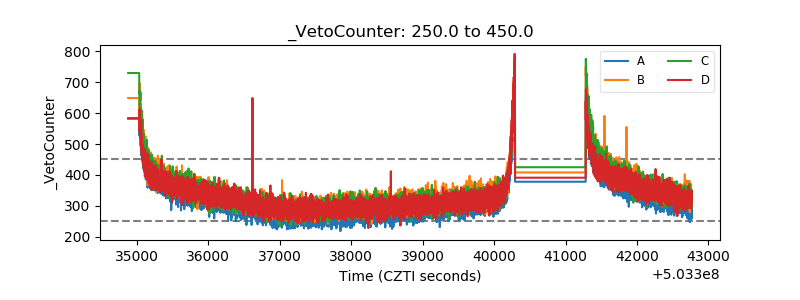 |