| Param | Original file | Final file |
|---|---|---|
| Filename | modeM0/AS1A14_009T01_9000006534_55242cztM0_level2.fits | modeM0/AS1A14_009T01_9000006534_55242cztM0_level2_quad_clean.evt |
| Size (bytes) | 491,402,880 | 93,179,520 |
| Size | 468.6 MB | 88.9 MB |
| Events in quadrant A | 3,998,838 | 612,353 |
| Events in quadrant B | 2,961,832 | 673,574 |
| Events in quadrant C | 6,271,518 | 537,126 |
| Events in quadrant D | 4,457,372 | 548,503 |
| Mode SS | |||
|---|---|---|---|
| Quadrant | BADHDUFLAG | Total packets | Discarded packets |
| A | 0 | 132 | 0 |
| B | 0 | 132 | 0 |
| C | 0 | 132 | 0 |
| D | 0 | 132 | 0 |
| Mode M0 | |||
|---|---|---|---|
| Quadrant | BADHDUFLAG | Total packets | Discarded packets |
| A | 0 | 16528 | 2 |
| B | 0 | 13647 | 2 |
| C | 0 | 23219 | 2 |
| D | 0 | 17876 | 2 |
| Mode M9 | |||
|---|---|---|---|
| Quadrant | BADHDUFLAG | Total packets | Discarded packets |
| A | 0 | 15 | 0 |
| B | 0 | 16 | 0 |
| C | 0 | 16 | 0 |
| D | 0 | 16 | 0 |
| Quadrant | Total seconds | Saturated seconds | Saturation percentage |
|---|---|---|---|
| A | 6442 | 284 | 4.408569% |
| B | 6442 | 61 | 0.946911% |
| C | 6442 | 967 | 15.010866% |
| D | 6442 | 291 | 4.517231% |
Noise dominated data is calculated using 1-second bins in cleaned event files. If a bin has >2000 counts, and if more than 50% of those come from <1% of pixels, then it is considered to be noise-dominated and hence unusable.
| Quadrant | # 1 sec bins | Bins with >0 counts | Bins with >2000 counts | High rate bins dominated by noise | Noise dominated (total time) | Noise dominated (detector-on time) | Marked lightcurve |
|---|---|---|---|---|---|---|---|
| A | 7592 | 6443 | 190 | 190 | 2.50% | 2.95% | 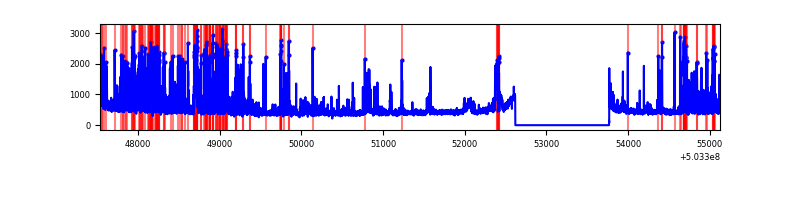 |
| B | 7592 | 6443 | 22 | 22 | 0.29% | 0.34% | 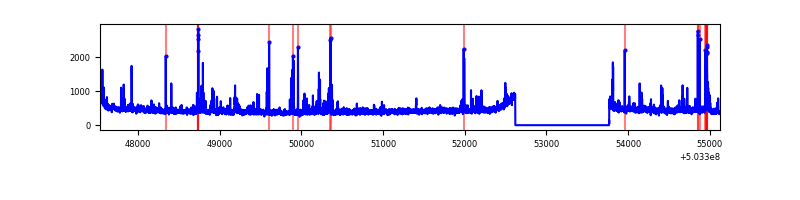 |
| C | 7592 | 6443 | 949 | 949 | 12.50% | 14.73% | 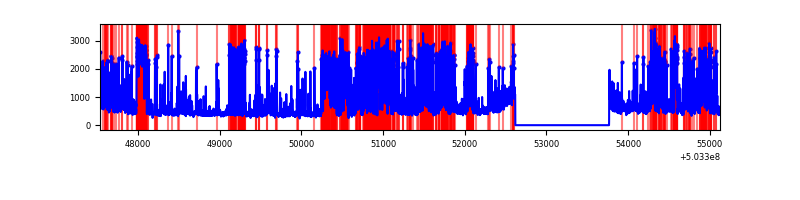 |
| D | 7592 | 6443 | 225 | 225 | 2.96% | 3.49% | 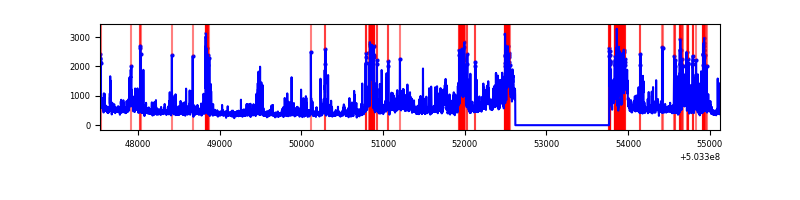 |
Top three noisy pixels from each quadrant. If the there are fewer than three noisy pixels in the level2.evt file, extra rows are filled as -1
| Pixel properties | Quadrant properties | ||||||
|---|---|---|---|---|---|---|---|
| Quadrant | DetID | PixID | Counts | Sigma | Mean | Median | Sigma |
| A | 12 | 3 | 908290 | 5467.04 | 671 | 656 | 166.0 |
| A | 4 | 205 | 161966 | 971.63 | 671 | 656 | 166.0 |
| A | 12 | 194 | 114405 | 685.16 | 671 | 656 | 166.0 |
| B | 5 | 185 | 151241 | 1049.51 | 676 | 651 | 143.5 |
| B | 2 | 249 | 42116 | 288.98 | 676 | 651 | 143.5 |
| B | 10 | 247 | 25902 | 175.98 | 676 | 651 | 143.5 |
| C | 12 | 254 | 1314322 | 7574.55 | 627 | 623 | 173.4 |
| C | 6 | 13 | 1107397 | 6381.45 | 627 | 623 | 173.4 |
| C | 1 | 16 | 435217 | 2505.79 | 627 | 623 | 173.4 |
| D | 11 | 129 | 528046 | 2850.9 | 655 | 625 | 185.0 |
| D | 2 | 249 | 385857 | 2082.32 | 655 | 625 | 185.0 |
| D | 5 | 38 | 290070 | 1564.55 | 655 | 625 | 185.0 |
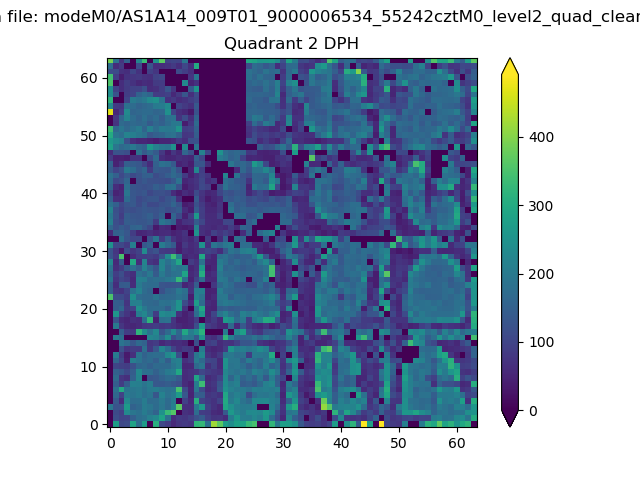
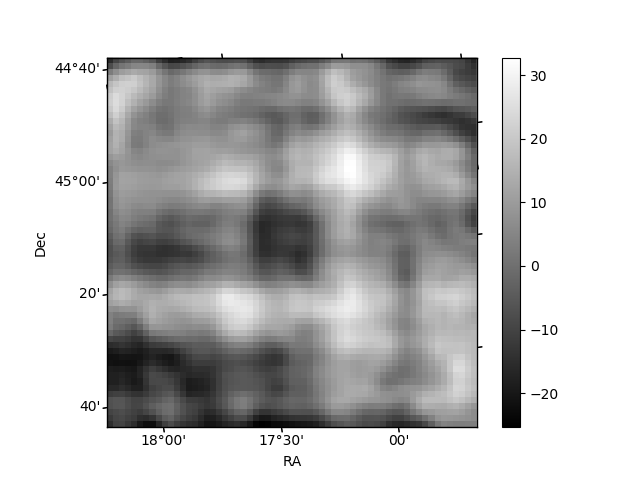
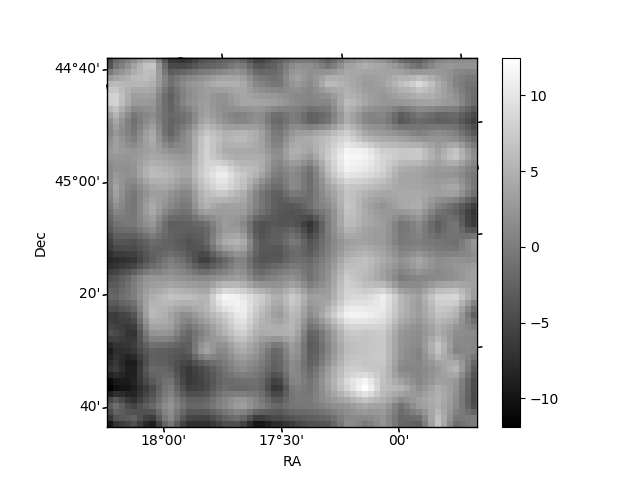
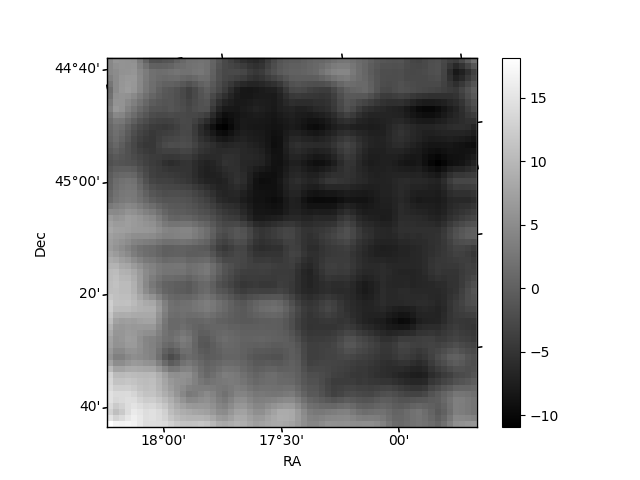
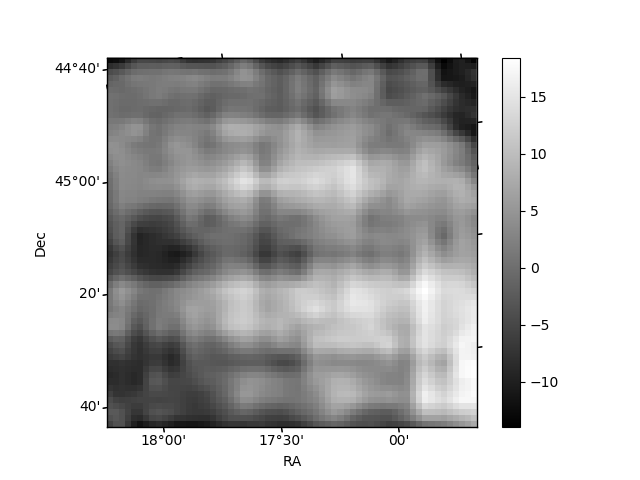
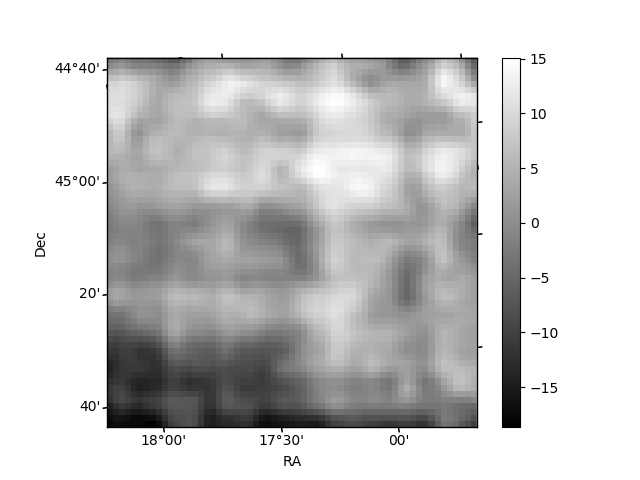
Histogram calculated using DETX and DETY for each event in the final _common_clean file
| Quadrant A | 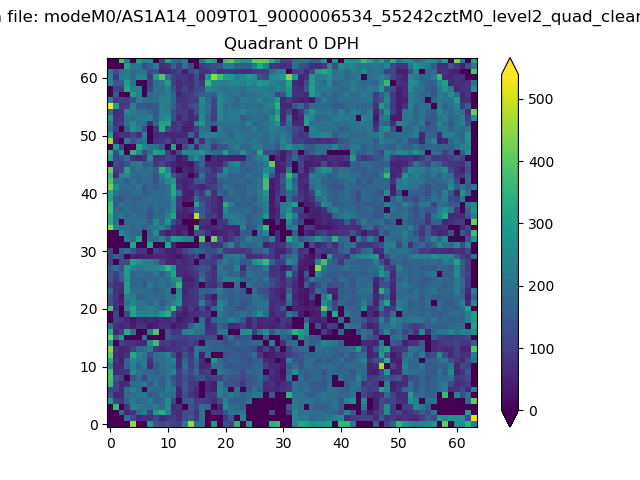 |
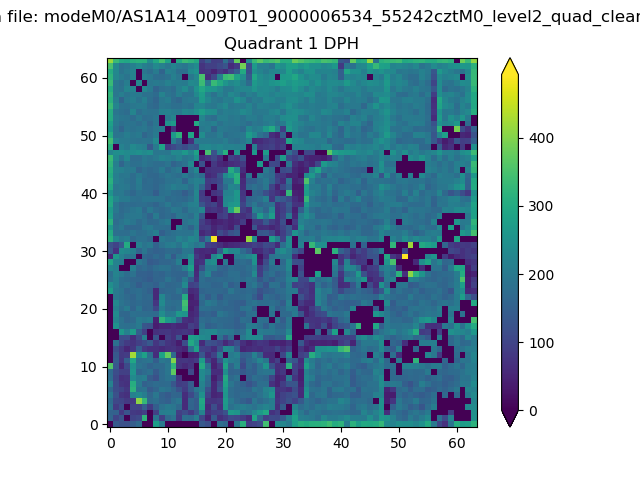 |
Quadrant B |
|---|---|---|---|
| Quadrant D | 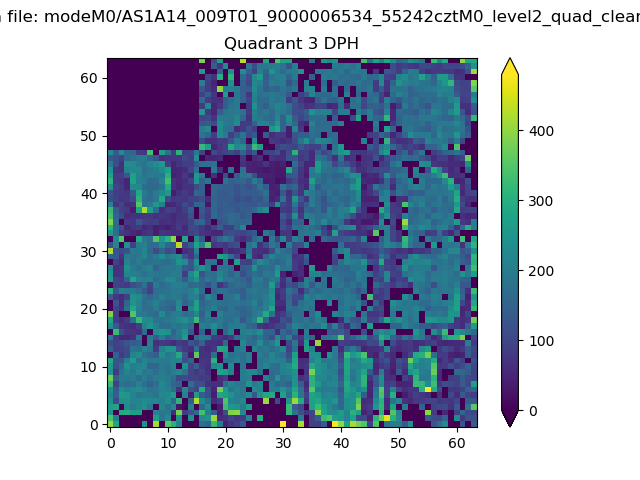 |
 |
Quadrant C |
| Plot type | Count rate plots | Images |
|---|---|---|
| Comparison with Poisson distribution Blue bars denote a histogram of data divided into 1 sec bins. Red curve is a Poisson curve with rate = median count rate of data. |
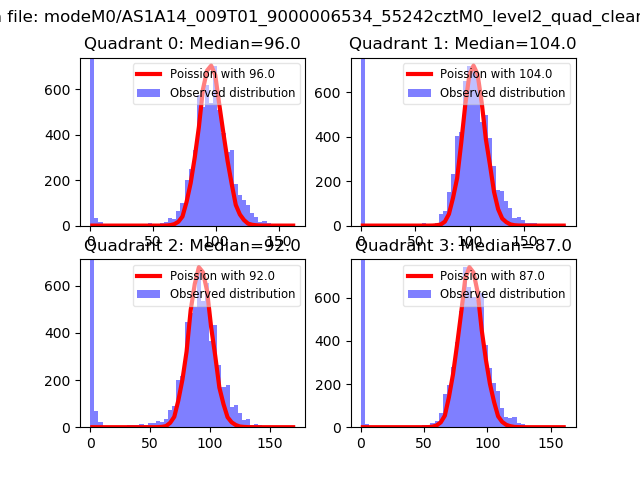 |
 |
| Quadrant-wise count rates Data is divided into 100 sec bins |
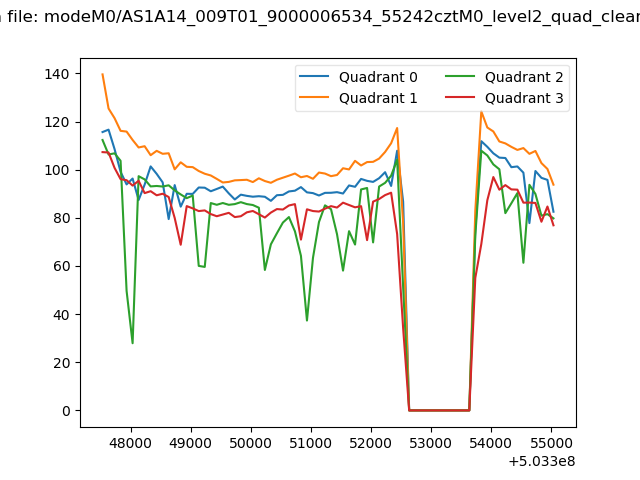 |
|
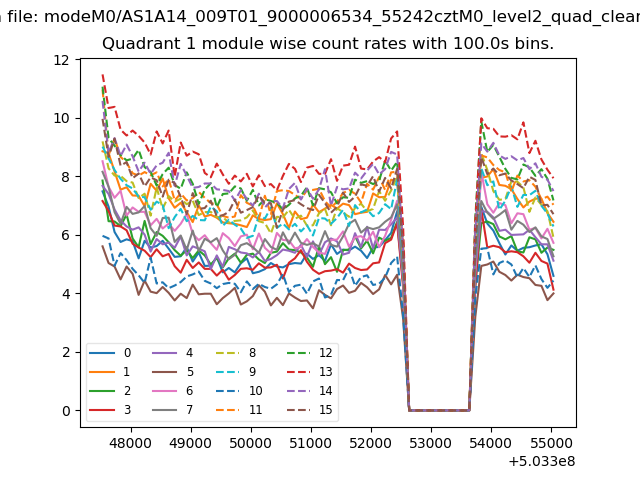
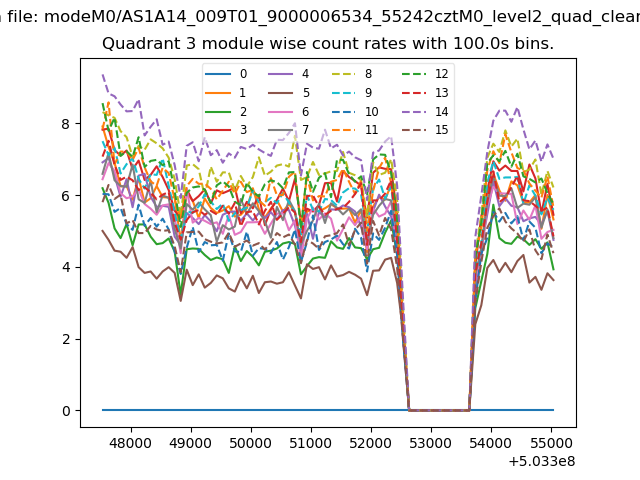
| Module-wise count rates for Quadrant A Data is divided into 100 sec bins |
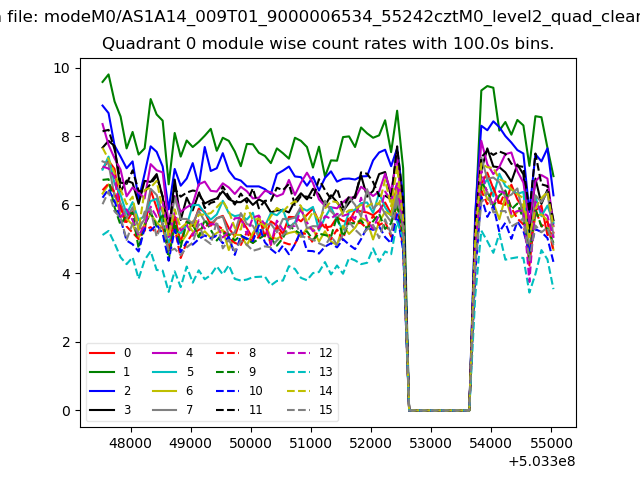 |
 |
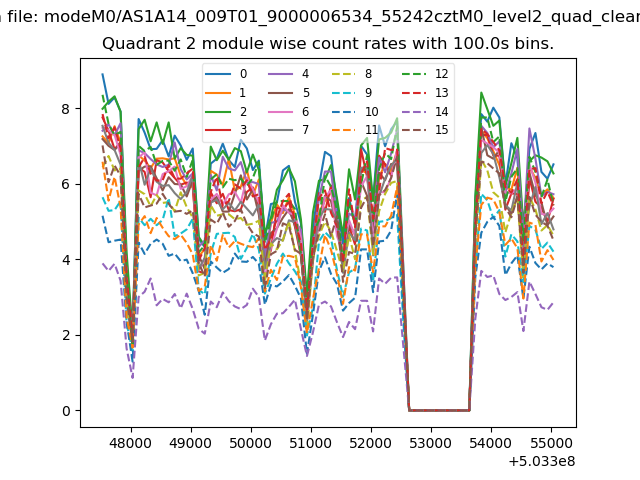
| Module-wise count rates for Quadrant B Data is divided into 100 sec bins |
 |
 |
| Module-wise count rates for Quadrant C Data is divided into 100 sec bins |
 |
 |
| Module-wise count rates for Quadrant D Data is divided into 100 sec bins |
 |
 |
| Parameter | Plot |
|---|---|
| CZT HV Monitor | 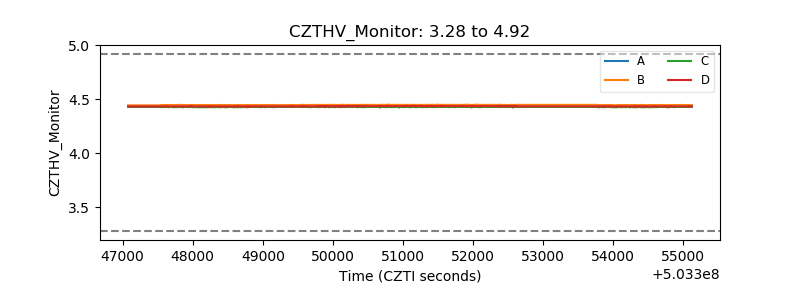 |
| D_VDD | 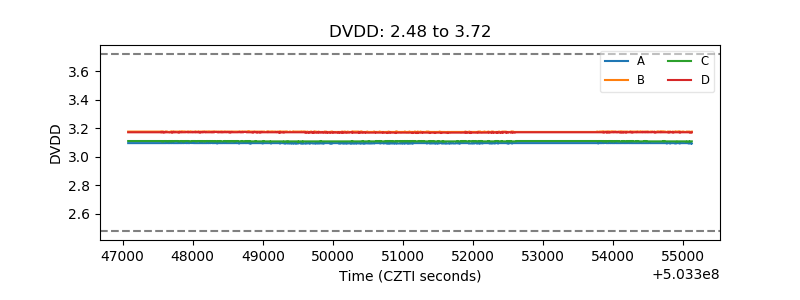 |
| Temperature 1 | 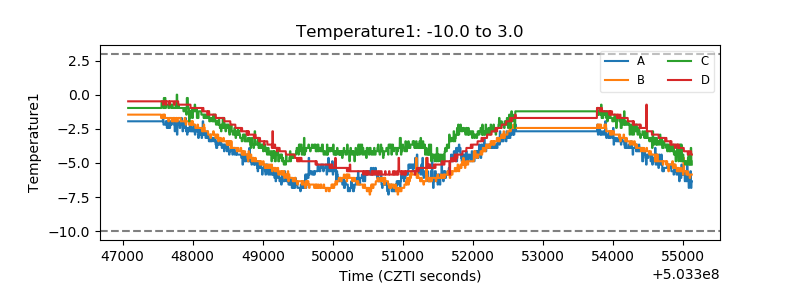 |
| Veto HV Monitor | 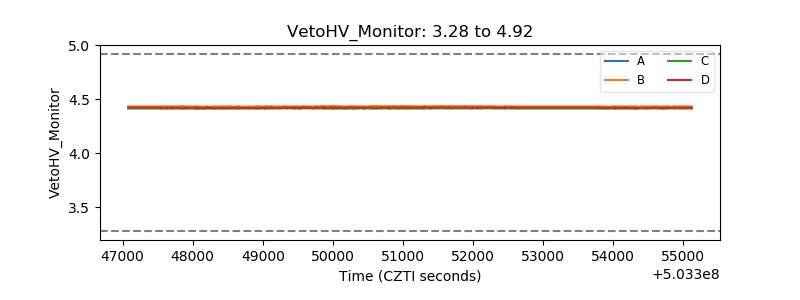 |
| Veto LLD | 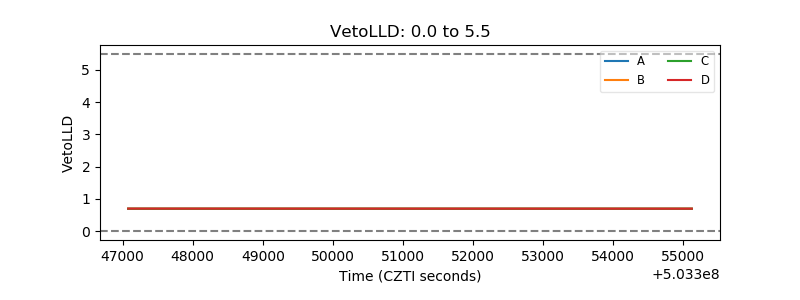 |
| Alpha Counter | 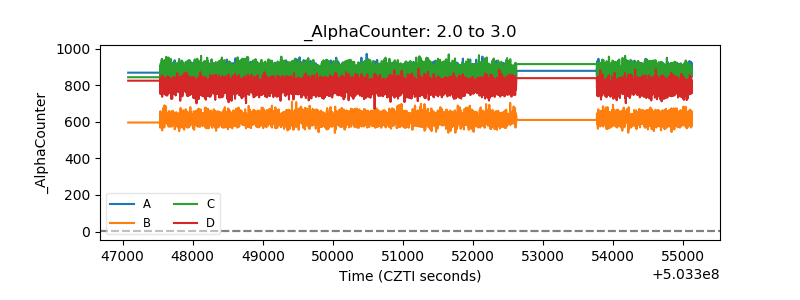 |
| _CPM_Rate |  |
| CZT Counter | 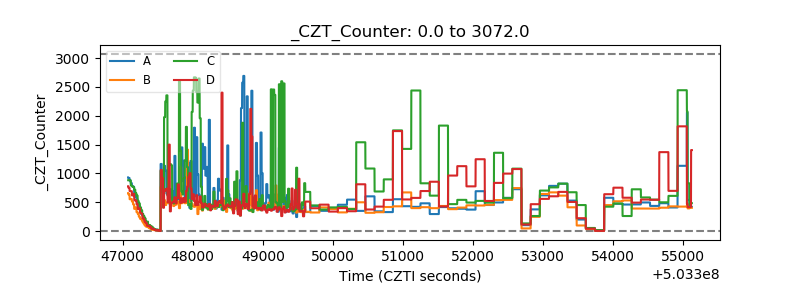 |
| +2.5 Volts monitor | 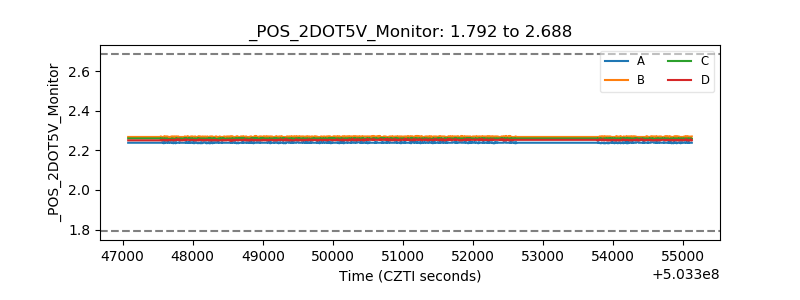 |
| +5 Volts monitor | 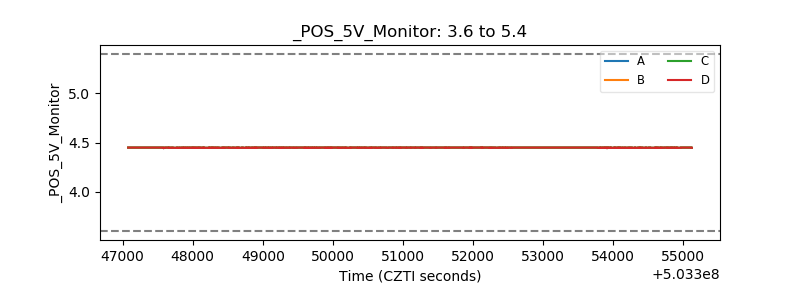 |
| _ROLL_ROT | 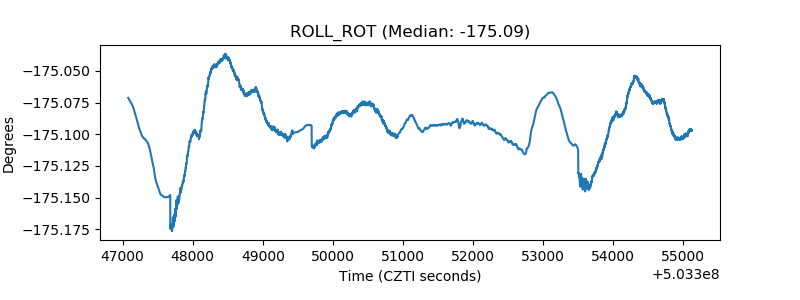 |
| _Roll_DEC | 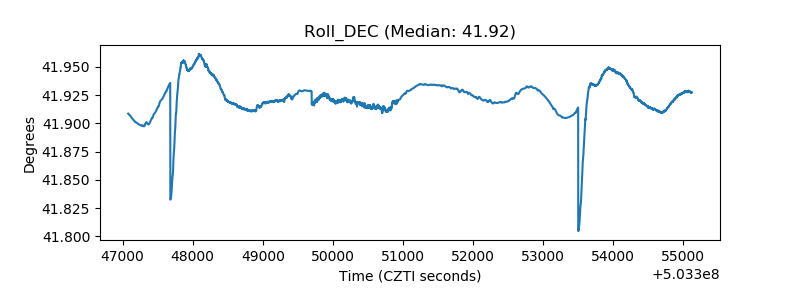 |
| _Roll_RA | 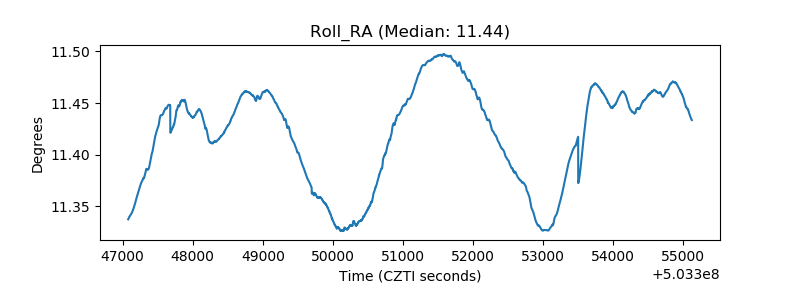 |
| Veto Counter | 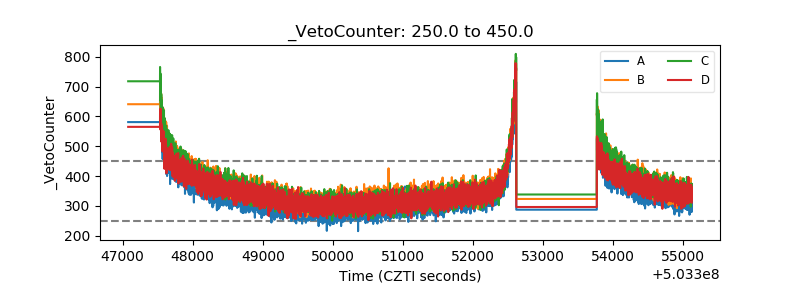 |