| Param | Original file | Final file |
|---|---|---|
| Filename | modeM0/AS1A14_009T01_9000006534_55243cztM0_level2.fits | modeM0/AS1A14_009T01_9000006534_55243cztM0_level2_quad_clean.evt |
| Size (bytes) | 502,297,920 | 93,853,440 |
| Size | 479.0 MB | 89.5 MB |
| Events in quadrant A | 4,234,329 | 597,506 |
| Events in quadrant B | 3,637,738 | 667,719 |
| Events in quadrant C | 5,018,411 | 581,992 |
| Events in quadrant D | 5,198,156 | 540,573 |
| Mode SS | |||
|---|---|---|---|
| Quadrant | BADHDUFLAG | Total packets | Discarded packets |
| A | 0 | 134 | 0 |
| B | 0 | 134 | 0 |
| C | 0 | 134 | 0 |
| D | 0 | 134 | 0 |
| Mode M0 | |||
|---|---|---|---|
| Quadrant | BADHDUFLAG | Total packets | Discarded packets |
| A | 0 | 17279 | 2 |
| B | 0 | 15607 | 2 |
| C | 0 | 19424 | 2 |
| D | 0 | 20041 | 2 |
| Mode M9 | |||
|---|---|---|---|
| Quadrant | BADHDUFLAG | Total packets | Discarded packets |
| A | 0 | 13 | 0 |
| B | 0 | 14 | 0 |
| C | 0 | 14 | 0 |
| D | 0 | 14 | 0 |
| Quadrant | Total seconds | Saturated seconds | Saturation percentage |
|---|---|---|---|
| A | 6503 | 405 | 6.227895% |
| B | 6503 | 169 | 2.598801% |
| C | 6503 | 425 | 6.535445% |
| D | 6503 | 403 | 6.197140% |
Noise dominated data is calculated using 1-second bins in cleaned event files. If a bin has >2000 counts, and if more than 50% of those come from <1% of pixels, then it is considered to be noise-dominated and hence unusable.
| Quadrant | # 1 sec bins | Bins with >0 counts | Bins with >2000 counts | High rate bins dominated by noise | Noise dominated (total time) | Noise dominated (detector-on time) | Marked lightcurve |
|---|---|---|---|---|---|---|---|
| A | 7638 | 6504 | 304 | 304 | 3.98% | 4.67% | 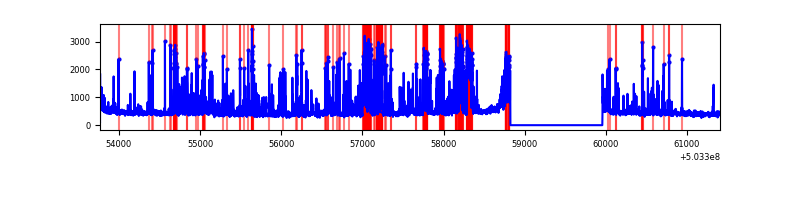 |
| B | 7638 | 6504 | 148 | 148 | 1.94% | 2.28% | 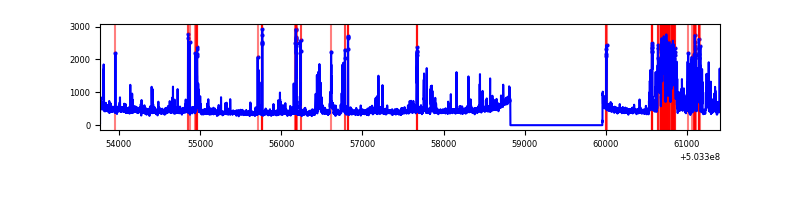 |
| C | 7638 | 6504 | 418 | 418 | 5.47% | 6.43% | 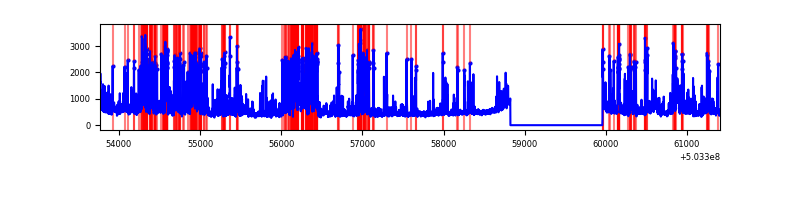 |
| D | 7638 | 6504 | 466 | 466 | 6.10% | 7.16% | 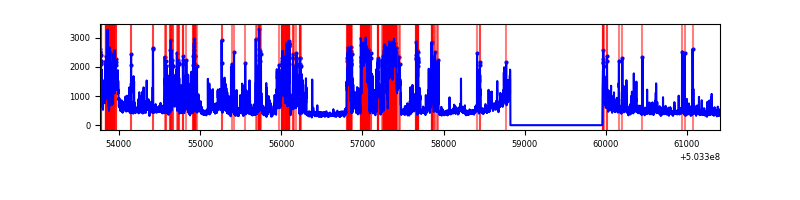 |
Top three noisy pixels from each quadrant. If the there are fewer than three noisy pixels in the level2.evt file, extra rows are filled as -1
| Pixel properties | Quadrant properties | ||||||
|---|---|---|---|---|---|---|---|
| Quadrant | DetID | PixID | Counts | Sigma | Mean | Median | Sigma |
| A | 12 | 3 | 1207783 | 7473.64 | 659 | 642 | 161.5 |
| A | 0 | 8 | 153569 | 946.8 | 659 | 642 | 161.5 |
| A | 12 | 194 | 148862 | 917.66 | 659 | 642 | 161.5 |
| B | 2 | 249 | 451333 | 3158.04 | 674 | 650 | 142.7 |
| B | 5 | 185 | 251813 | 1759.96 | 674 | 650 | 142.7 |
| B | 10 | 245 | 192960 | 1347.56 | 674 | 650 | 142.7 |
| C | 12 | 254 | 1158438 | 6439.67 | 657 | 655 | 179.8 |
| C | 13 | 3 | 458339 | 2545.67 | 657 | 655 | 179.8 |
| C | 12 | 249 | 178913 | 991.48 | 657 | 655 | 179.8 |
| D | 11 | 129 | 945694 | 5128.79 | 651 | 622 | 184.3 |
| D | 8 | 160 | 893087 | 4843.3 | 651 | 622 | 184.3 |
| D | 5 | 38 | 494497 | 2680.2 | 651 | 622 | 184.3 |
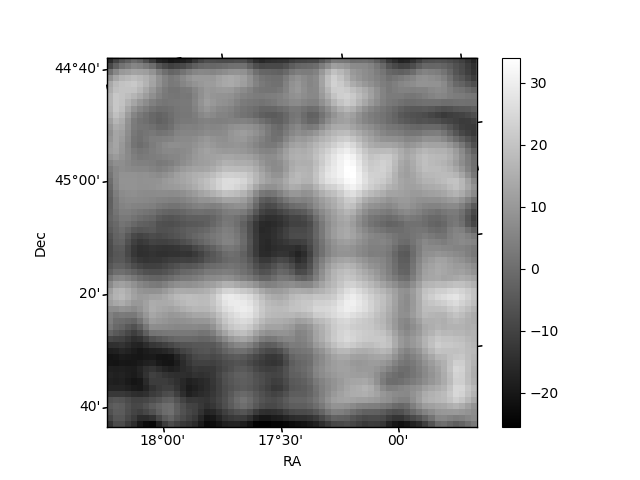
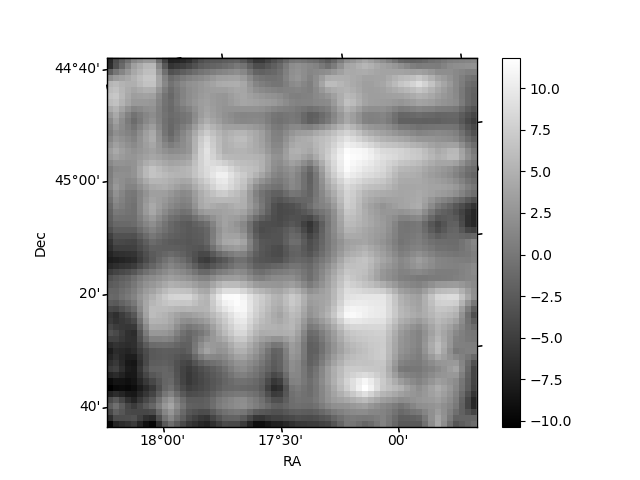
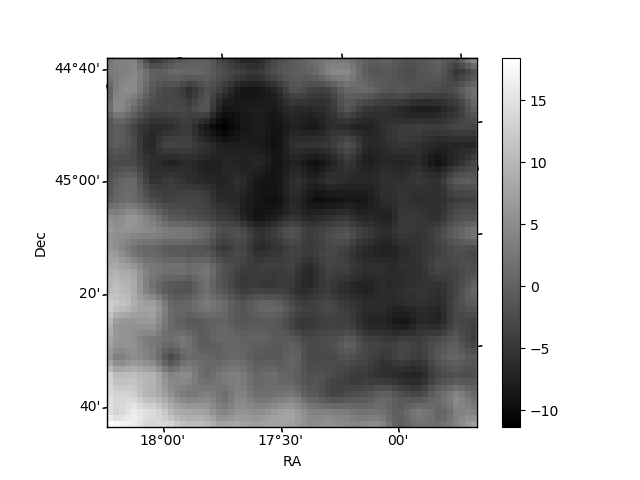
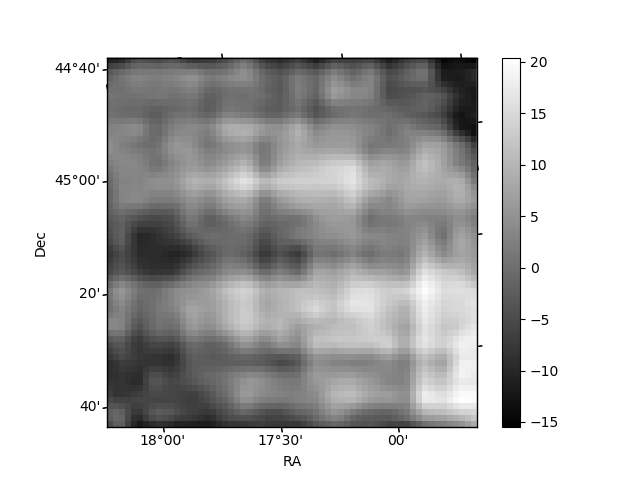
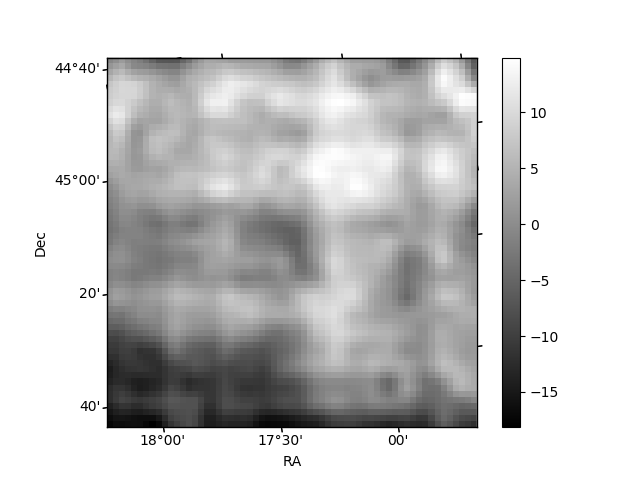
Histogram calculated using DETX and DETY for each event in the final _common_clean file
| Quadrant A | 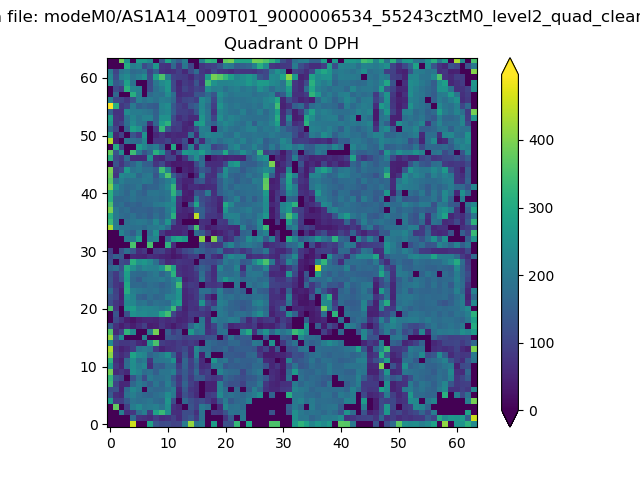 |
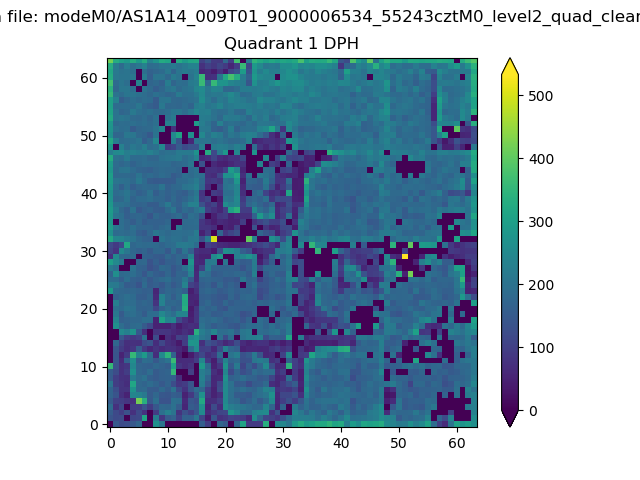 |
Quadrant B |
|---|---|---|---|
| Quadrant D | 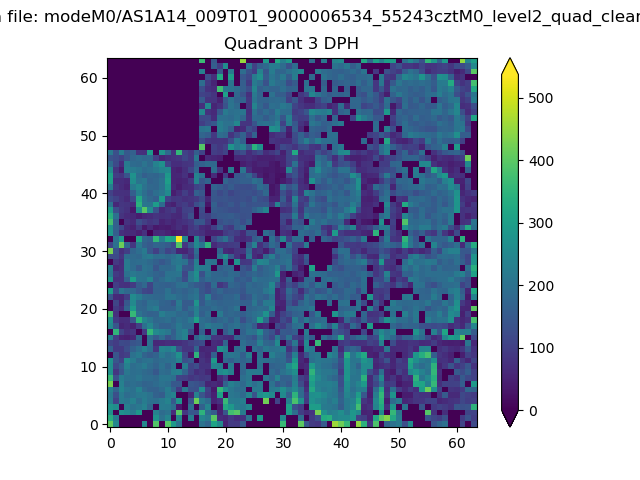 |
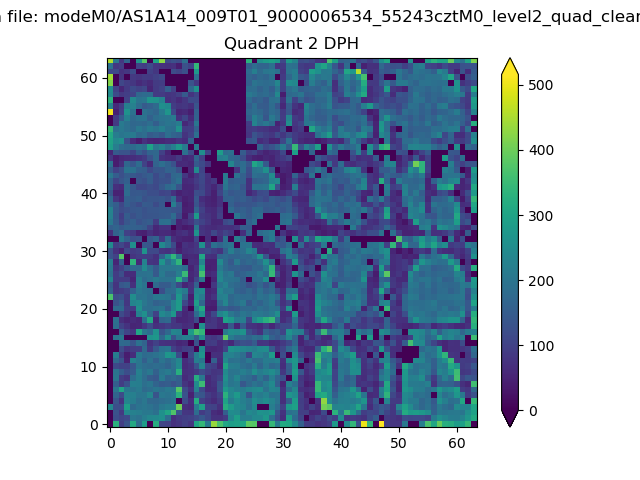 |
Quadrant C |
| Plot type | Count rate plots | Images |
|---|---|---|
| Comparison with Poisson distribution Blue bars denote a histogram of data divided into 1 sec bins. Red curve is a Poisson curve with rate = median count rate of data. |
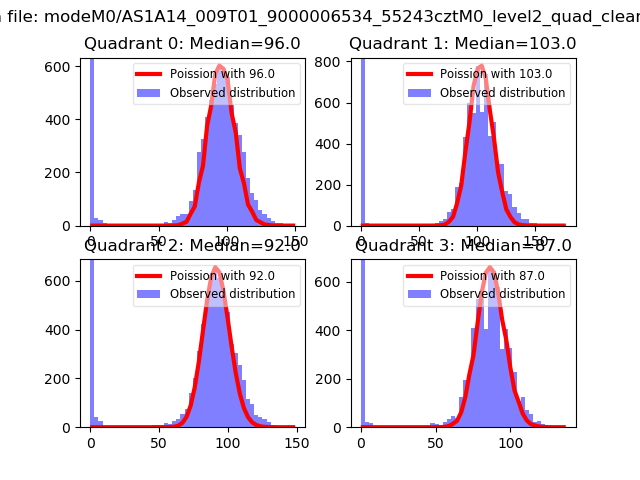 |
 |
| Quadrant-wise count rates Data is divided into 100 sec bins |
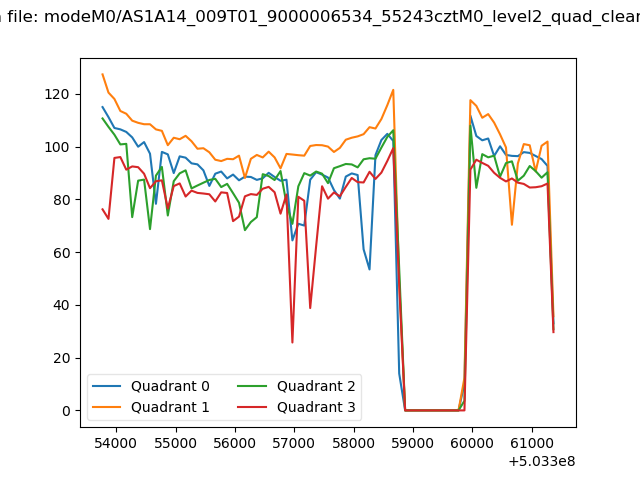 |
|
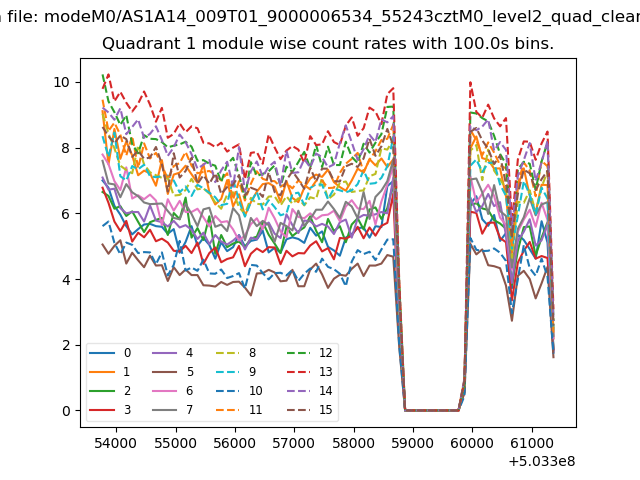
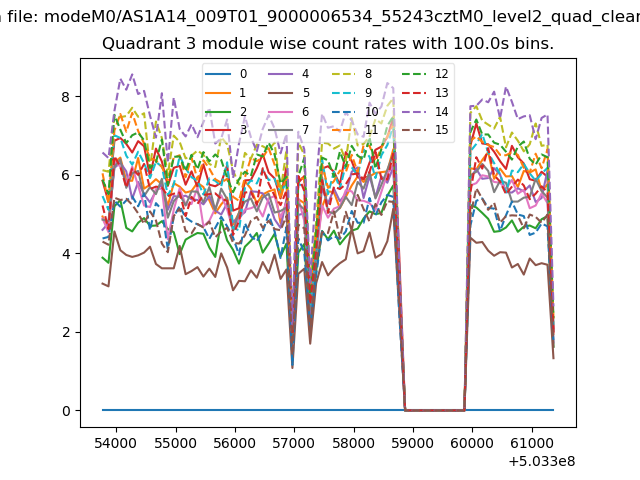
| Module-wise count rates for Quadrant A Data is divided into 100 sec bins |
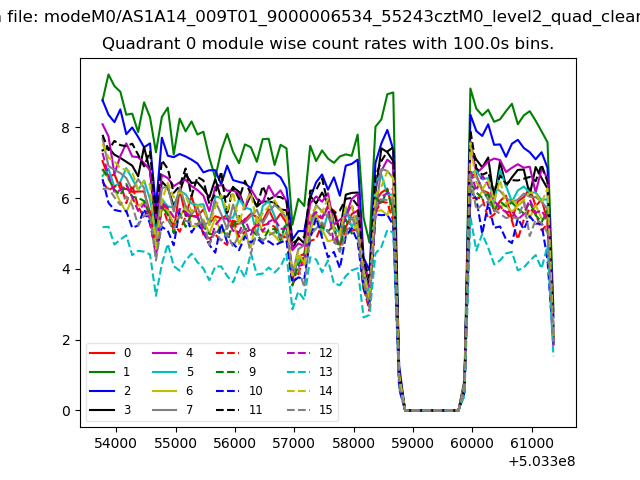 |
 |
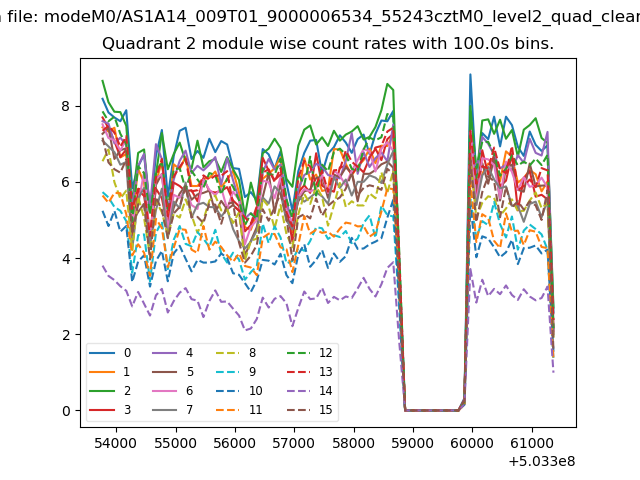
| Module-wise count rates for Quadrant B Data is divided into 100 sec bins |
 |
 |
| Module-wise count rates for Quadrant C Data is divided into 100 sec bins |
 |
 |
| Module-wise count rates for Quadrant D Data is divided into 100 sec bins |
 |
 |
| Parameter | Plot |
|---|---|
| CZT HV Monitor | 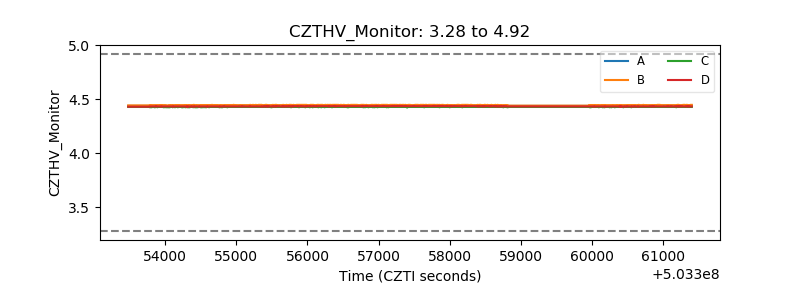 |
| D_VDD | 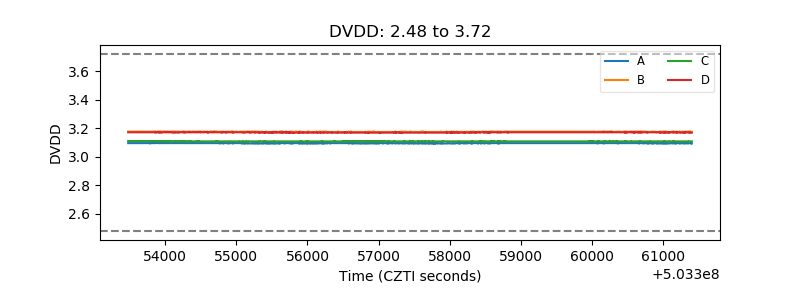 |
| Temperature 1 | 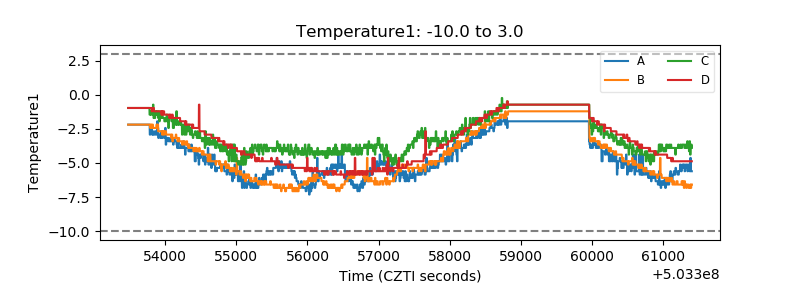 |
| Veto HV Monitor |  |
| Veto LLD | 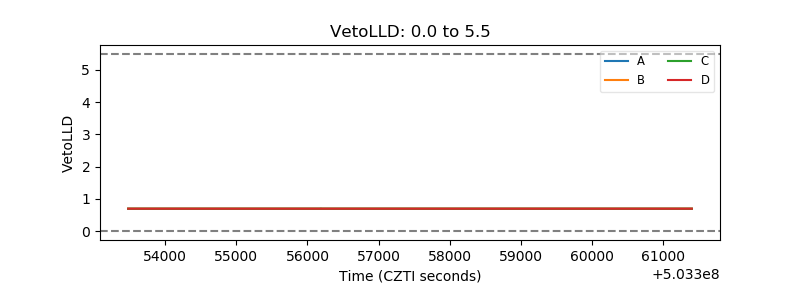 |
| Alpha Counter | 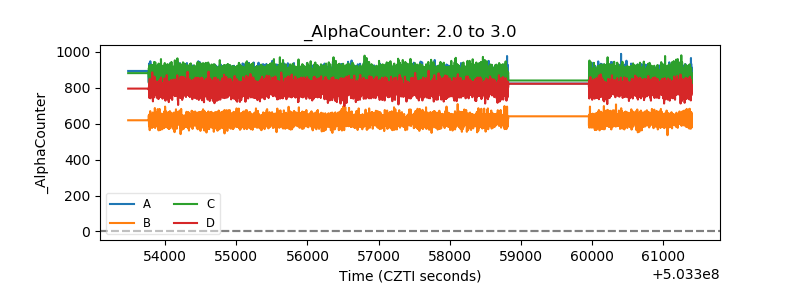 |
| _CPM_Rate | 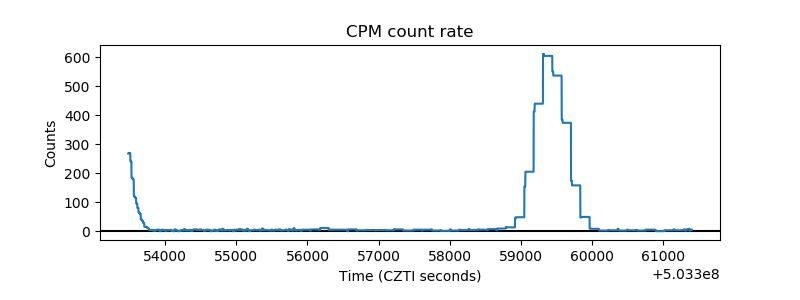 |
| CZT Counter | 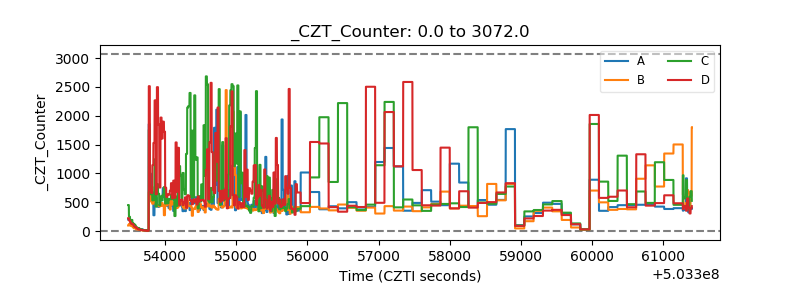 |
| +2.5 Volts monitor |  |
| +5 Volts monitor |  |
| _ROLL_ROT | 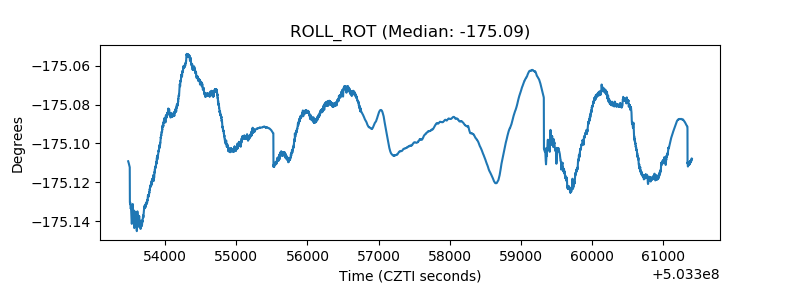 |
| _Roll_DEC | 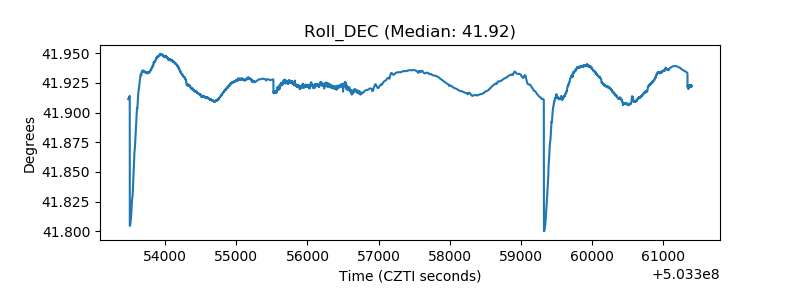 |
| _Roll_RA | 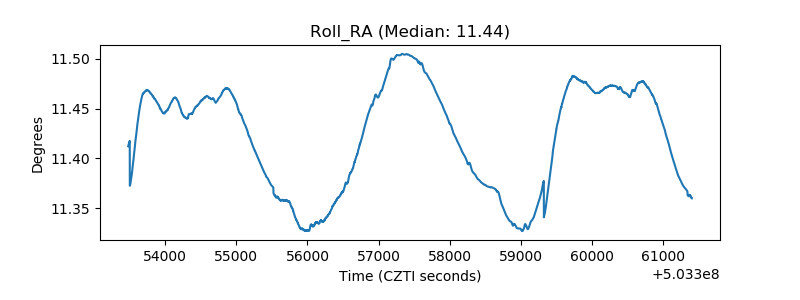 |
| Veto Counter | 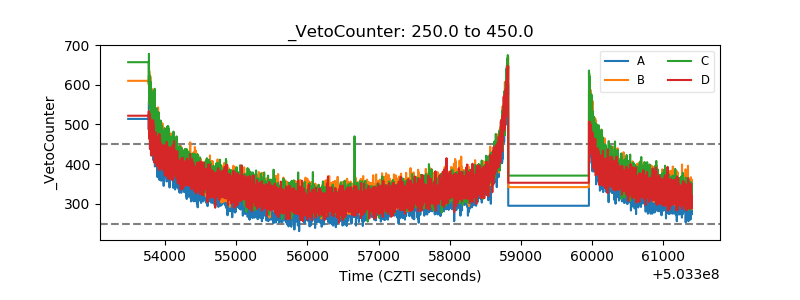 |