| Param | Original file | Final file |
|---|---|---|
| Filename | modeM0/AS1A14_009T01_9000006534_55244cztM0_level2.fits | modeM0/AS1A14_009T01_9000006534_55244cztM0_level2_quad_clean.evt |
| Size (bytes) | 537,802,560 | 93,651,840 |
| Size | 512.9 MB | 89.3 MB |
| Events in quadrant A | 4,181,514 | 602,369 |
| Events in quadrant B | 5,365,126 | 625,021 |
| Events in quadrant C | 5,182,465 | 583,822 |
| Events in quadrant D | 4,660,874 | 559,270 |
| Mode SS | |||
|---|---|---|---|
| Quadrant | BADHDUFLAG | Total packets | Discarded packets |
| A | 0 | 138 | 0 |
| B | 0 | 138 | 0 |
| C | 0 | 138 | 0 |
| D | 0 | 138 | 0 |
| Mode M0 | |||
|---|---|---|---|
| Quadrant | BADHDUFLAG | Total packets | Discarded packets |
| A | 0 | 17482 | 2 |
| B | 0 | 20715 | 2 |
| C | 0 | 20077 | 2 |
| D | 0 | 18566 | 2 |
| Mode M9 | |||
|---|---|---|---|
| Quadrant | BADHDUFLAG | Total packets | Discarded packets |
| A | 0 | 22 | 0 |
| B | 0 | 22 | 0 |
| C | 0 | 22 | 0 |
| D | 0 | 22 | 0 |
| Quadrant | Total seconds | Saturated seconds | Saturation percentage |
|---|---|---|---|
| A | 6671 | 382 | 5.726278% |
| B | 6671 | 723 | 10.837955% |
| C | 6672 | 398 | 5.965228% |
| D | 6672 | 277 | 4.151679% |
Noise dominated data is calculated using 1-second bins in cleaned event files. If a bin has >2000 counts, and if more than 50% of those come from <1% of pixels, then it is considered to be noise-dominated and hence unusable.
| Quadrant | # 1 sec bins | Bins with >0 counts | Bins with >2000 counts | High rate bins dominated by noise | Noise dominated (total time) | Noise dominated (detector-on time) | Marked lightcurve |
|---|---|---|---|---|---|---|---|
| A | 8906 | 6673 | 318 | 318 | 3.57% | 4.77% | 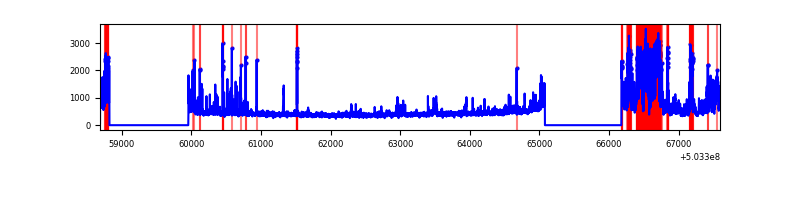 |
| B | 8906 | 6673 | 643 | 643 | 7.22% | 9.64% | 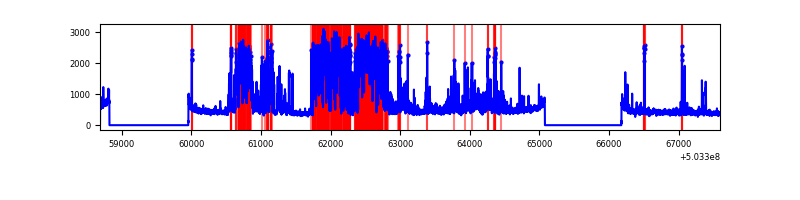 |
| C | 8907 | 6674 | 344 | 344 | 3.86% | 5.15% | 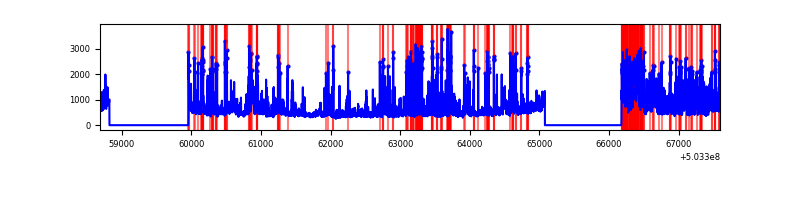 |
| D | 8907 | 6674 | 262 | 262 | 2.94% | 3.93% | 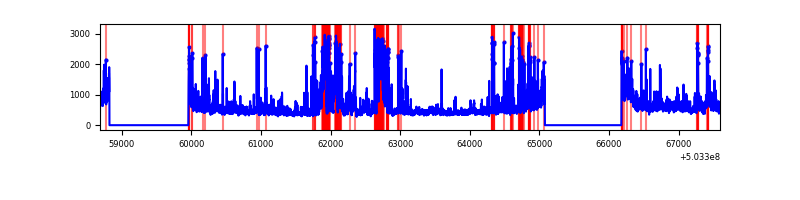 |
Top three noisy pixels from each quadrant. If the there are fewer than three noisy pixels in the level2.evt file, extra rows are filled as -1
| Pixel properties | Quadrant properties | ||||||
|---|---|---|---|---|---|---|---|
| Quadrant | DetID | PixID | Counts | Sigma | Mean | Median | Sigma |
| A | 12 | 115 | 1125471 | 6742.01 | 681 | 664 | 166.8 |
| A | 12 | 3 | 174373 | 1041.2 | 681 | 664 | 166.8 |
| A | 3 | 14 | 40955 | 241.5 | 681 | 664 | 166.8 |
| B | 5 | 185 | 2107678 | 14545.96 | 675 | 649 | 144.9 |
| B | 2 | 249 | 437190 | 3013.67 | 675 | 649 | 144.9 |
| B | 5 | 172 | 38740 | 262.96 | 675 | 649 | 144.9 |
| C | 12 | 254 | 1033306 | 5542.16 | 674 | 666 | 186.3 |
| C | 1 | 16 | 689779 | 3698.46 | 674 | 666 | 186.3 |
| C | 12 | 249 | 278038 | 1488.65 | 674 | 666 | 186.3 |
| D | 8 | 160 | 893687 | 4664.82 | 674 | 644 | 191.4 |
| D | 11 | 129 | 513640 | 2679.64 | 674 | 644 | 191.4 |
| D | 5 | 38 | 279070 | 1454.36 | 674 | 644 | 191.4 |
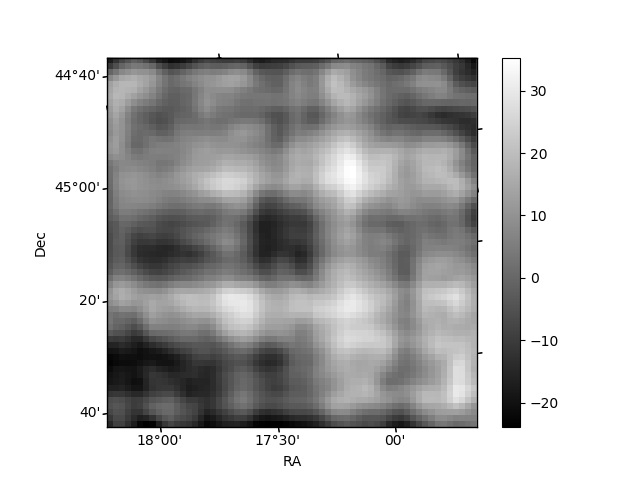
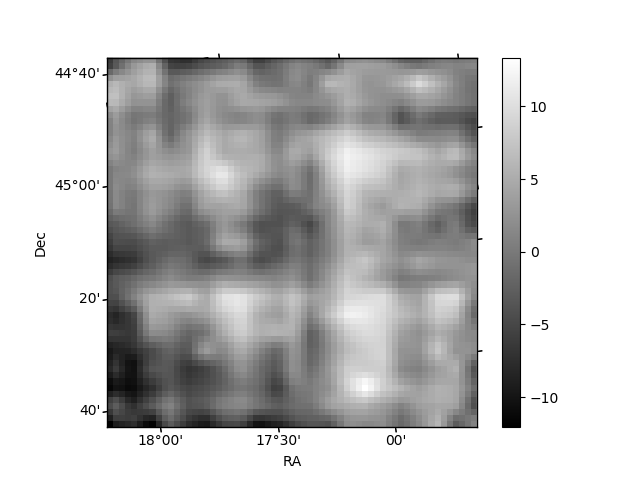
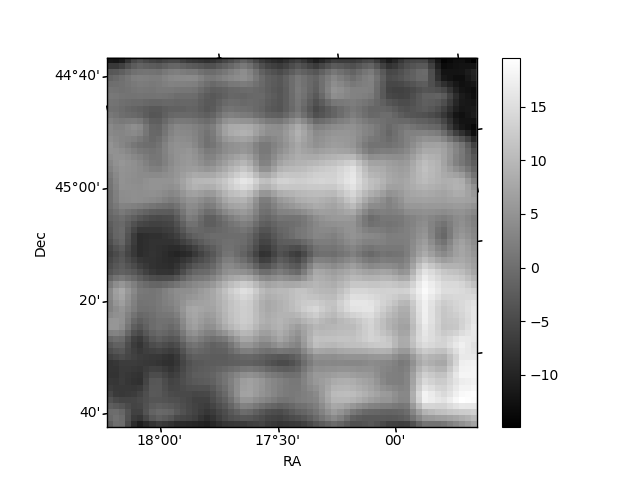
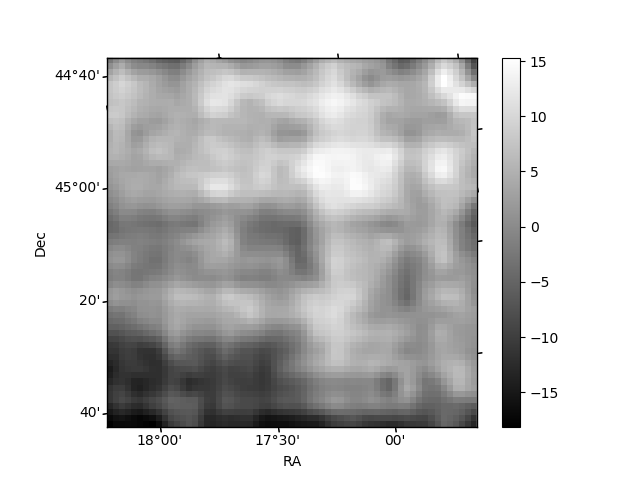
Histogram calculated using DETX and DETY for each event in the final _common_clean file
| Quadrant A | 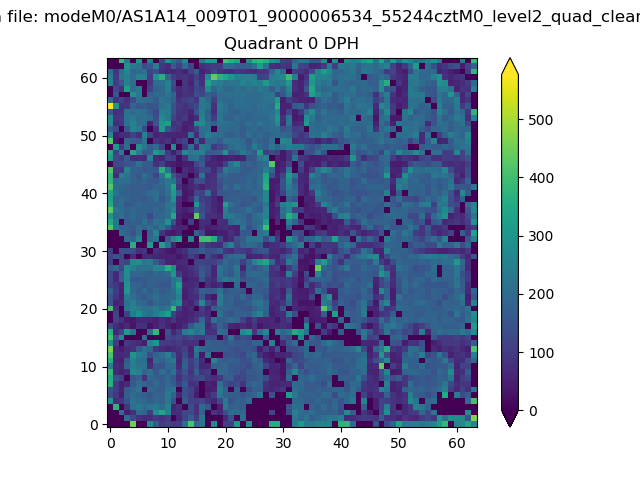 |
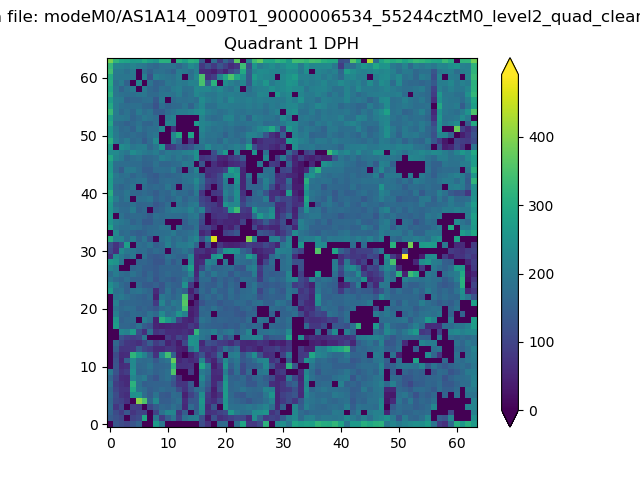 |
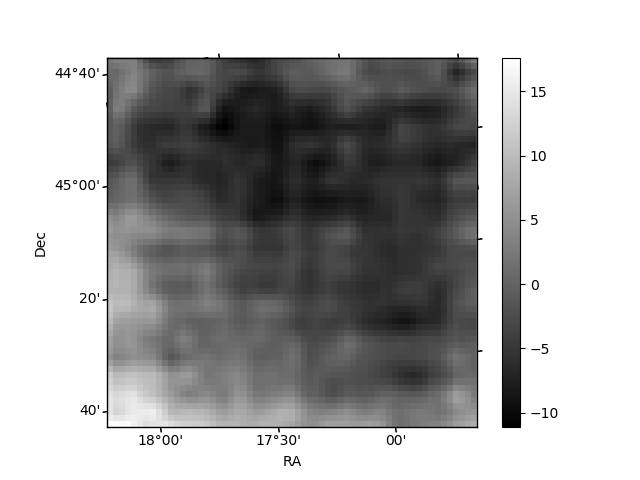
Quadrant B |
|---|---|---|---|
| Quadrant D | 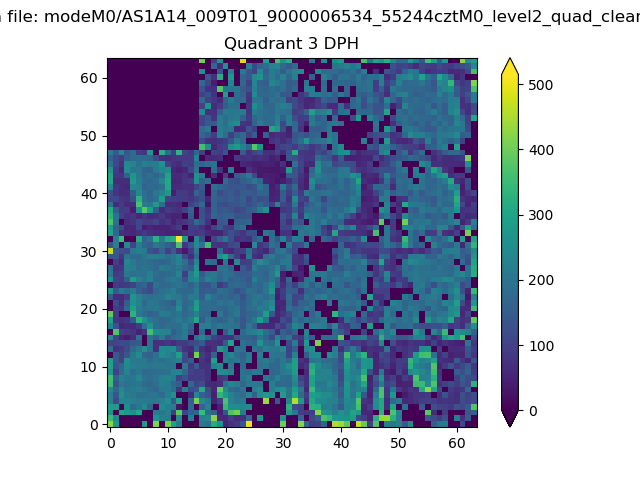 |
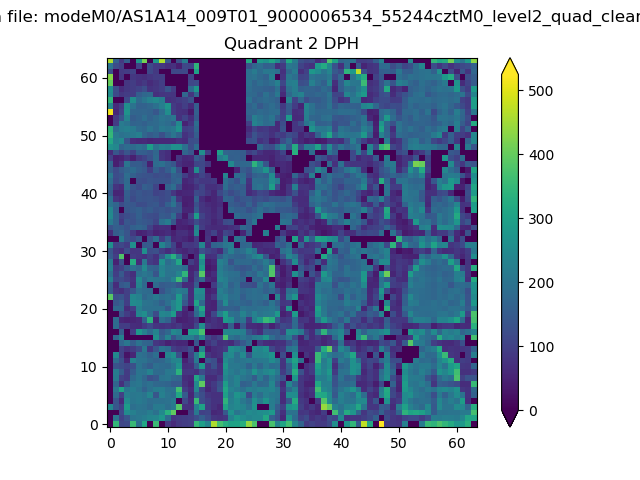 |
Quadrant C |
| Plot type | Count rate plots | Images |
|---|---|---|
| Comparison with Poisson distribution Blue bars denote a histogram of data divided into 1 sec bins. Red curve is a Poisson curve with rate = median count rate of data. |
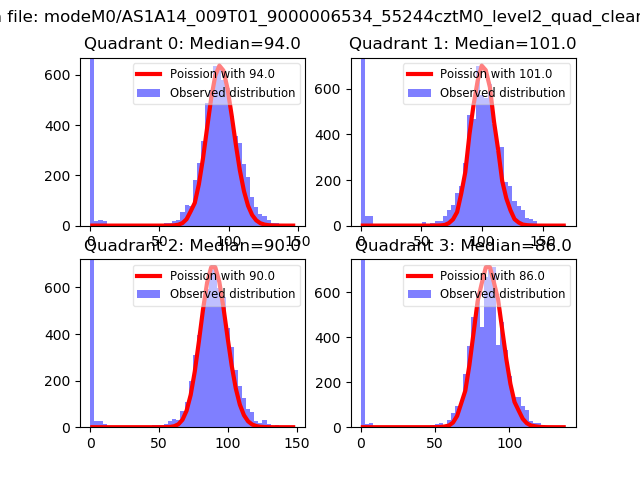 |
 |
| Quadrant-wise count rates Data is divided into 100 sec bins |
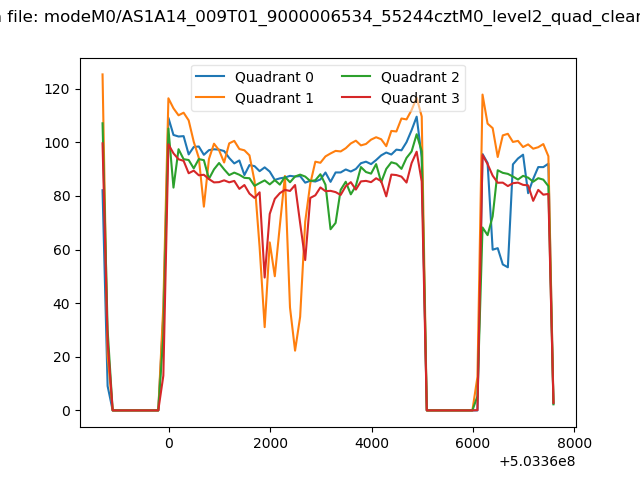 |
|
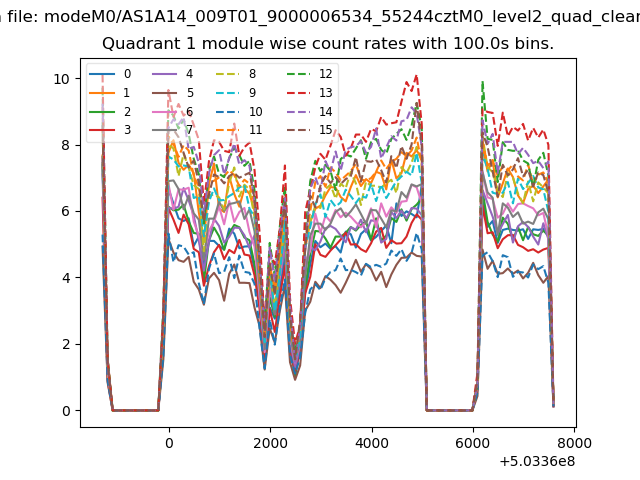
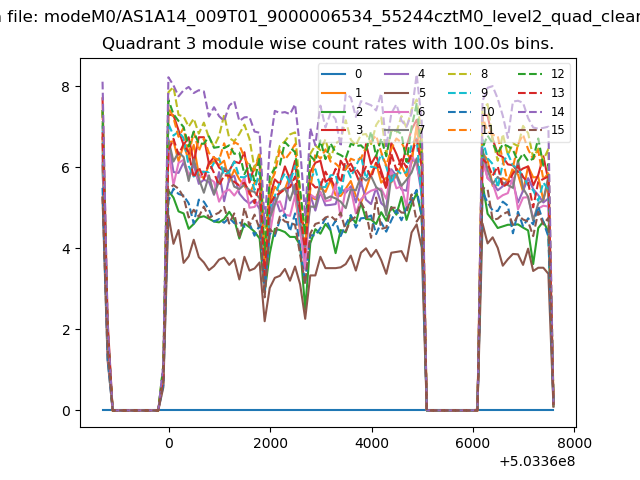
| Module-wise count rates for Quadrant A Data is divided into 100 sec bins |
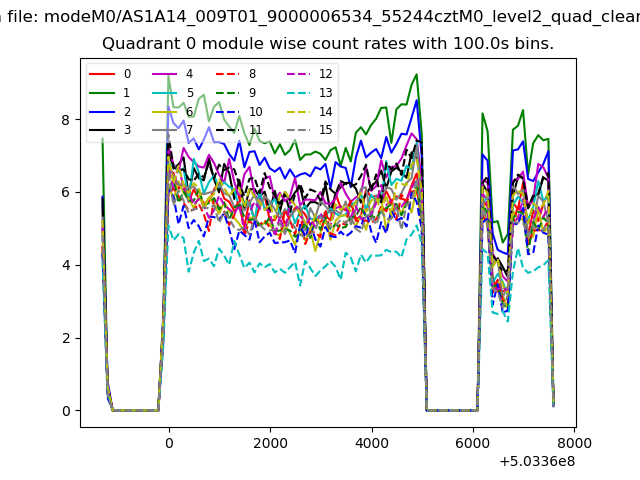 |
 |
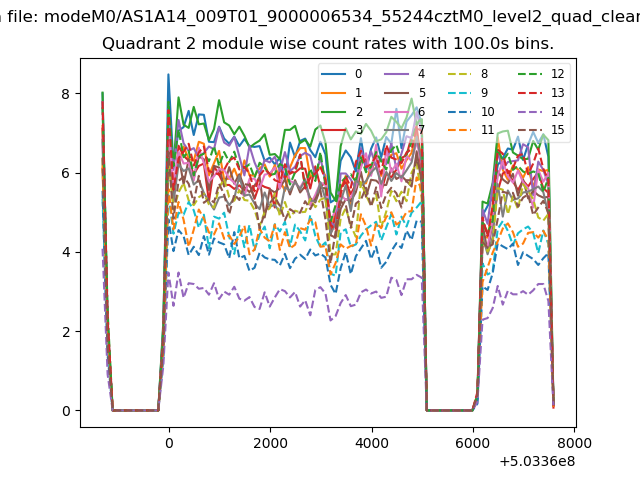
| Module-wise count rates for Quadrant B Data is divided into 100 sec bins |
 |
 |
| Module-wise count rates for Quadrant C Data is divided into 100 sec bins |
 |
 |
| Module-wise count rates for Quadrant D Data is divided into 100 sec bins |
 |
 |
| Parameter | Plot |
|---|---|
| CZT HV Monitor |  |
| D_VDD | 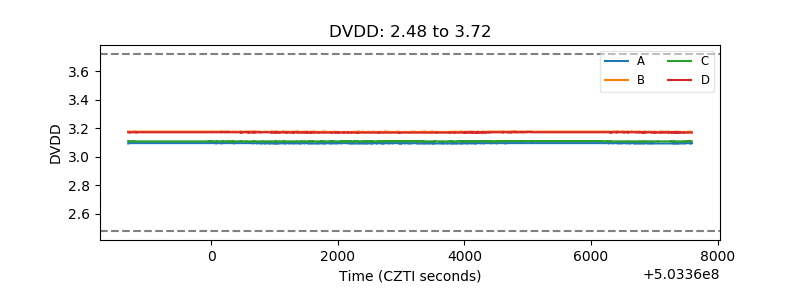 |
| Temperature 1 | 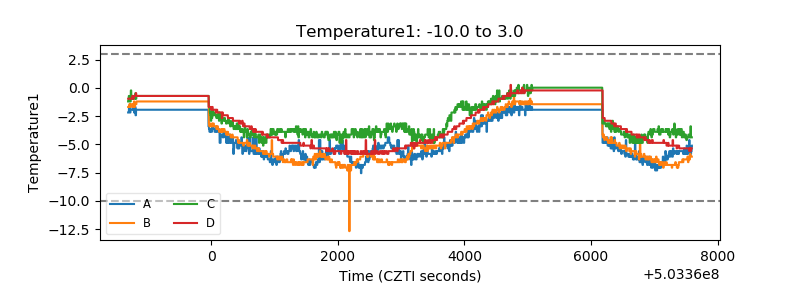 |
| Veto HV Monitor | 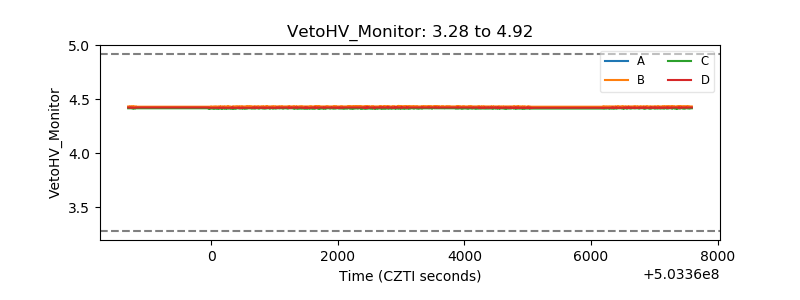 |
| Veto LLD | 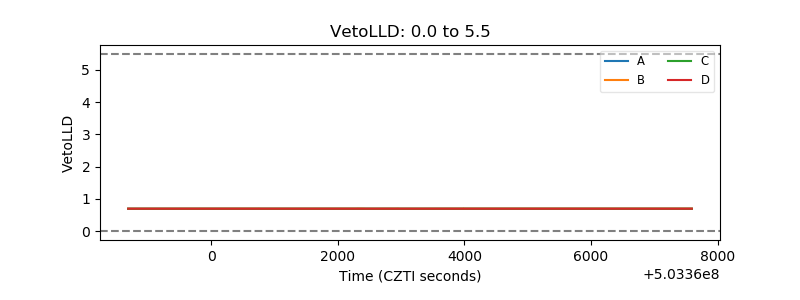 |
| Alpha Counter | 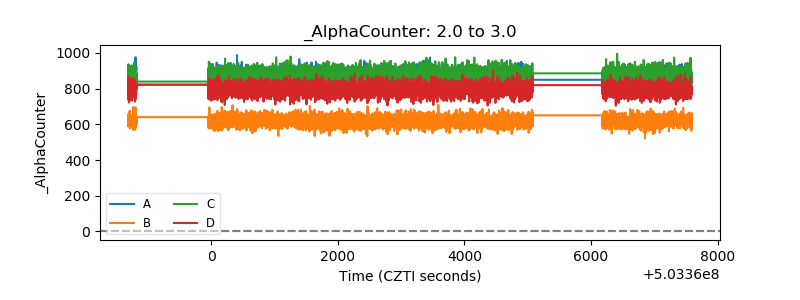 |
| _CPM_Rate | 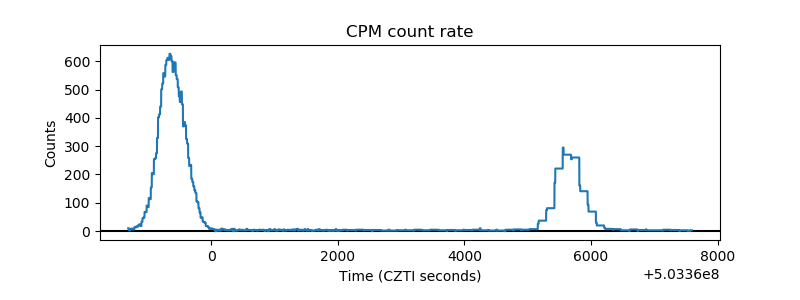 |
| CZT Counter | 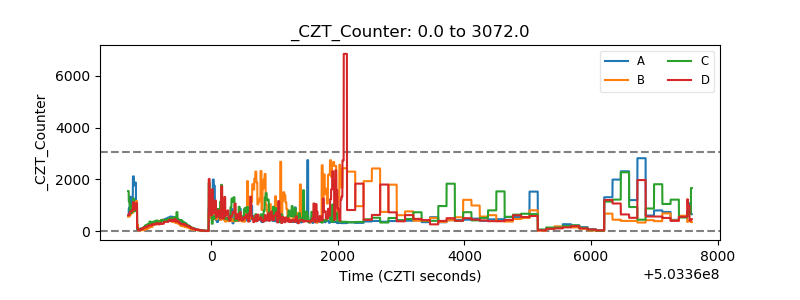 |
| +2.5 Volts monitor |  |
| +5 Volts monitor | 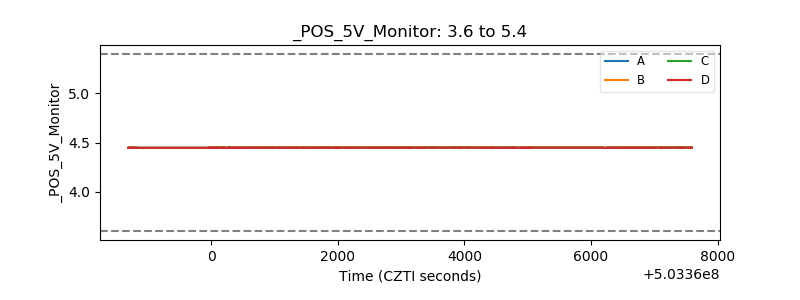 |
| _ROLL_ROT | 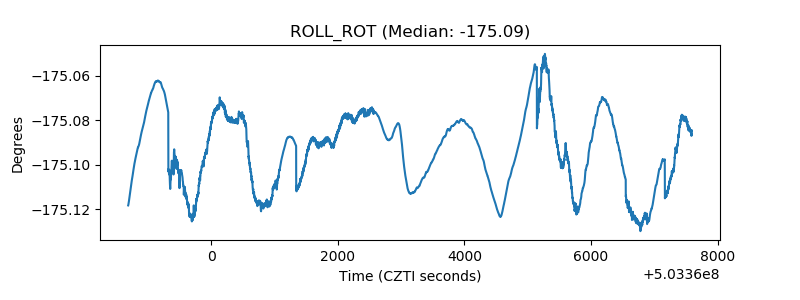 |
| _Roll_DEC | 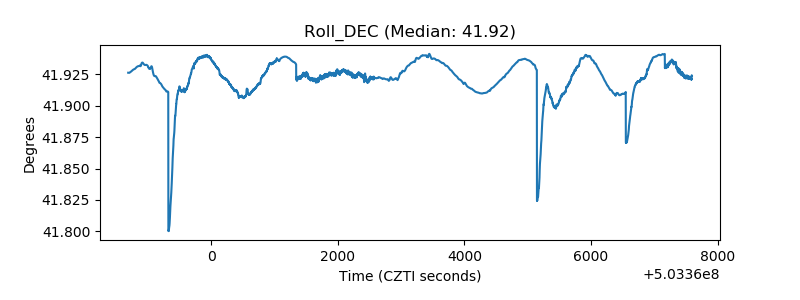 |
| _Roll_RA | 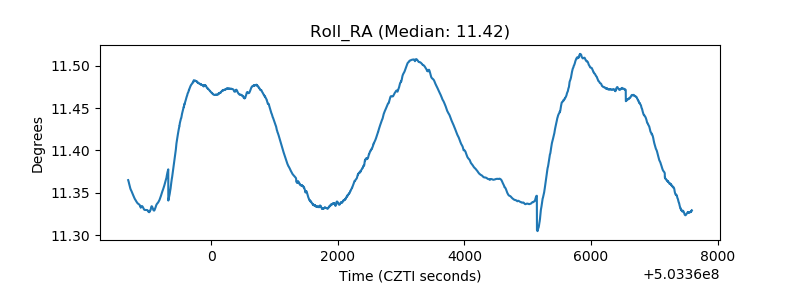 |
| Veto Counter | 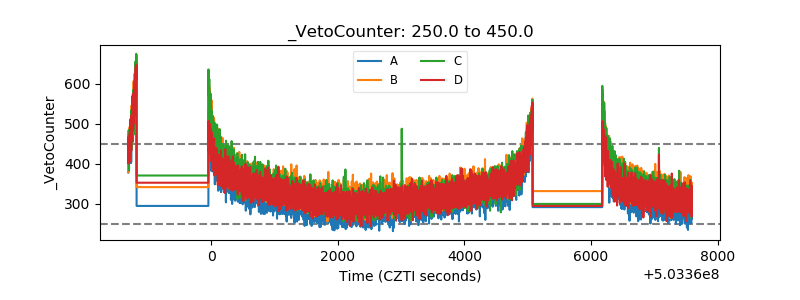 |