| Param | Original file | Final file |
|---|---|---|
| Filename | modeM0/AS1A14_009T01_9000006534_55246cztM0_level2.fits | modeM0/AS1A14_009T01_9000006534_55246cztM0_level2_quad_clean.evt |
| Size (bytes) | 570,427,200 | 108,388,800 |
| Size | 544.0 MB | 103.4 MB |
| Events in quadrant A | 4,040,259 | 705,642 |
| Events in quadrant B | 3,573,666 | 755,062 |
| Events in quadrant C | 7,966,047 | 623,713 |
| Events in quadrant D | 4,930,934 | 655,381 |
| Mode SS | |||
|---|---|---|---|
| Quadrant | BADHDUFLAG | Total packets | Discarded packets |
| A | 0 | 162 | 0 |
| B | 0 | 162 | 0 |
| C | 0 | 162 | 0 |
| D | 0 | 162 | 0 |
| Mode M0 | |||
|---|---|---|---|
| Quadrant | BADHDUFLAG | Total packets | Discarded packets |
| A | 0 | 17992 | 3 |
| B | 0 | 16724 | 3 |
| C | 0 | 29053 | 3 |
| D | 0 | 19704 | 3 |
| Mode M9 | |||
|---|---|---|---|
| Quadrant | BADHDUFLAG | Total packets | Discarded packets |
| A | 0 | 10 | 0 |
| B | 0 | 10 | 0 |
| C | 0 | 10 | 0 |
| D | 0 | 10 | 0 |
| Quadrant | Total seconds | Saturated seconds | Saturation percentage |
|---|---|---|---|
| A | 7788 | 280 | 3.595275% |
| B | 7788 | 258 | 3.312789% |
| C | 7788 | 1007 | 12.930149% |
| D | 7788 | 123 | 1.579353% |
Noise dominated data is calculated using 1-second bins in cleaned event files. If a bin has >2000 counts, and if more than 50% of those come from <1% of pixels, then it is considered to be noise-dominated and hence unusable.
| Quadrant | # 1 sec bins | Bins with >0 counts | Bins with >2000 counts | High rate bins dominated by noise | Noise dominated (total time) | Noise dominated (detector-on time) | Marked lightcurve |
|---|---|---|---|---|---|---|---|
| A | 8883 | 7792 | 146 | 146 | 1.64% | 1.87% | 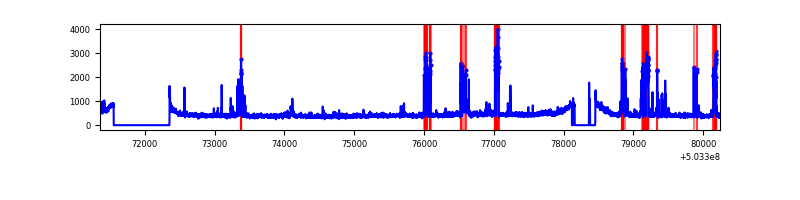 |
| B | 8883 | 7792 | 14 | 14 | 0.16% | 0.18% | 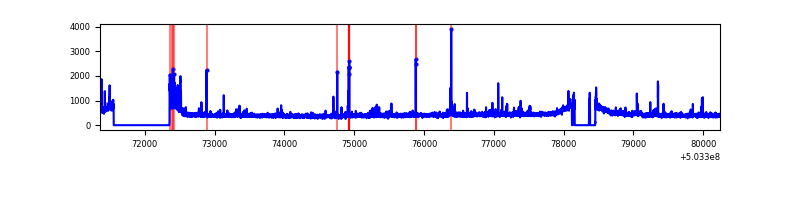 |
| C | 8883 | 7792 | 856 | 856 | 9.64% | 10.99% | 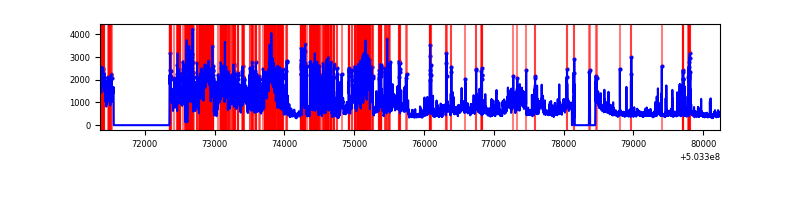 |
| D | 8883 | 7792 | 50 | 50 | 0.56% | 0.64% | 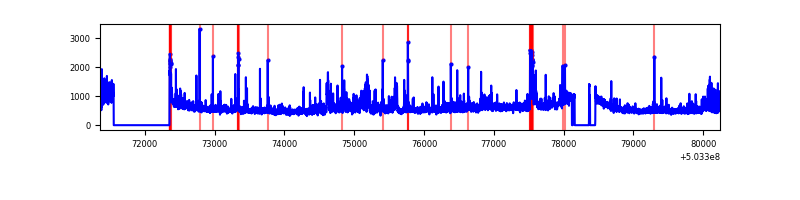 |
Top three noisy pixels from each quadrant. If the there are fewer than three noisy pixels in the level2.evt file, extra rows are filled as -1
| Pixel properties | Quadrant properties | ||||||
|---|---|---|---|---|---|---|---|
| Quadrant | DetID | PixID | Counts | Sigma | Mean | Median | Sigma |
| A | 0 | 8 | 647151 | 3197.1 | 828 | 809 | 202.2 |
| A | 12 | 115 | 44199 | 214.63 | 828 | 809 | 202.2 |
| A | 4 | 205 | 38796 | 187.9 | 828 | 809 | 202.2 |
| B | 5 | 185 | 71772 | 399.79 | 825 | 793 | 177.5 |
| B | 2 | 249 | 55312 | 307.08 | 825 | 793 | 177.5 |
| B | 5 | 172 | 40108 | 221.44 | 825 | 793 | 177.5 |
| C | 9 | 38 | 2296768 | 10799.02 | 781 | 775 | 212.6 |
| C | 12 | 254 | 1307283 | 6145.06 | 781 | 775 | 212.6 |
| C | 1 | 16 | 465879 | 2187.58 | 781 | 775 | 212.6 |
| D | 5 | 38 | 984311 | 4324.27 | 811 | 777 | 227.4 |
| D | 2 | 249 | 251539 | 1102.52 | 811 | 777 | 227.4 |
| D | 2 | 31 | 171873 | 752.25 | 811 | 777 | 227.4 |
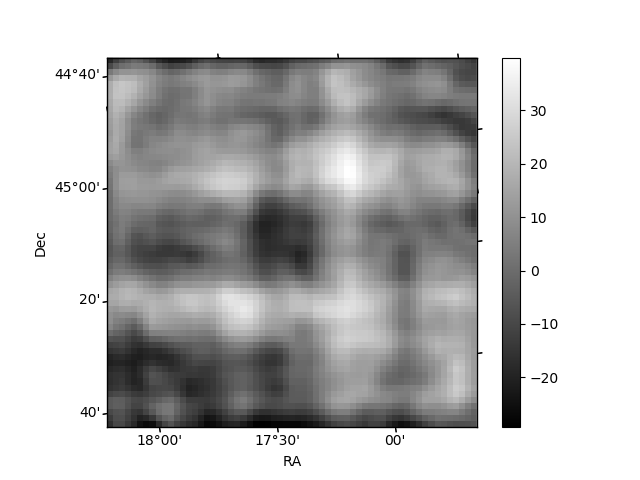
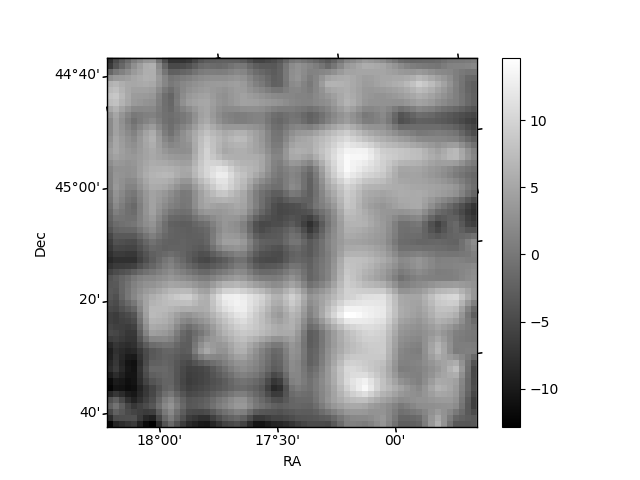
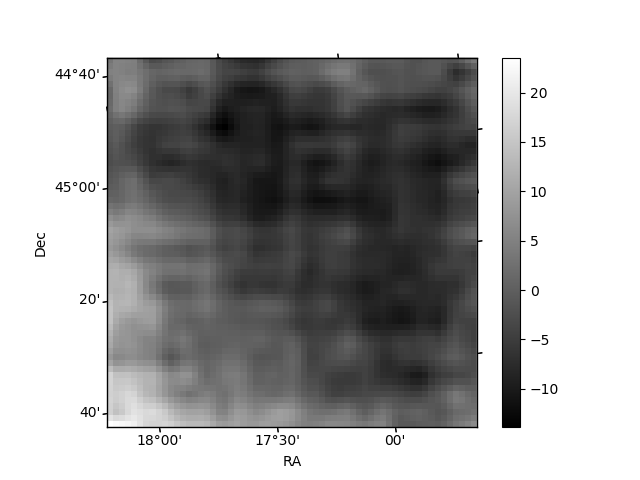
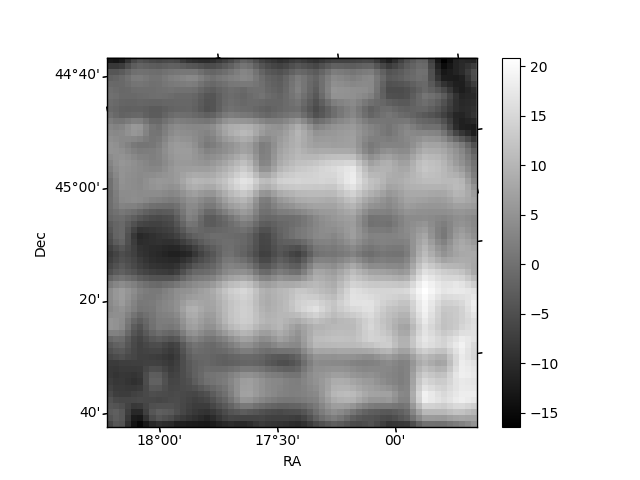
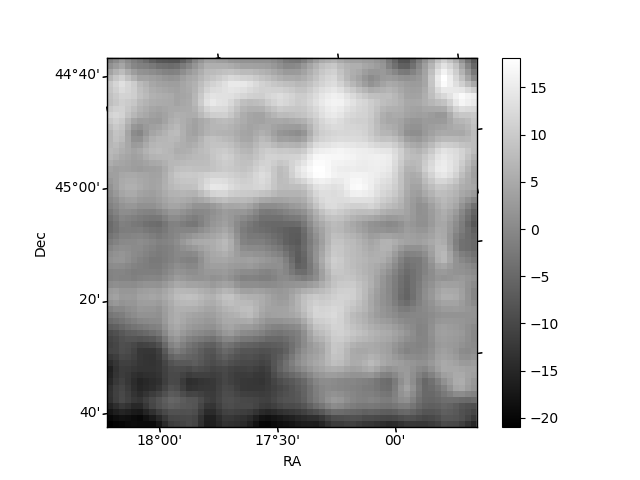
Histogram calculated using DETX and DETY for each event in the final _common_clean file
| Quadrant A | 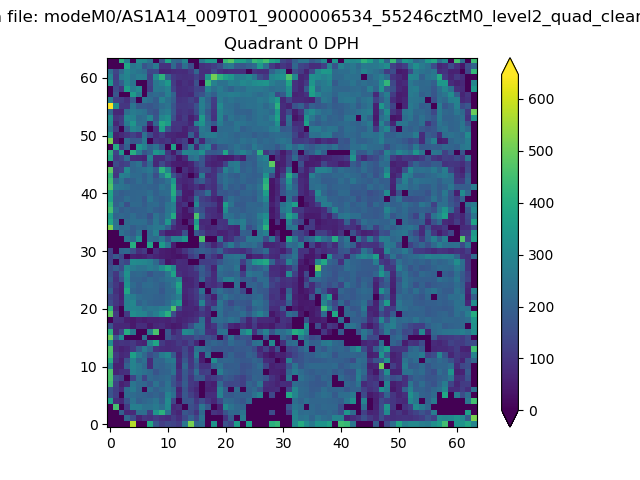 |
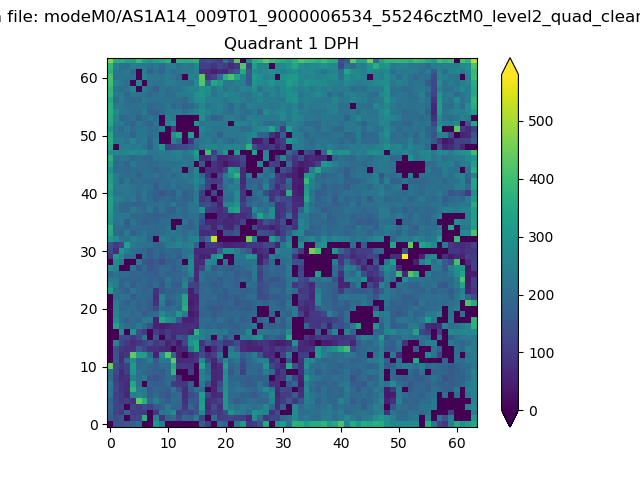 |
Quadrant B |
|---|---|---|---|
| Quadrant D | 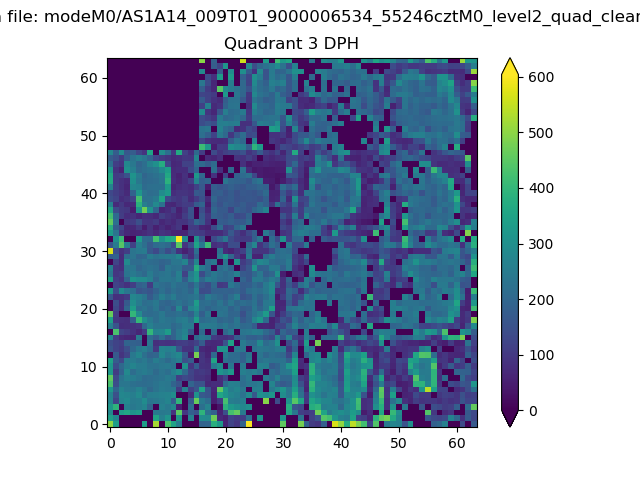 |
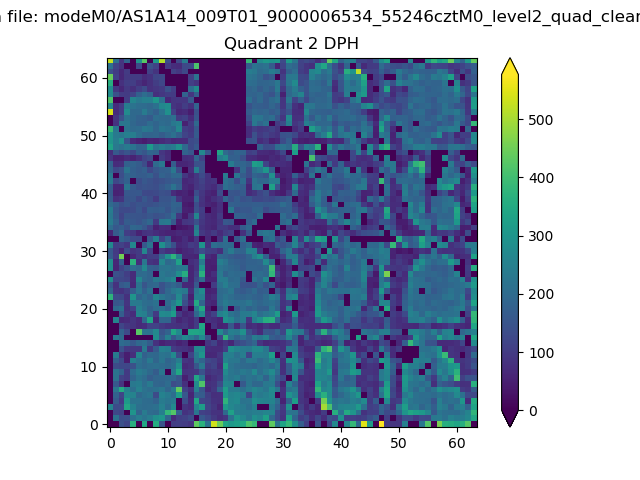 |
Quadrant C |
| Plot type | Count rate plots | Images |
|---|---|---|
| Comparison with Poisson distribution Blue bars denote a histogram of data divided into 1 sec bins. Red curve is a Poisson curve with rate = median count rate of data. |
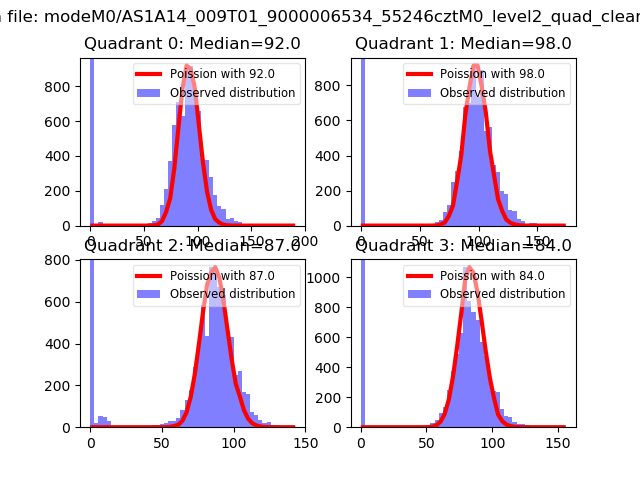 |
 |
| Quadrant-wise count rates Data is divided into 100 sec bins |
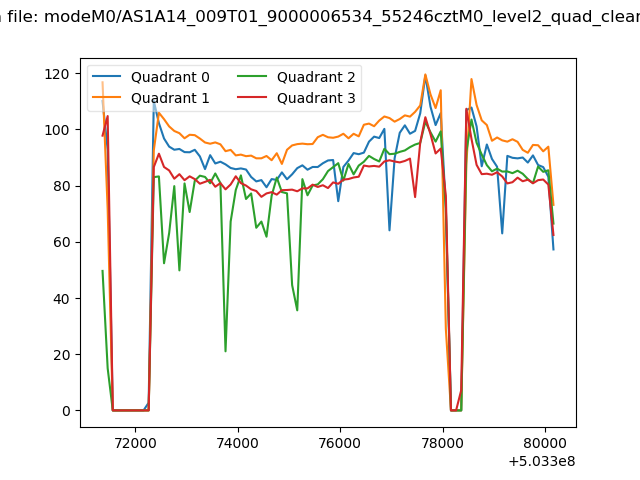 |
|
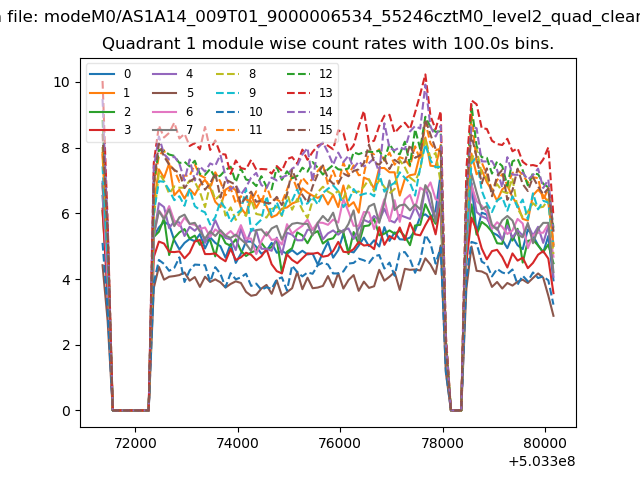
| Module-wise count rates for Quadrant A Data is divided into 100 sec bins |
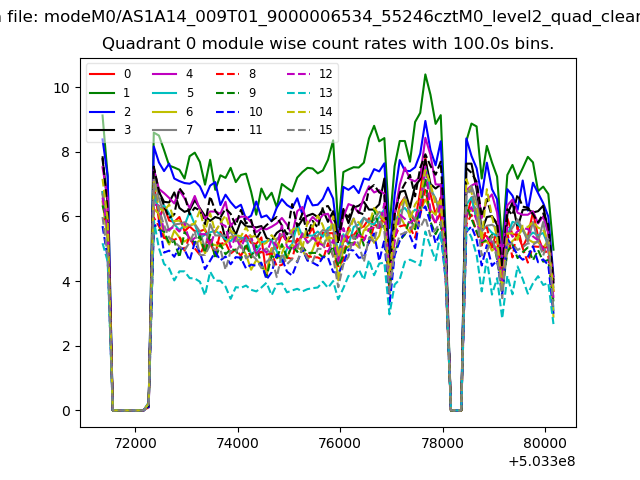 |
 |
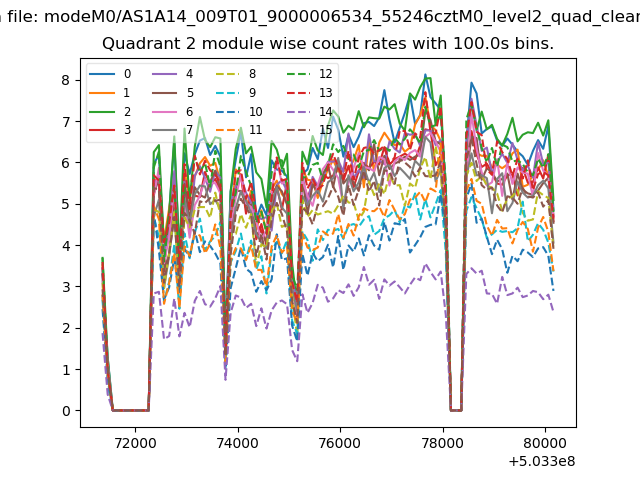
| Module-wise count rates for Quadrant B Data is divided into 100 sec bins |
 |
 |
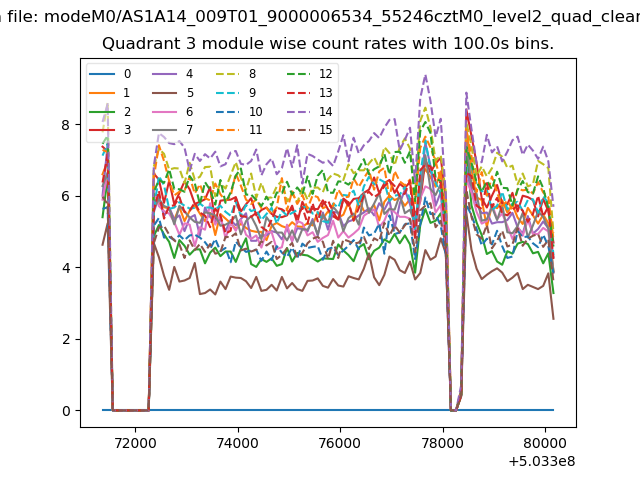
| Module-wise count rates for Quadrant C Data is divided into 100 sec bins |
 |
 |
| Module-wise count rates for Quadrant D Data is divided into 100 sec bins |
 |
 |
| Parameter | Plot |
|---|---|
| CZT HV Monitor | 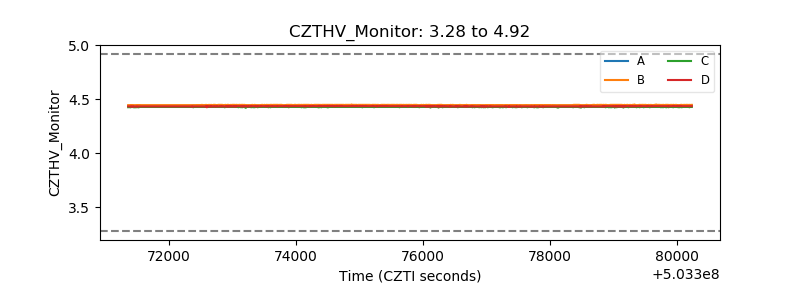 |
| D_VDD | 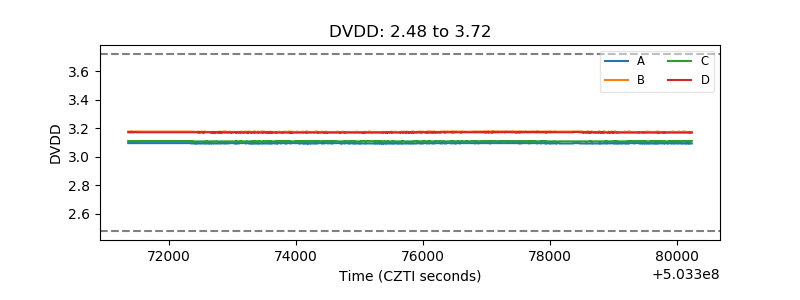 |
| Temperature 1 | 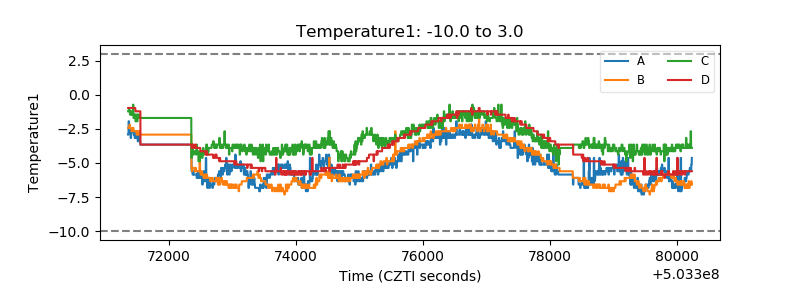 |
| Veto HV Monitor | 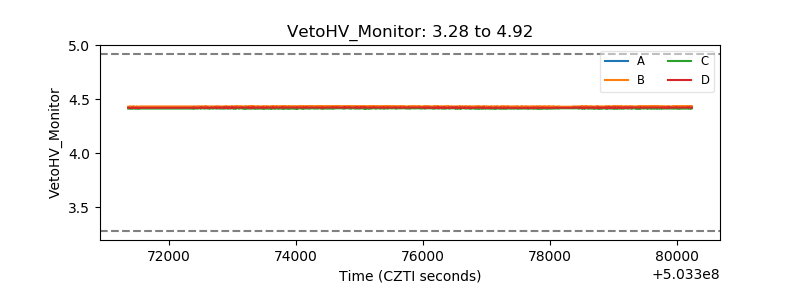 |
| Veto LLD | 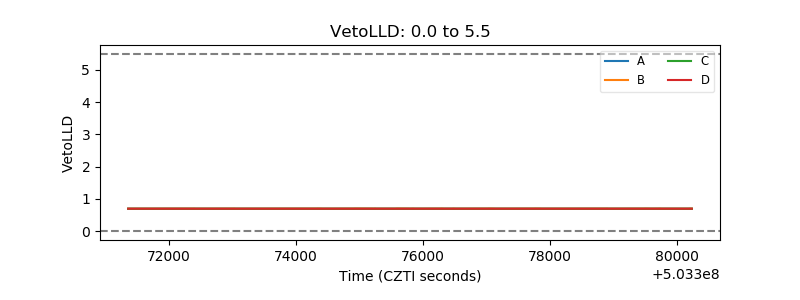 |
| Alpha Counter | 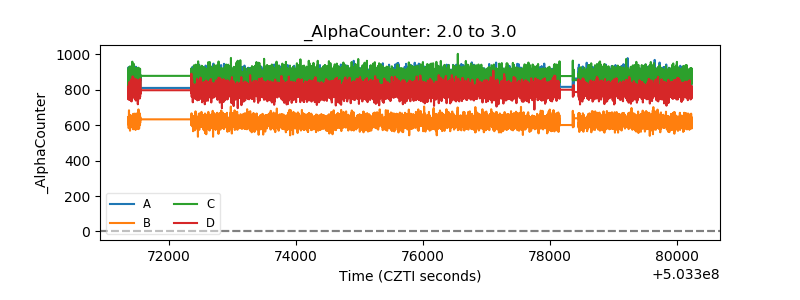 |
| _CPM_Rate | 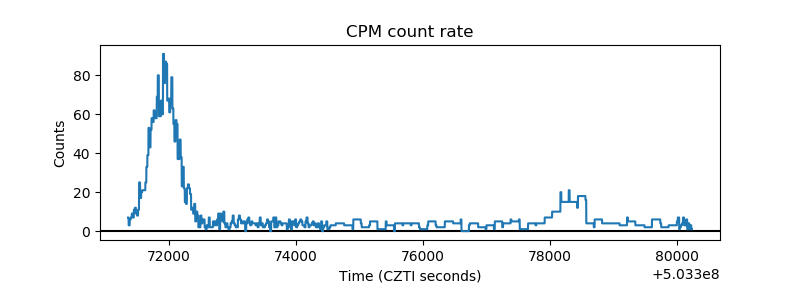 |
| CZT Counter | 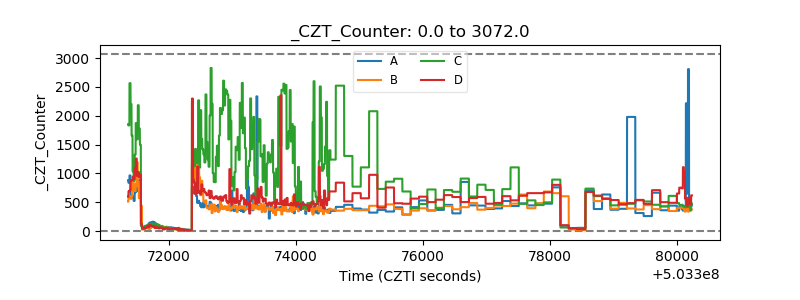 |
| +2.5 Volts monitor | 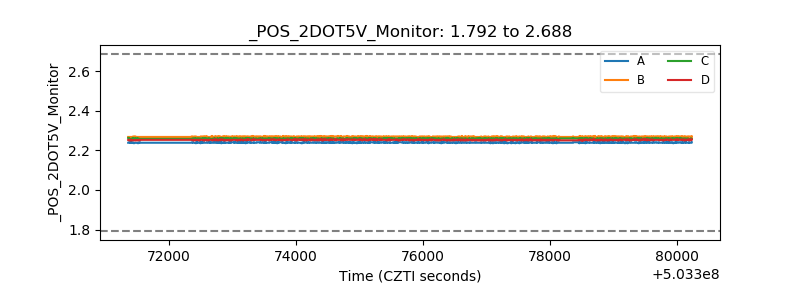 |
| +5 Volts monitor | 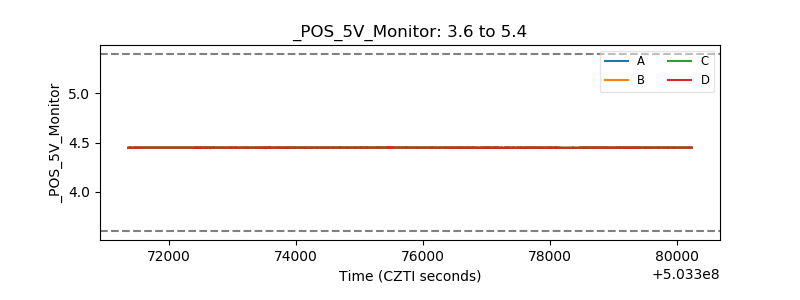 |
| _ROLL_ROT | 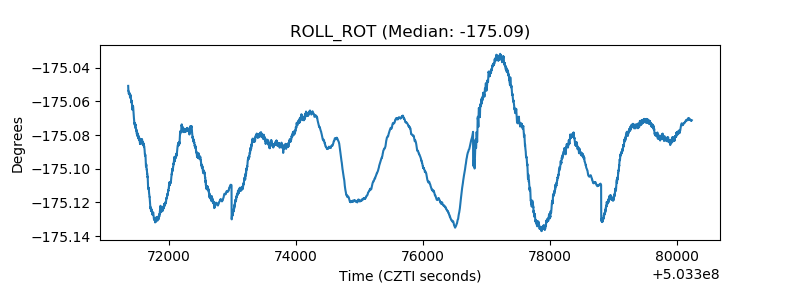 |
| _Roll_DEC | 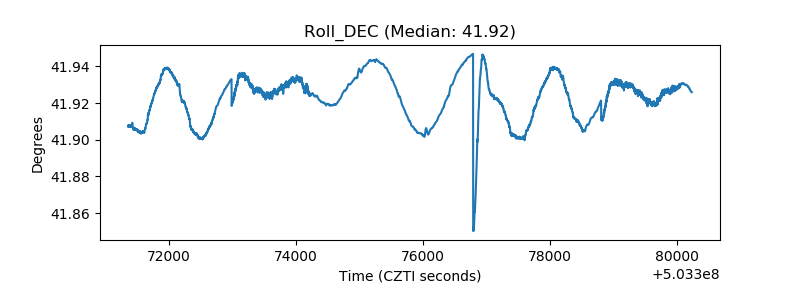 |
| _Roll_RA | 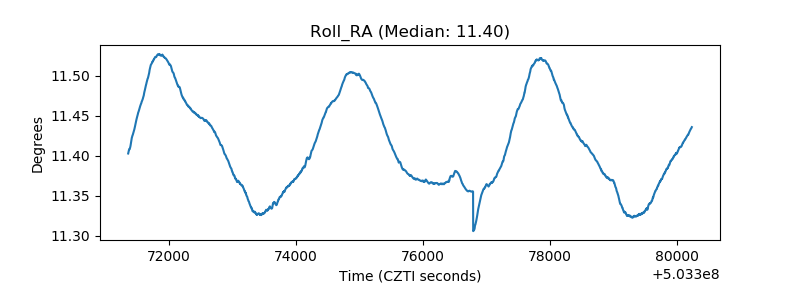 |
| Veto Counter | 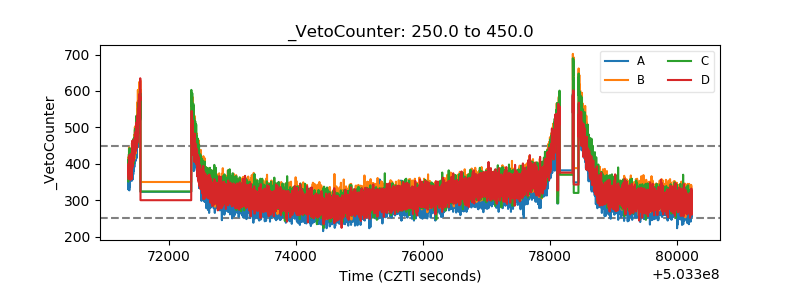 |