| Param | Original file | Final file |
|---|---|---|
| Filename | modeM0/AS1A14_009T01_9000006534_55247cztM0_level2.fits | modeM0/AS1A14_009T01_9000006534_55247cztM0_level2_quad_clean.evt |
| Size (bytes) | 572,042,880 | 112,740,480 |
| Size | 545.5 MB | 107.5 MB |
| Events in quadrant A | 4,162,685 | 734,085 |
| Events in quadrant B | 4,127,988 | 772,015 |
| Events in quadrant C | 6,397,645 | 685,186 |
| Events in quadrant D | 5,855,407 | 656,585 |
| Mode SS | |||
|---|---|---|---|
| Quadrant | BADHDUFLAG | Total packets | Discarded packets |
| A | 0 | 166 | 0 |
| B | 0 | 166 | 0 |
| C | 0 | 166 | 0 |
| D | 0 | 166 | 0 |
| Mode M0 | |||
|---|---|---|---|
| Quadrant | BADHDUFLAG | Total packets | Discarded packets |
| A | 0 | 18338 | 2 |
| B | 0 | 18575 | 2 |
| C | 0 | 24634 | 8 |
| D | 0 | 22645 | 2 |
| Mode M9 | |||
|---|---|---|---|
| Quadrant | BADHDUFLAG | Total packets | Discarded packets |
| A | 0 | 2 | 0 |
| B | 0 | 2 | 0 |
| C | 0 | 2 | 0 |
| D | 0 | 2 | 0 |
| Quadrant | Total seconds | Saturated seconds | Saturation percentage |
|---|---|---|---|
| A | 8135 | 157 | 1.929932% |
| B | 8135 | 331 | 4.068838% |
| C | 8134 | 626 | 7.696090% |
| D | 8134 | 416 | 5.114335% |
Noise dominated data is calculated using 1-second bins in cleaned event files. If a bin has >2000 counts, and if more than 50% of those come from <1% of pixels, then it is considered to be noise-dominated and hence unusable.
| Quadrant | # 1 sec bins | Bins with >0 counts | Bins with >2000 counts | High rate bins dominated by noise | Noise dominated (total time) | Noise dominated (detector-on time) | Marked lightcurve |
|---|---|---|---|---|---|---|---|
| A | 8430 | 8138 | 84 | 84 | 1.00% | 1.03% | 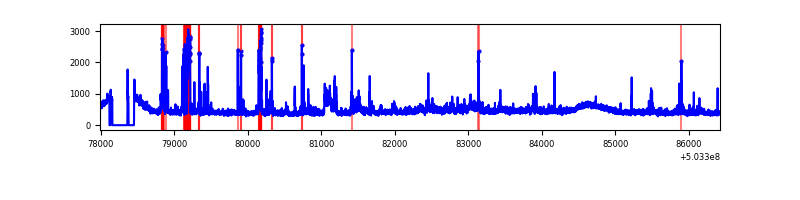 |
| B | 8430 | 8138 | 141 | 141 | 1.67% | 1.73% | 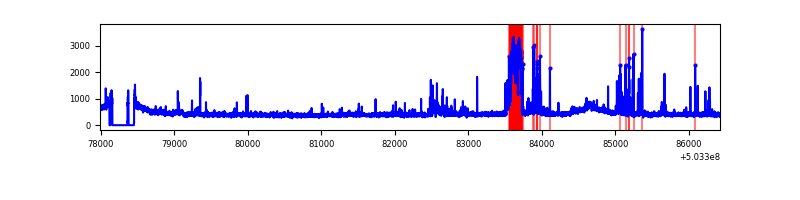 |
| C | 8429 | 8137 | 489 | 489 | 5.80% | 6.01% | 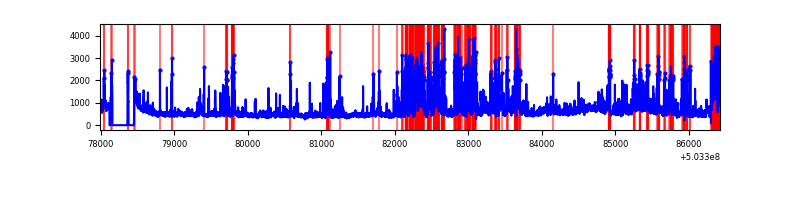 |
| D | 8429 | 8137 | 342 | 342 | 4.06% | 4.20% | 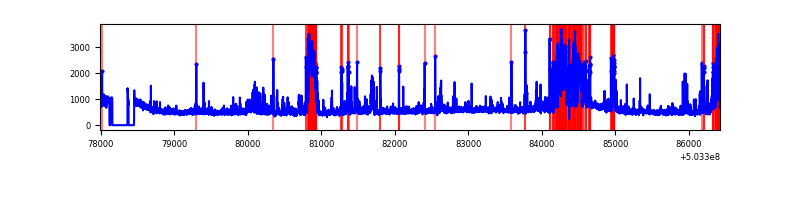 |
Top three noisy pixels from each quadrant. If the there are fewer than three noisy pixels in the level2.evt file, extra rows are filled as -1
| Pixel properties | Quadrant properties | ||||||
|---|---|---|---|---|---|---|---|
| Quadrant | DetID | PixID | Counts | Sigma | Mean | Median | Sigma |
| A | 0 | 8 | 413203 | 1967.53 | 865 | 842 | 209.6 |
| A | 12 | 115 | 246338 | 1171.36 | 865 | 842 | 209.6 |
| A | 4 | 205 | 51684 | 242.59 | 865 | 842 | 209.6 |
| B | 10 | 245 | 391043 | 2130.37 | 855 | 822 | 183.2 |
| B | 2 | 249 | 132504 | 718.9 | 855 | 822 | 183.2 |
| B | 5 | 185 | 89486 | 484.05 | 855 | 822 | 183.2 |
| C | 12 | 254 | 1330391 | 5878.82 | 828 | 820 | 226.2 |
| C | 9 | 38 | 544391 | 2403.45 | 828 | 820 | 226.2 |
| C | 13 | 3 | 359992 | 1588.11 | 828 | 820 | 226.2 |
| D | 5 | 38 | 995960 | 4280.27 | 832 | 797 | 232.5 |
| D | 12 | 6 | 636007 | 2732.08 | 832 | 797 | 232.5 |
| D | 2 | 31 | 549761 | 2361.13 | 832 | 797 | 232.5 |
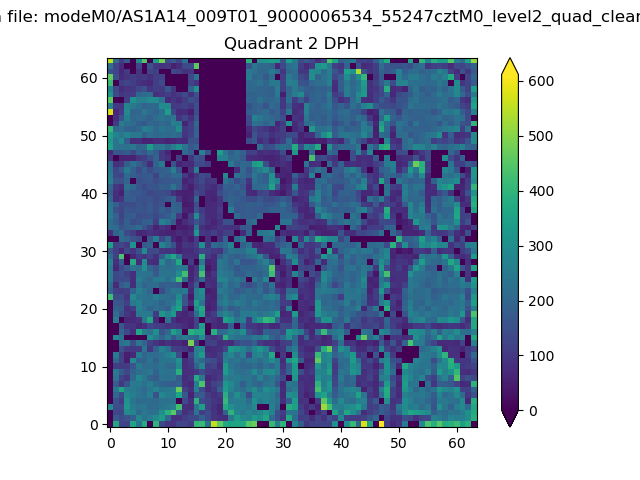
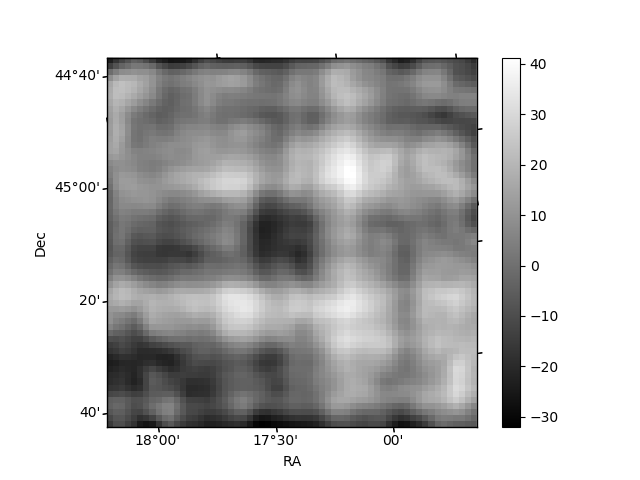
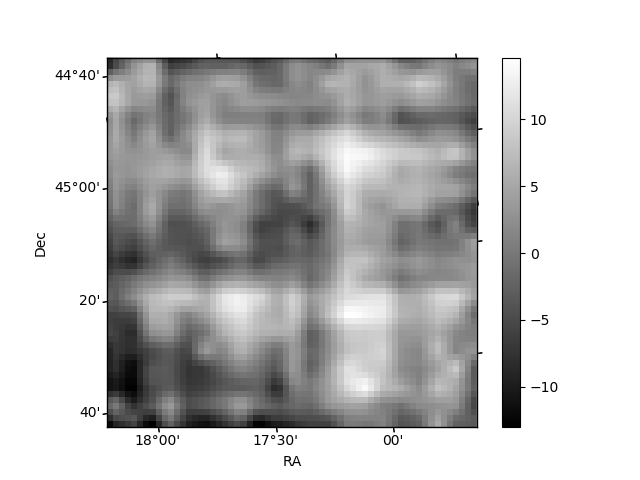
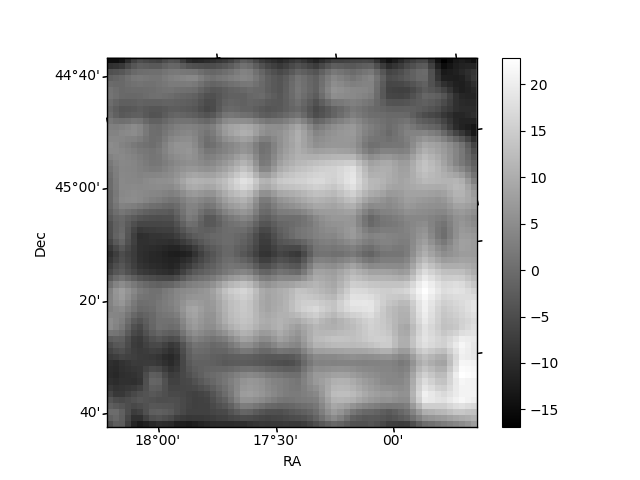
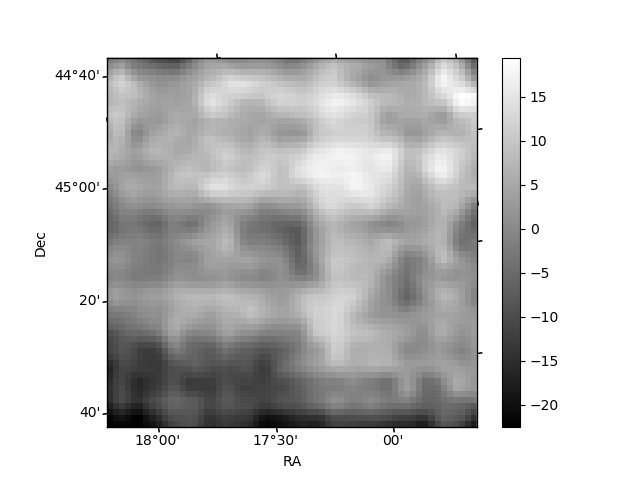
Histogram calculated using DETX and DETY for each event in the final _common_clean file
| Quadrant A | 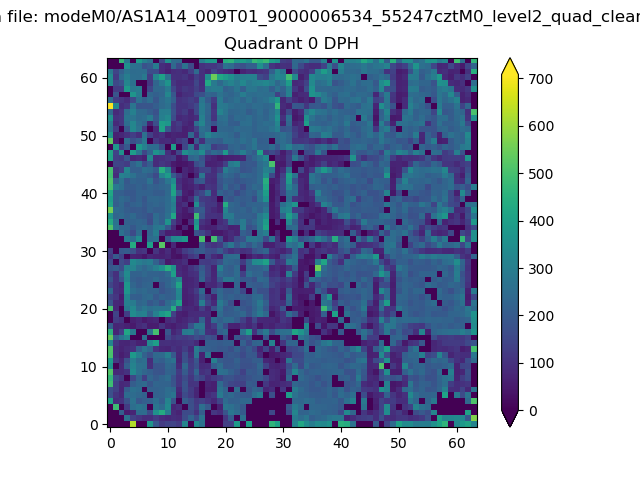 |
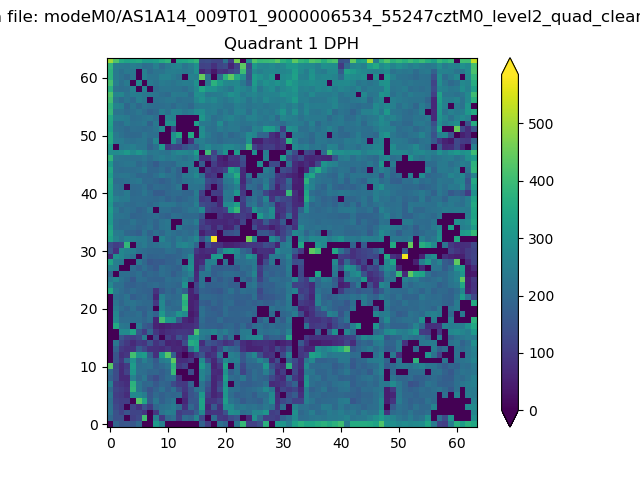 |
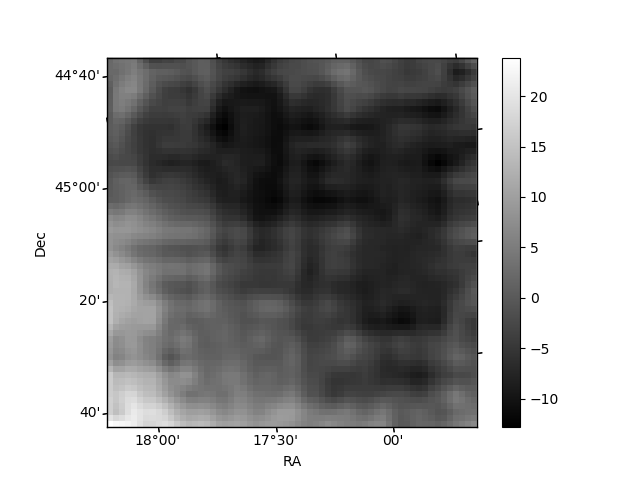
Quadrant B |
|---|---|---|---|
| Quadrant D | 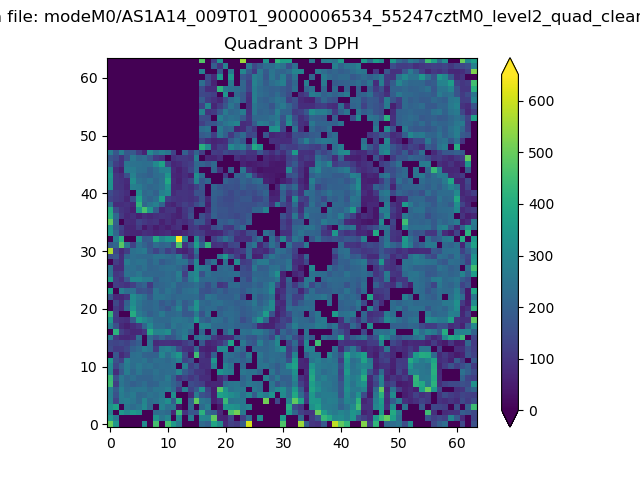 |
 |
Quadrant C |
| Plot type | Count rate plots | Images |
|---|---|---|
| Comparison with Poisson distribution Blue bars denote a histogram of data divided into 1 sec bins. Red curve is a Poisson curve with rate = median count rate of data. |
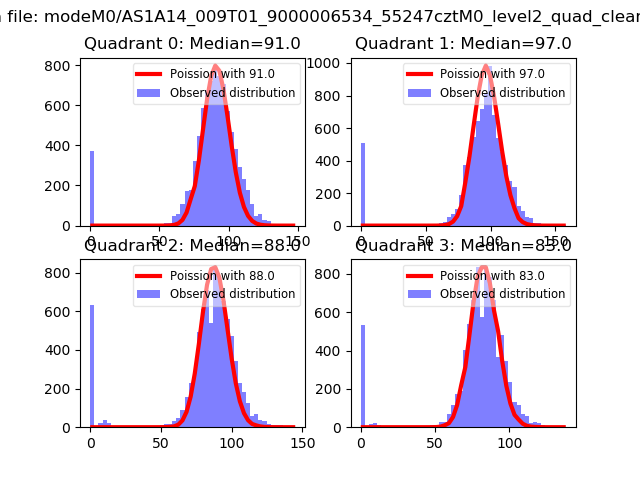 |
 |
| Quadrant-wise count rates Data is divided into 100 sec bins |
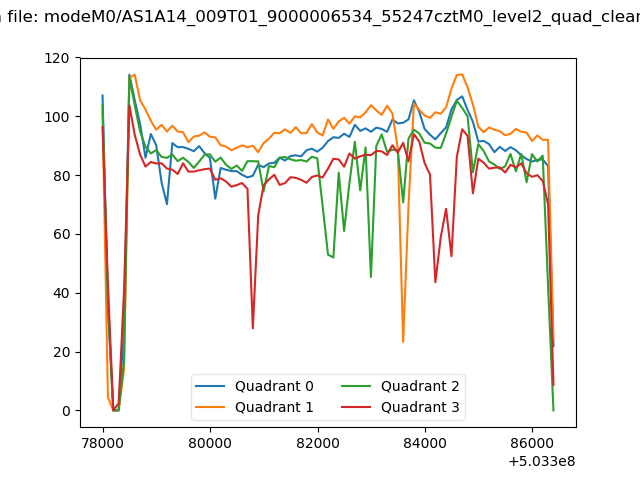 |
|
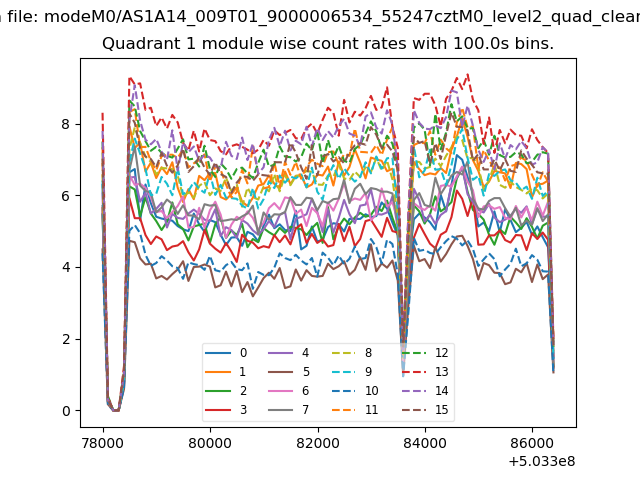
| Module-wise count rates for Quadrant A Data is divided into 100 sec bins |
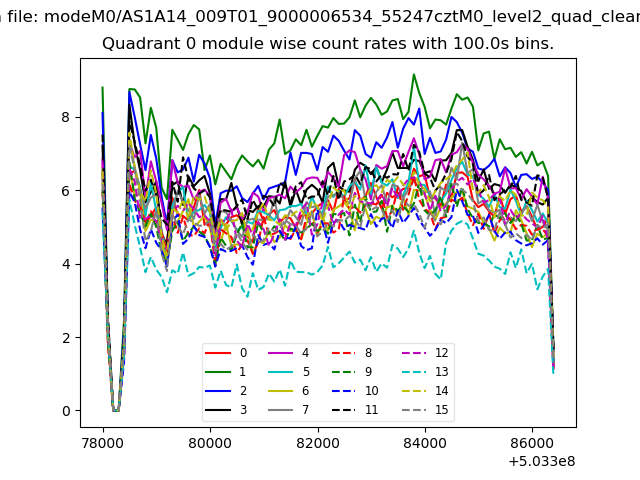 |
 |
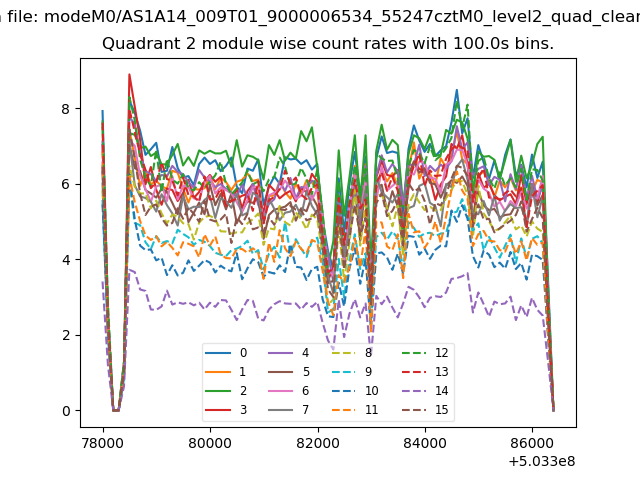
| Module-wise count rates for Quadrant B Data is divided into 100 sec bins |
 |
 |
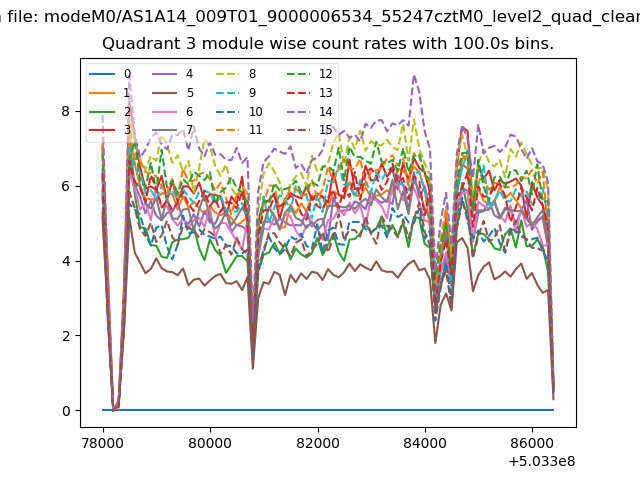
| Module-wise count rates for Quadrant C Data is divided into 100 sec bins |
 |
 |
| Module-wise count rates for Quadrant D Data is divided into 100 sec bins |
 |
 |
| Parameter | Plot |
|---|---|
| CZT HV Monitor | 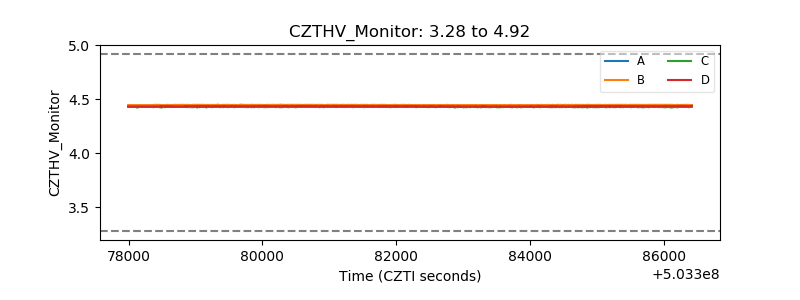 |
| D_VDD | 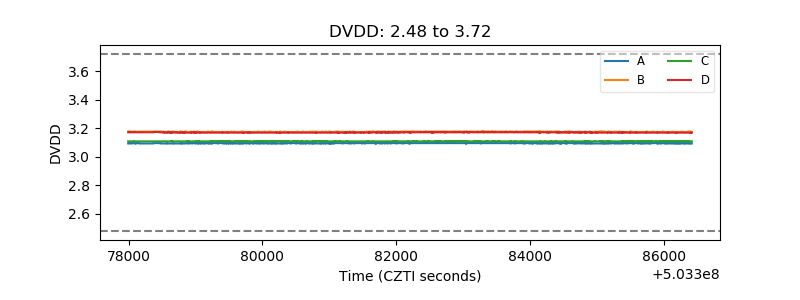 |
| Temperature 1 | 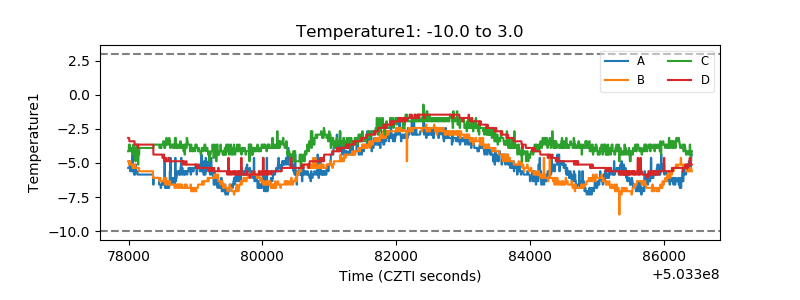 |
| Veto HV Monitor | 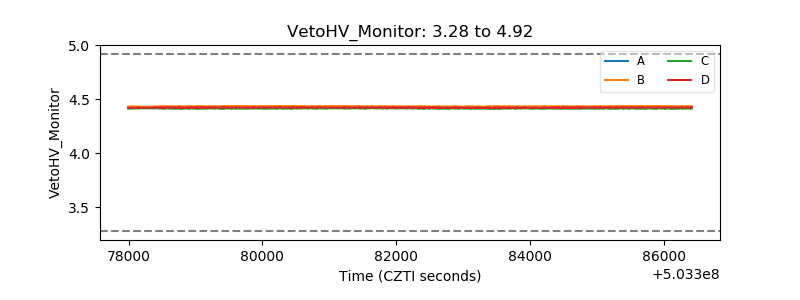 |
| Veto LLD | 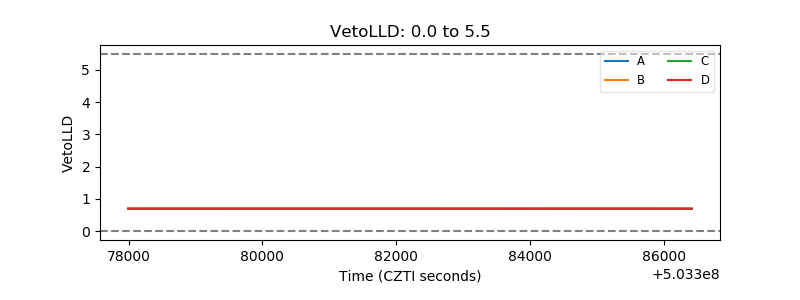 |
| Alpha Counter | 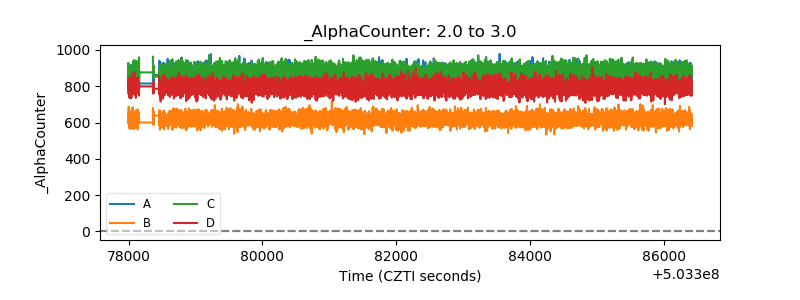 |
| _CPM_Rate | 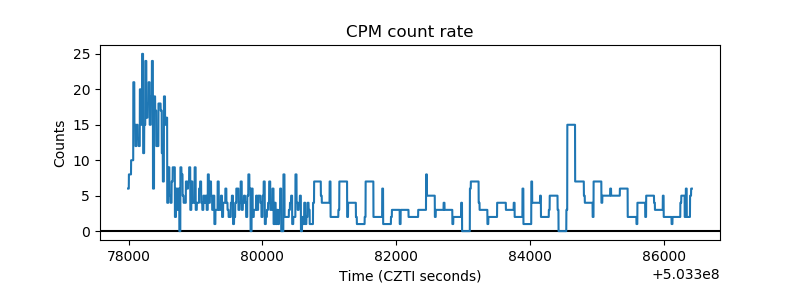 |
| CZT Counter | 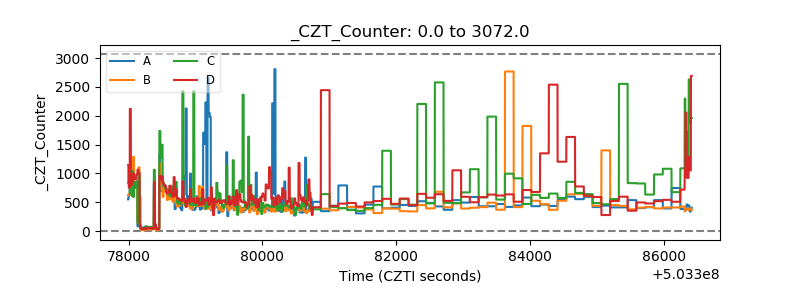 |
| +2.5 Volts monitor |  |
| +5 Volts monitor |  |
| _ROLL_ROT | 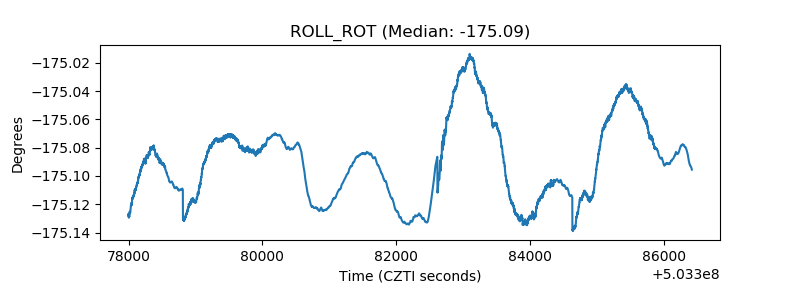 |
| _Roll_DEC | 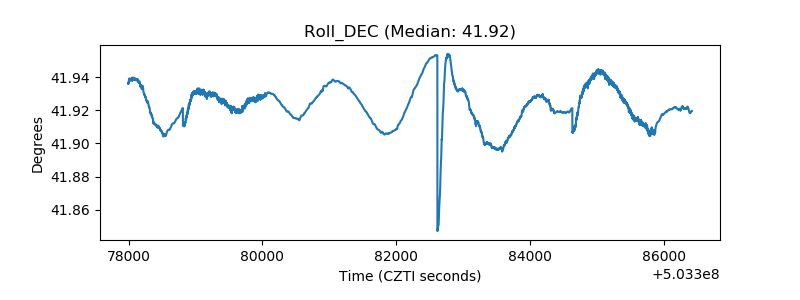 |
| _Roll_RA | 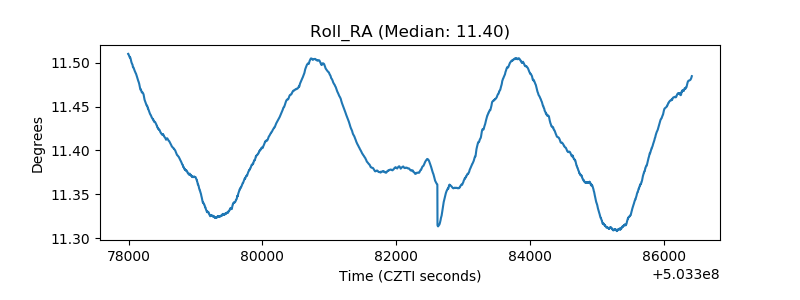 |
| Veto Counter | 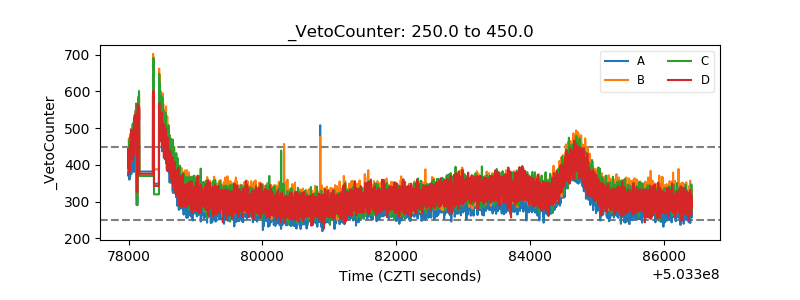 |