| Param | Original file | Final file |
|---|---|---|
| Filename | modeM0/AS1A14_009T01_9000006534_55248cztM0_level2.fits | modeM0/AS1A14_009T01_9000006534_55248cztM0_level2_quad_clean.evt |
| Size (bytes) | 603,771,840 | 113,875,200 |
| Size | 575.8 MB | 108.6 MB |
| Events in quadrant A | 3,822,516 | 745,783 |
| Events in quadrant B | 3,854,947 | 803,136 |
| Events in quadrant C | 8,265,479 | 653,928 |
| Events in quadrant D | 5,768,768 | 673,345 |
| Mode SS | |||
|---|---|---|---|
| Quadrant | BADHDUFLAG | Total packets | Discarded packets |
| A | 0 | 166 | 0 |
| B | 0 | 166 | 0 |
| C | 0 | 166 | 0 |
| D | 0 | 166 | 0 |
| Mode M0 | |||
|---|---|---|---|
| Quadrant | BADHDUFLAG | Total packets | Discarded packets |
| A | 0 | 17691 | 0 |
| B | 0 | 17905 | 0 |
| C | 0 | 30211 | 1 |
| D | 0 | 22595 | 0 |
| Quadrant | Total seconds | Saturated seconds | Saturation percentage |
|---|---|---|---|
| A | 8222 | 61 | 0.741912% |
| B | 8223 | 145 | 1.763347% |
| C | 8222 | 1045 | 12.709803% |
| D | 8222 | 241 | 2.931160% |
Noise dominated data is calculated using 1-second bins in cleaned event files. If a bin has >2000 counts, and if more than 50% of those come from <1% of pixels, then it is considered to be noise-dominated and hence unusable.
| Quadrant | # 1 sec bins | Bins with >0 counts | Bins with >2000 counts | High rate bins dominated by noise | Noise dominated (total time) | Noise dominated (detector-on time) | Marked lightcurve |
|---|---|---|---|---|---|---|---|
| A | 8222 | 8222 | 53 | 53 | 0.64% | 0.64% |  |
| B | 8223 | 8223 | 56 | 56 | 0.68% | 0.68% |  |
| C | 8222 | 8222 | 871 | 871 | 10.59% | 10.59% |  |
| D | 8222 | 8222 | 221 | 221 | 2.69% | 2.69% |  |
Top three noisy pixels from each quadrant. If the there are fewer than three noisy pixels in the level2.evt file, extra rows are filled as -1
| Pixel properties | Quadrant properties | ||||||
|---|---|---|---|---|---|---|---|
| Quadrant | DetID | PixID | Counts | Sigma | Mean | Median | Sigma |
| A | 0 | 8 | 208447 | 990.4 | 861 | 840 | 209.6 |
| A | 3 | 62 | 87818 | 414.93 | 861 | 840 | 209.6 |
| A | 8 | 6 | 50587 | 237.32 | 861 | 840 | 209.6 |
| B | 2 | 249 | 335926 | 1813.0 | 857 | 824 | 184.8 |
| B | 5 | 185 | 63165 | 337.28 | 857 | 824 | 184.8 |
| B | 10 | 247 | 28425 | 149.33 | 857 | 824 | 184.8 |
| C | 12 | 254 | 3067077 | 14098.18 | 799 | 793 | 217.5 |
| C | 1 | 16 | 540870 | 2483.17 | 799 | 793 | 217.5 |
| C | 9 | 38 | 470611 | 2160.13 | 799 | 793 | 217.5 |
| D | 5 | 38 | 1027818 | 4421.44 | 829 | 797 | 232.3 |
| D | 2 | 31 | 452864 | 1946.2 | 829 | 797 | 232.3 |
| D | 2 | 249 | 405984 | 1744.38 | 829 | 797 | 232.3 |
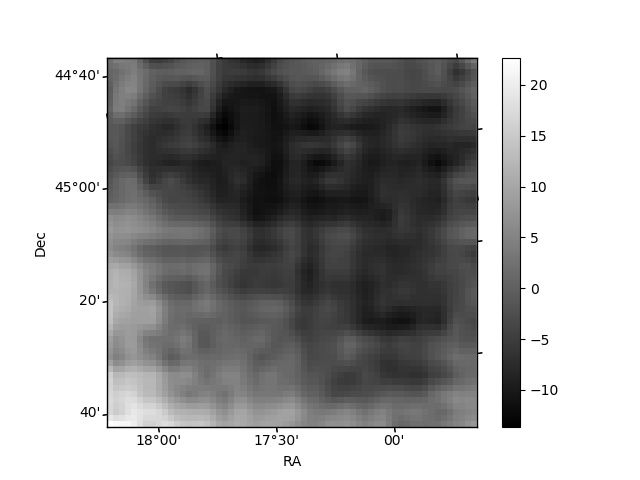
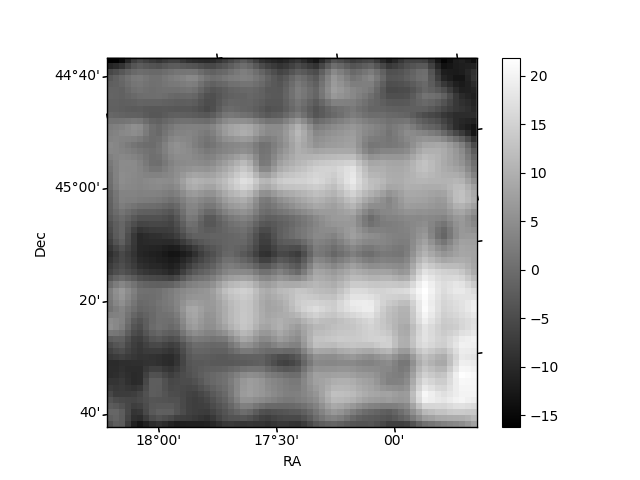
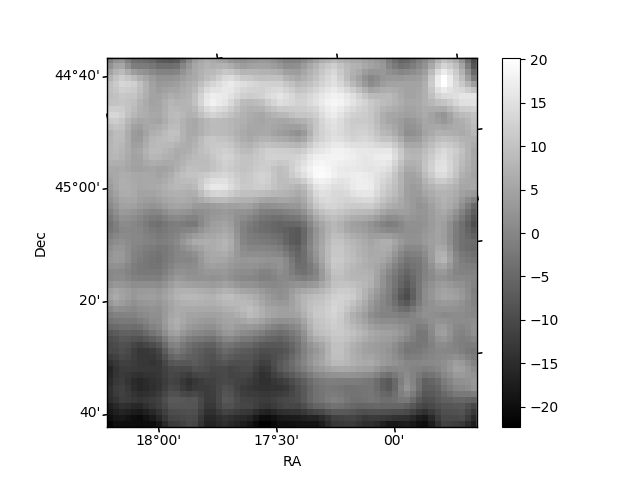
Histogram calculated using DETX and DETY for each event in the final _common_clean file
| Quadrant A | 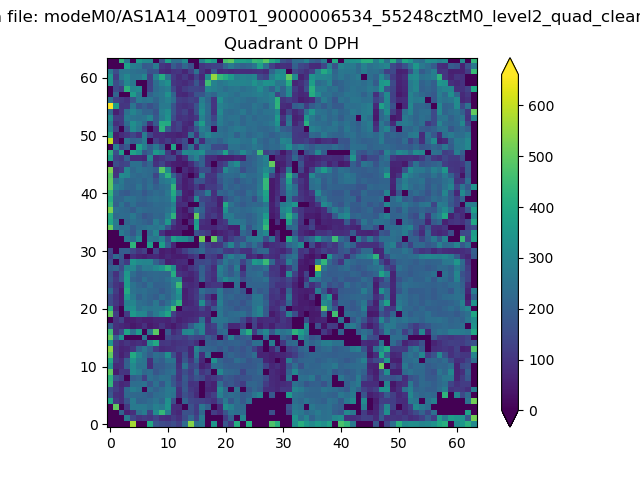 |
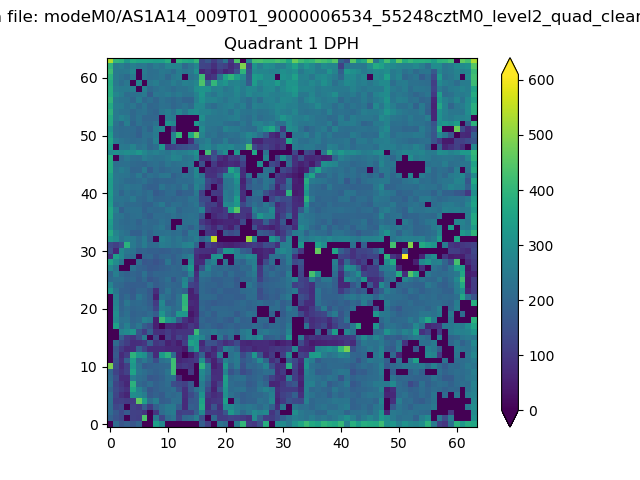 |
Quadrant B |
|---|---|---|---|
| Quadrant D | 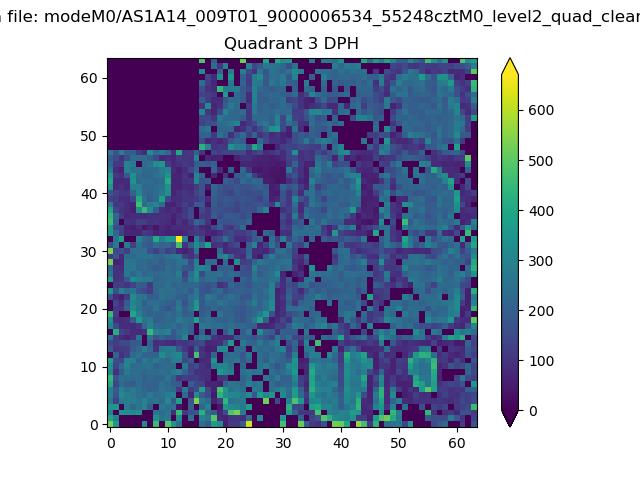 |
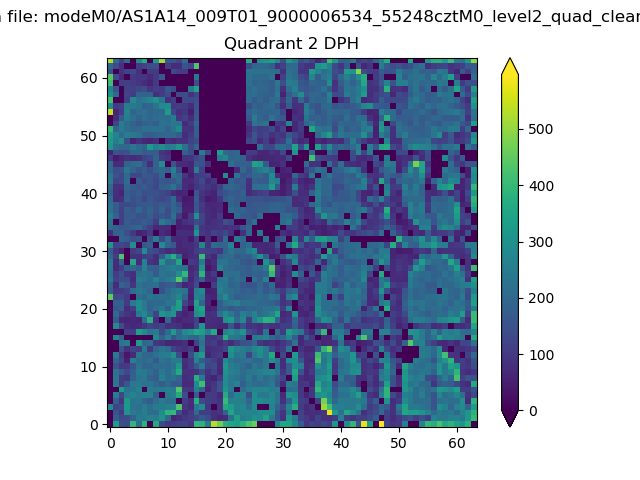 |
Quadrant C |
| Plot type | Count rate plots | Images |
|---|---|---|
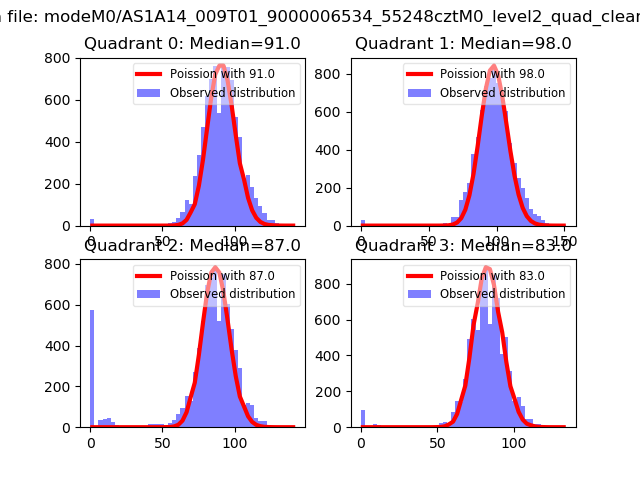
| Comparison with Poisson distribution Blue bars denote a histogram of data divided into 1 sec bins. Red curve is a Poisson curve with rate = median count rate of data. |
 |
 |
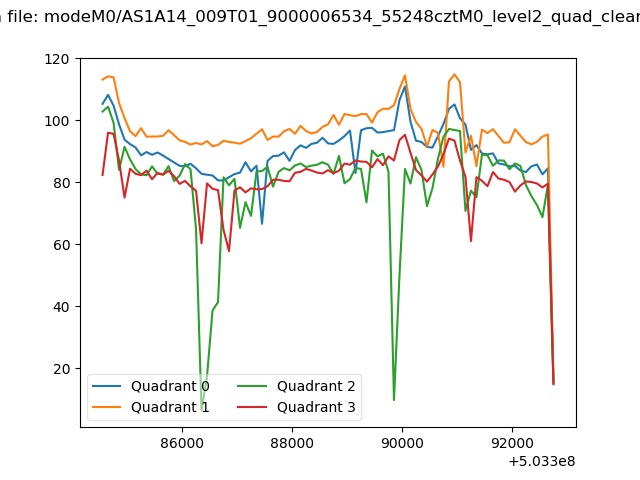
| Quadrant-wise count rates Data is divided into 100 sec bins |
 |
|
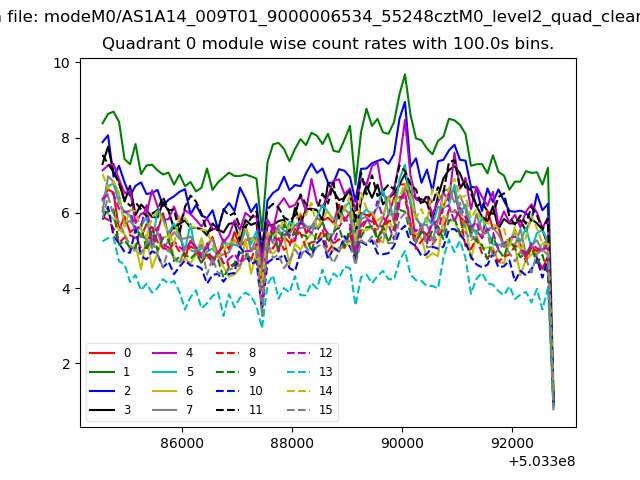
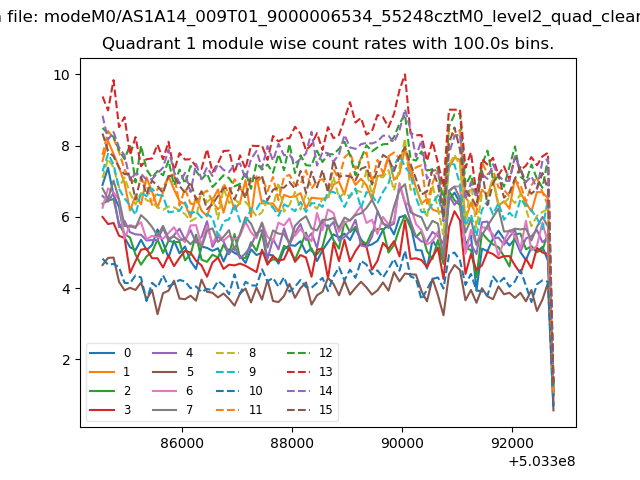
| Module-wise count rates for Quadrant A Data is divided into 100 sec bins |
 |
 |
| Module-wise count rates for Quadrant B Data is divided into 100 sec bins |
 |
 |
| Module-wise count rates for Quadrant C Data is divided into 100 sec bins |
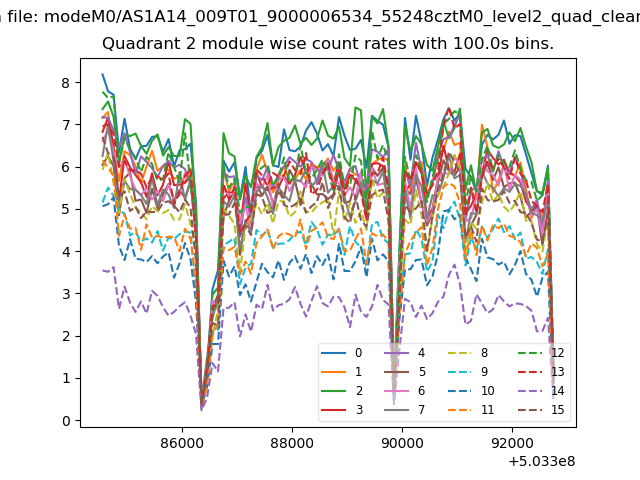 |
 |
| Module-wise count rates for Quadrant D Data is divided into 100 sec bins |
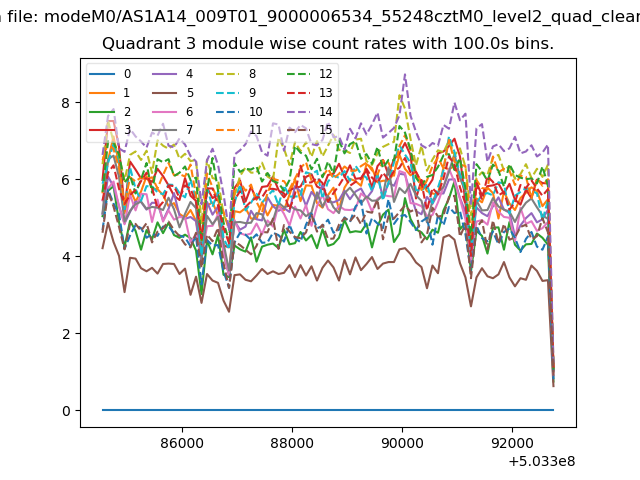 |
 |
| Parameter | Plot |
|---|---|
| CZT HV Monitor | 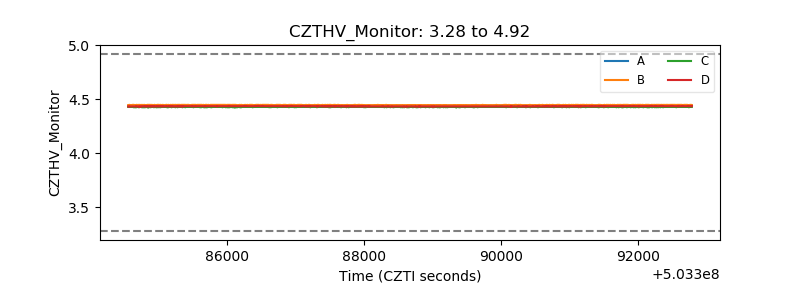 |
| D_VDD | 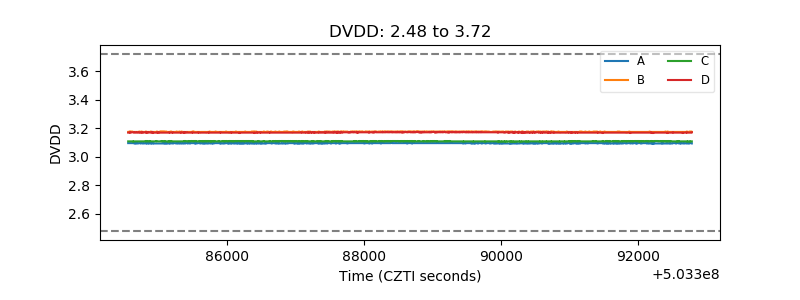 |
| Temperature 1 | 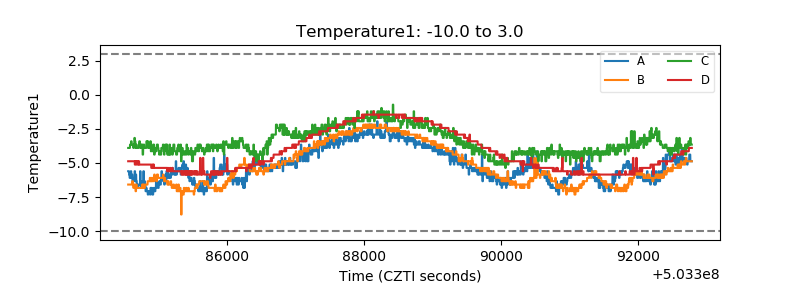 |
| Veto HV Monitor |  |
| Veto LLD | 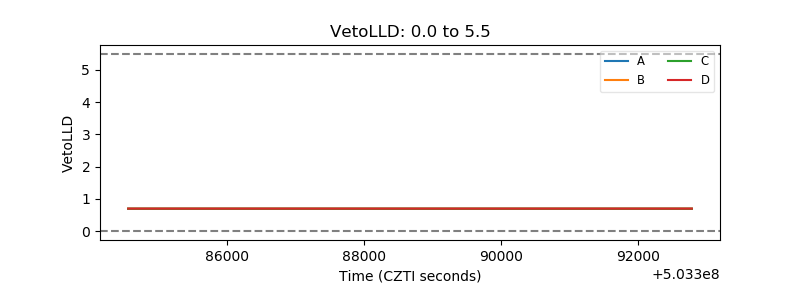 |
| Alpha Counter | 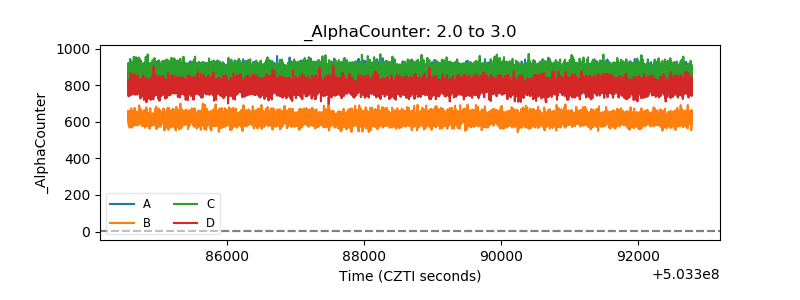 |
| _CPM_Rate | 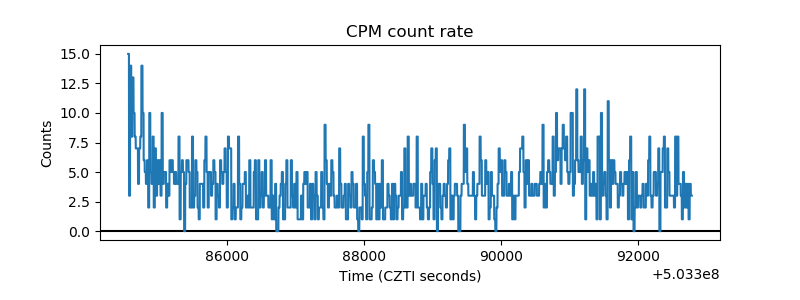 |
| CZT Counter | 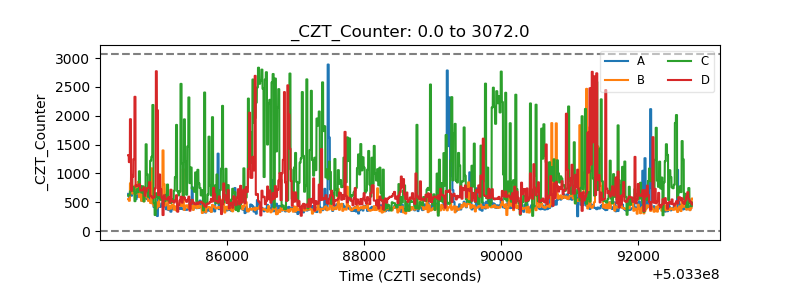 |
| +2.5 Volts monitor |  |
| +5 Volts monitor | 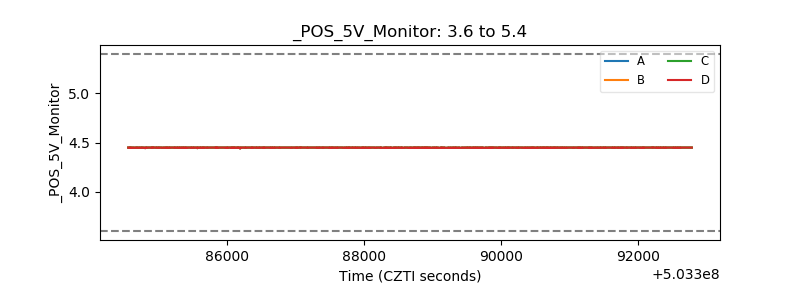 |
| _ROLL_ROT | 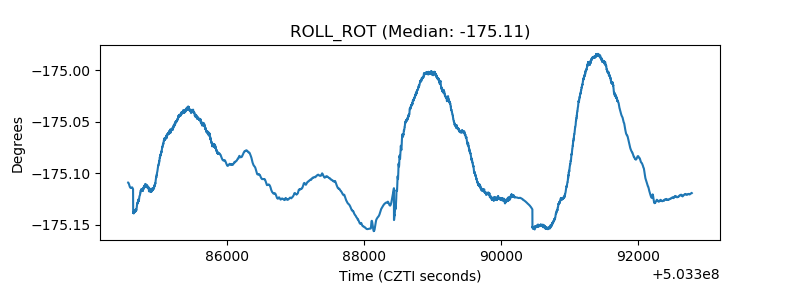 |
| _Roll_DEC | 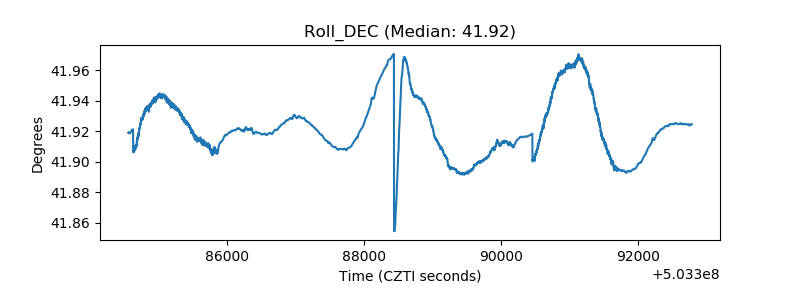 |
| _Roll_RA | 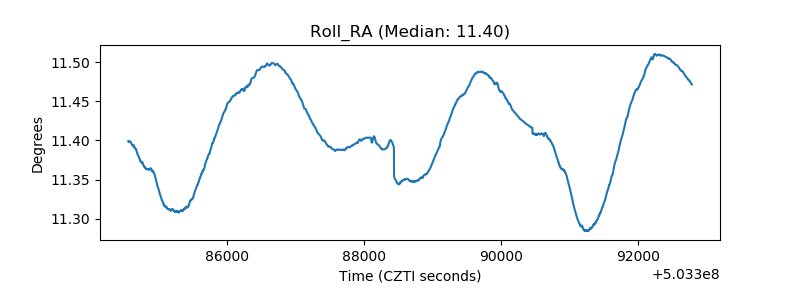 |
| Veto Counter | 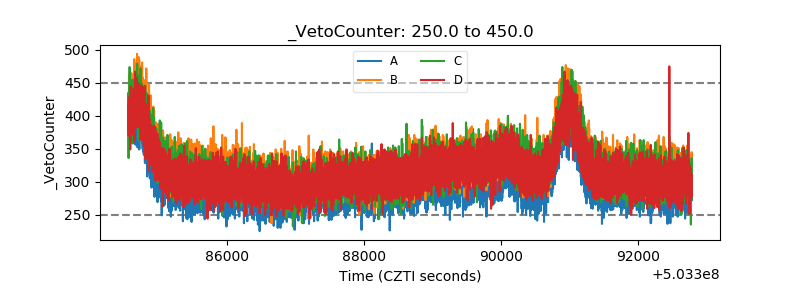 |